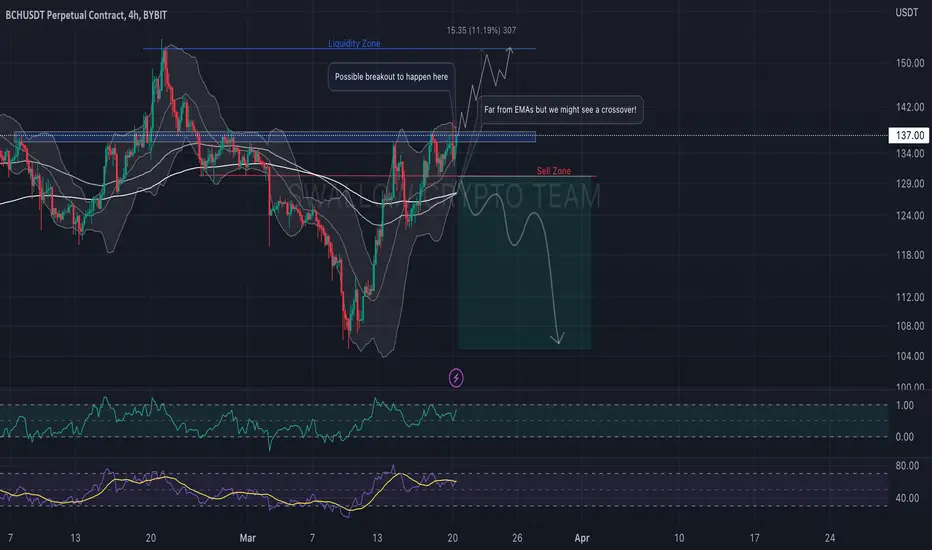
BCH/USDT possible movement Hey, traders ✌️
BCH/USDT pair is next on our watch list today. We see that price of this coin can see one more breakout attempt which can succeed but for how long? EMA zones are too far away and RSI with BB are both near overbought zones. Will be watching closely this one. Any thoughts guys?
If you like ideas provided by our team you can show us your support by liking and commenting.
Yours Sincerely,
Swallow Team 🔱
Disclamer:
We are not financial advisors. The content that we share on this website are for educational purposes and are our own personal opinions.
BCHUSDT trade ideas
Bch Long term Analysis Descending channel Breakout Has already Confirmed Now Waiting For Now for More Safer Entry Waiting for range To breakout to the upside
Rsi Also Printed Massive Bullish Divergence Incase Of Range Upside breakout expecting Massive recovery In coming Weeks Or months
our expected targets 276 410 & 800
This Type higher Timeframe entries Have Low Risk With high Rewards

✴️ Bitcoin Cash Next Target Mapped Series ($180 - $213 Next)Bitcoin Cash is looking good and we have two targets for this one.
The first stop should happen relatively fast and that's around $180.
The last target for this wave can happen around $213.
Now, this is just the potential target and these markets are "unpredictable" or hard to predict.
One can always predict the direction with a very high level of accuracy but it is hard to predict timing and exact targets.
You can use these levels as reference points.
This information is not to be construed as financial advice.
I am sharing my opinion, views and experience with you with good intentions.
Remember that there is always risk involved when trading.
Make sure to do your own research and plan ahead of time.
I am wishing you great luck, huge success, wealth & health.
You deserve the best, now & always.
Your support is highly appreciated.
Namaste.

$BCH/#USDT [#Bitcoin Cash]: BBand_Breakout Super-Trend◳◱ A Bollinger Band breakout and a Super Trend pattern have been noticed on the $BCH / $USDT chart, indicating a bullish trend. The Bollinger Band shows a probable positive trend as the price has moved outside of the upper band, while the Super Trend confirms the bullish trend. To buy at the current price range and aim for higher levels would be a solid option. The key resistance levels are located at 134.8 | 145.6 | 163.8, and the major support zones can be found at 116.6 | 109.2 | 91.
◰◲ General info :
▣ Name: Bitcoin Cash
▣ Rank: 28
▣ Exhanges: Binance, Kucoin, Bybit, Gateio
▣ Category/Sector: Payments - Currencies
▣ Overview: Bitcoin Cash is a Bitcoin hard fork advocating for and building towards a literal interpretation of Bitcoin as a "peer-to-peer electronic cash system". It views cheap peer to peer transactions as the core value proposition of the network and is dedicated to increasing block sizes and on-chain transaction throughput in pursuit of this goal. Bitcoin Cash believes that starting as a medium of exchange is the superior route to becoming money in opposition to Bitcoin's strategy of first optimizing for securely storing value.
◰◲ Technical Metrics :
▣ Mrkt Price: 115.1 ₮
▣ 24HVol: 4,531,965.424 ₮
▣ 24H Chng: 4.257%
▣ 7-Days Chng: -7.69%
▣ 1-Month Chng: -7.88%
▣ 3-Months Chng: 7.67%
◲◰ Pivot Points - Levels :
◥ Resistance: 134.8 | 145.6 | 163.8
◢ Support: 116.6 | 109.2 | 91
◱◳ Indicators recommendation :
▣ Oscillators: BUY
▣ Moving Averages: STRONG_BUY
◰◲ Technical Indicators Summary : BUY
◲◰ Sharpe Ratios :
▣ Last 30D: -1.82
▣ Last 90D: 0.84
▣ Last 1-Y: -0.70
▣ Last 3-Y: 0.29
◲◰ Volatility :
▣ Last 30D: 0.57
▣ Last 90D: 0.53
▣ Last 1-Y: 0.82
▣ Last 3-Y: 1.07
◳◰ Market Sentiment Index :
▣ News sentiment score is N/A
▣ Twitter sentiment score is 0.51 - Bullish
▣ Reddit sentiment score is 0.57 - Bullish
▣ In-depth BCHUSDT technical analysis on Tradingview TA page
▣ What do you think of this analysis? Share your insights and let's discuss in the comments below. Your like, follow and support would be greatly appreciated!
◲ Disclaimer
Please note that the information and publications provided are for informational purposes only and should not be construed as financial, investment, trading, or any other type of advice or recommendation. We encourage you to conduct your own research and consult with a qualified professional before making any financial decisions. The use of the information provided is solely at your own risk.
▣ Welcome to the home of charting big: TradingView
Benefit from a ton of financial analysis features, instruments and data. Have a look around, and if you do choose to go with an upgraded plan, you'll get up to $30.
Discover it here - affiliate link -

Bitcoin Cash 💶 Analysis #12/50Hello TradingView Family / Fellow Traders. This is Richard, also known as theSignalyst.
BCH has been stuck inside a big range between the 100.0 support and 150.0 resistance.
Now BCH is approaching the lower bound / support zone so we will be looking for buy setups on lower timeframes
Moreover, the red trendline is acting as a non-horizontal support.
🏹 So the highlighted blue arrow is a strong area to look for buy setups as it is the intersection of the blue 100 support and red trendline.
As per my trading style:
As BCH approaches the lower blue arrow, I will be looking for bullish reversal setups (like a double bottom pattern, trendline break , and so on...)
📚 Always follow your trading plan regarding entry, risk management, and trade management.
Good luck!
All Strategies Are Good; If Managed Properly!
~Rich

BCH/USDT Possible Breakdown Level? Hey, guys ✌️
BCH coin seems pushing towards that neckline zone on daily chart. If the price will continue to suppress that level there is a good chance of breaking it. Waiting here for a breakdown on bigger scale so let's see.
If you like ideas provided by our team you can show us your support by liking and commenting.
Yours Sincerely,
Swallow Team 🔱
Disclamer:
We are not financial advisors. The content that we share on this website are for educational purposes and are our own personal opinions.

BCHUSDT SHOT SIGNALS!!!Hi, nice to meet you.
I think BCH will go down further.
I always support your friends' good sales. Fighting!

Bitcoin Cash BCH Price Targets after the FSB meeting The Finance Stability Board said today that many stablecoins won`t meet the requirements stipulated in its recommendations for cryptocurrency asset regulation.
This could have have ripple effects in the entire crypto industry!
My price targets for Bitcoin Cash BCH are:
BCH/USDT short
Entry Range: $147 - 153
Price Target 1: $138
Price Target 2: $119
Price Target 3: $110
Stop Loss: $171

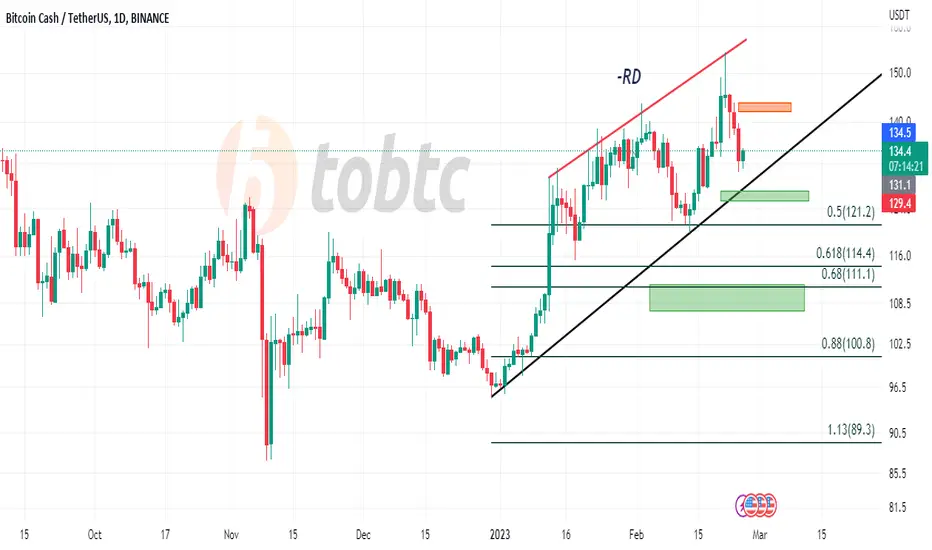
BCHUSDT lost the Weekly support!BCHUSDT lost the weekly support level around the 130$ area after a clear bearish impulse.
Furthermore, the price has also lost the dynamic daily support level, indicating that there is significant selling pressure in the market. According to Plancton's Rules, a retracement to the 0.618 Fibonacci level could present an opportunity for a new bearish impulse. The 0.618 Fibonacci level is a common level of retracement in technical analysis and is calculated by dividing the difference between the high and low prices by the Fibonacci sequence number 0.618.
If the price of BCHUSDT retraces to the 0.618 Fibonacci level, it could be an indication of a potential bearish trend continuation, meaning that traders could sell BCH with the expectation that the price will continue to fall.
–––––
Follow the Shrimp 🦐
Keep in mind.
🟣 Purple structure -> Monthly structure.
🔴 Red structure -> Weekly structure.
🔵 Blue structure -> Daily structure.
🟡 Yellow structure -> 4h structure.
⚫️ Black structure -> <= 1h structure.
Follow the Shrimp 🦐

BCH trend analysis (30m timeframe)As it is shown, the price touched a bearish trendline several times and it is more possible to break the trendline upward this time. But let the price passes the trendline or support line then enter to a position.

BCHHello dear traders and my subscribers 👥, please if you like ideas do not forget to support it with your boost 🚀
Everything is explained in the street. If you have a question, leave it to me in the comments ✌️

BCHUSD ❕ above the strong supportTD Sequential has formed a reversal signal upwards (1H TF)
The RSI chart is near neutral values (1H and 30m TFs)
I expect a reversal of the price movement.

#BCHUSDT #LQRUSDT #TOBTC #LaqiraProtocol Uptrend line support and static level support in the price range of $127
If the uptrend line is broken, the next supports are $114 and $110
resistance $142

BCHUSD ❕ lower boundary of the channelTrading volumes declined on the correction.
TD Sequential formed a reversal signal up (4H and 30m TFs)
I expect the asset to start rising if the price stays in the channel.

Bargaining at this price is attractiveI see a reaction in that I can set 100% of my loss on the price of the first commission

BCHUSDTHello Dear friends
Currently, the positive divergence of the RSI combined with the downtrend line on the daily time frame has strengthened the possibility of completing a bearish wedge pattern.
To form an upward trend similar to the drawn scenario, we have two conditions: the complete consumption of the $108.9 range and the maintenance of the $87 range.
If the previous price floor ($87) is consumed, the possibility of completing the descending corner pattern is weakened.
We would be happy to hear your comments

Bitcoin Cash USD - BCHUSDT IdeaBCHUSDT Idea | BCHUSD| Bitcoin Cash vs US Dollar | Bitcoin Cash vs USDT
✅ ✅ Risk warning, disclaimer: the above is a personal market judgment and analysis based on published information and historical chart data on The trading view,
And only some of these analyzes are my actual real trades.
I hope Traders consider I am Not responsible for your trades and investment decision.

BCH: BREAKOUT POSSIBLITYIn recent times, it appears that the trends in China have generated an increased interest in BCH. We will continue to monitor the future trends of BCH to determine if it has the potential to break out.
Depending on the perspective of the analysis, there is a possibility that BCH may experience a breakout in the coming time.
NEO and BCH are of the trend coins in china since the last HK trends.

✅TS ❕ BCHUSD: under the resistance✅✅ BCH is trading under the resistance level.
Volatility has increased.
I expect that the asset will start a reversal. ✅
🚀 SELL scenario: short to 134.5. 🚀
----------------------------------------------------------------------------
Remember, there is no place for luck in trading - only strategy!
Thanks for the likes and comments.

✴️ Bitcoin Cash Update | Bullish Or Bearish?What one does, the rest follows!
The Altcoins, they all move together and most of them, about 90%, have the same chart.
Within the 90% with the same chart the only difference is their timing. Some move first, others follow but end up drawing the same patterns.
Bitcoin Cash continues with its bullish consolidation, which is normal and at the same time great.
The longer the consolidation takes, the stronger the jump when the consolidation box breaks.
BCHUSDT is consolidating above MA200 while ETCUSDT is trading below, this makes no difference, they are both going to break up.
The one above MA200 will face less resistance though.
It will be exciting because the next up is the biggest one.
If you want to see additional information, the targets, support levels and so on, visit the 'Related Ideas' below... For all the "updates", I will list a few of the old ones.
Namaste.

BCHUSD ❕ broke up the downward channelBCH has successfully broken through the upward descending channel.
The RSI chart continues to hold near the neutral zone (4H, 1H and 30m TFs)
I expect the continuation of the growth of the asset price after fixing above the resistance level.

BCHUSDT Alert! - Looking bullish i am expection small bullish move in bch from my buy zone.
i analyse bch chart from htf to ltf and find a small good risk to reward ration trade
harmonic
support/resistance
trendline
fib-retracement
divergence
volume analysis
