we can buy and hold from nowI not sure we are in top.
But I sure we can buy and dca from current price.
Hold 1 or 2 year or 3 year
Hold will be rich
BCHUSDT trade ideas

BCHUSDT LongBCHUSDT Long
Bitcoin Cash Long-term
Bun now or Buy on downtrend breakout
SL close below 450.0
TP1: 1007.0
TP2: 1354.0
TP3: 1821.0
TP4: 2778.0
Researcher Strategy v2
@IR_Researcher

A nice diagonal/wedge patternWatch for the price action. Price is approaching the lower border of the wedge, and, hopefully, many traders see it)
Upside? What are your thoughts?


BCH - Earned on fall, time to earn on rise💵Following my previous successful short on bch, here is how we will use the same level to long.
⭐️ BTC bullish
⭐️ Mirror level is visible on daily timeframe
⭐️ Volume is at bottom
⭐️ Lots of touches
⭐️ Level is 46 days old
⭐️ 33 ATR
⭐️ Over VWAP
Will enter when price squeezes to the level on lower timeframes, the base will form and the strip will get faster.
Fix profit by parts:
1% - 1/3
2% - 1/3, stoploss to breakeven
What's left, hold to the maximum
What do you think of this idea? What is your opinion? Share it in the comments📄🖌
If you like the idea, please give it a like. This is the best "Thank you!" for the author 😊
P.S. Always do your own analysis before a trade. Put a stop loss. Fix profit in parts. Withdraw profits in fiat and reward yourself and your loved ones

BCH - Looks tired📉- BTC is bearish
- Trend is bearish
- Level is clearly visible
- 4th touch
- Level is 40 days old and historical
- The coin is in the end of formation
- Will enter when price squeezes to the level on lower timeframes, the base will form and the strip will get faster.
What do you think of this idea? What is your opinion? Share it in the comments📄🖌
If you like the idea, please give it a like. This is the best "Thank you!" for the author 😊
P.S. Always do your own analysis before a trade. Put a stop loss. Fix profit in parts. Withdraw profits in fiat and reward yourself and your loved ones

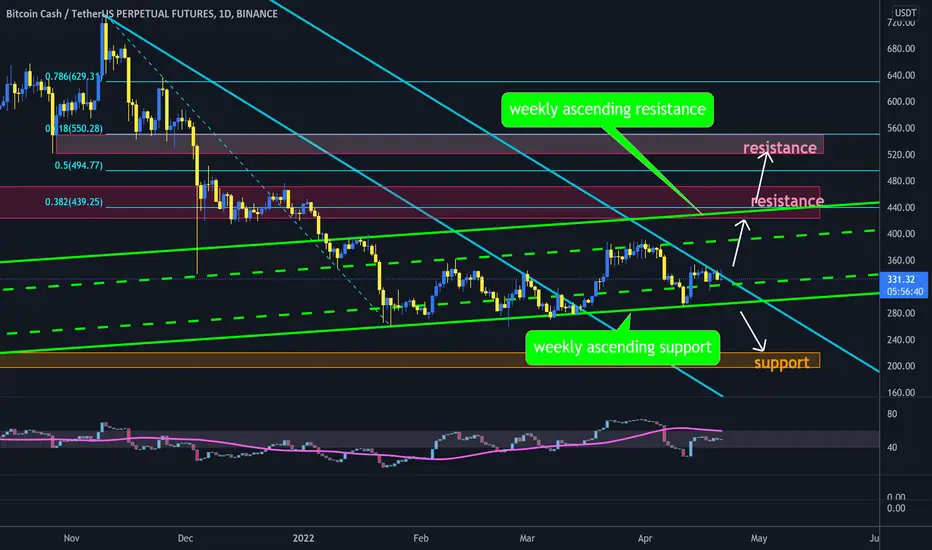
BCH trend lines#BCH/USDT
$BCH is trading between weekly ascending trend lines, also parallel descending trend line from all time high make resistance for price.
🐮 break out from descending resistance will increase price to ascending resistance that is the same with resistance zone around 0.382 fib level, and break out this zone will head up price to resistance zone between 0.5 and 0.618 fib levels.
🐻 rejection from descending resistance will drop price to ascending support that is so week because of so many touches and will drop more to long term support around $200.
DAY TRADING SHORTING BCH hello traders, i decided to day trade BCH , follow the chart and also expecting sort term brearishness. we have to be ahead of the games guys, enjoy.
tradehubng

BCH SHORT or LONGHi Guys
I think we should SHORT position, but because there is nothing predictable, therefore, we will wait for failure of up or down
For certain positions we can : At the top of resistance, make LONG position and Under support, make SHORT position

BCH retested the broken trendlineBCH broke down the trendline and retested it. This is a signal of the continuation of the downtrend

Important resistance in bitcoin cashBitcoin Cash has a strong resistance at $ 380, which I think will react.
If the number of followers reaches 100 this week, I will put pure analysis every day.
Follow fractal_analysis98

BCH - Bitcoin cash - A possible resistance breakoutLike and follow us for more frequent Crypto technical analysis.
A picture is worth a thousand words
Cheers
GreenCrypto Team

rr:1.64 sell ideabearish harmonic pattern
rsi divergence
engolfin
never risk more than 2% of capital per trade

Bitcoin Cash Bullish Breakout vs Tether...The altcoins do move together...
Here we have the same chart as the COMPUSDT pair we looked at recently.
We have higher low after late February and today a strong breakout support by volume.
There can be additional growth.
Namaste.


Long setup BCHUSDT back to 322?Often the market tests the blue box marked structure candle. We just need to wait until all our checkboxes are checked before taking a long entry to 322.


BCH 1WAn uptrend line is a straight line drawn upward to the right that connects 2 or more low points. The second low must be higher than the first for the line to have an upward incline. Uptrend lines act as support and indicate that there is more demand than supply, even as the price rises.
entry after retest uptrend line.
A retest refers to prices reversing direction after a break and returning to the breakout level to see if it will hold.

BCHUSDT 1D: Possible LONGBCHUSDT 1D: Possible LONG
We can see a rebound from the price level - of 340 on the 1D chart. In the long term, this signal indicates that the price may increase to 420.

Bitcoin Cash can reach 400-420$BCH has started a Bullish Trend & we can See an Ascending Channel On The Chart. The Price is gonna Need to Decrease a little more For it would Become Ready to Ascend Further. a Support Stands at 300$ .This Should be a Good Point for Price to React to & Continue The Bullish Movement From There.There is also a Hidden Bullish Divergence (+HD) on MACD which Means There is a High Bullish Chance For BitcoinCash! The Price can Increase up to 400-420$ for now.
_ _ _ _ _ _ _ _ _ _ _ _ _ _ _ _ _ _ _ _ _ _ _ _ _ _ _ _ _ _ _ _ _
Thank you for seeing idea .
Have a nice day and Good luck

BCH USDT LONG SWING| BCHUSDT | LONG @ 300 - 304 | TP @ 306, 308, 310, 312, 314 | SL @ 275 | PATTERN = BULLISH TRIANGLE BREAKOUT | BINANCE |
Swing trade idea. Kindly follow targets and stop loss. Will update with new targets once all 5 are achieved.

#BCHIf we will fix in the channel - we can take a long. Now you can also take a long, but only with a small stop under the bottom line of the zone.

BCH analysisSo an uptrend triangle in an uptrend? From what I can see is we are expecting a breakthrough soon. The support zone is 338~353 which is unlikely to be broken down. If the price went below this ascending triangle, this zone would work.
