BCH/USDT Butterfly Bullish patternharmonic Butterfly pattern is obvious in Daily time frame hope we feel the fly ;)
BCHUSDT trade ideas

BCH Sensitive Levelsat first we have to know what news can pump this for next levels but we dont have any fundamental for chart

BCH analysis1 day chart shows really negative scenario which is the downtrend triangle is about to break to downside. And that means another round of plummet. MACD still below the 0 and there's no sign of cross above it. Currently waiting for the decision of the market towards this downtrend triangle. If it didn't broke, then probably it will continue to oscillate in the channel for a while before breaking out.

One day analysis of BCHUSDTIt's unlikely to break the current support to me, current price is a great entry from 15 mins chart. but if it did the price would probably goes below 260. Yesterday's tumble stem from the charity sells, so far a lot of charity organizations received Crypto so short-term it will need cash out. In the long run the market is still positive.

One day analysis of BCHUSDTthe price is testing the support area now, ideally we'd look for a long position and from 4 hours chart it already shows a long lower wick with the buying power. To be more confirmed we can wait and see some candle patterns to give us a good entry point like double bottom. So basically what we are waiting for is the price to go down and approach the black box, the body of the candle can go inside but cannot drop over the box. Also if the candle's wick out of the bottom of the box, that also fine. Make sure the close price is in the box and then the next candle shows us the buy power. Otherwise we consider a different direction.

One day analysis of BCHUSDTWe are still on an uptrend and looking for a long position now. The current price could be an entry point with aggressive trading while more conservative would be a pullback to 303~313. Since we've seen that area has acted as resistance many times before and when we are looking for a long trade on an uptrend, it should be taken as a reference. Another thing that deserves to be noted is the U.S just had its state of union Address and war is still unclear for how much impact it would have on the Crypto market. In long term, it still has a more positive effect on Crypto development.

BCHUSD : There is a potential double bottom in day chart!On the left side is the 4h timeframe
The price hit the TP1 : 342.4 and the next TP as below
TP2 : 349.6
TP3 : 364.9
On the right side is the day chart
If the price hit the TP3: 364.9 and stand firm ,that will make the potential double bottom confirm!
And the TP as below
For day chart
TP1 :390.7
TP2 :402.1
TP3 :426.4
TP4 :455.8
If you like this analysis, give it a like or share your thought or let me know what crypto TA you want to know.

BCHUSDT Market Analysis With yesterday's rally up, (Mainly because of the sanctions that the west put on Russia, RUB/BTC trading volume surged).
Influenced by this move, BCH also successfully stood above resistance, and now our next target would be 390. It is worth noting that the U.S. Department of the Treasury has issued new rules prohibiting Americans from providing any support to Russian oligarchs and entities, including through transactions using digital currencies or crypto assets, this rule will come into effect on March 1.
So if this round of rallies is mainly because Russia is using crypto as a safe haven asset, then it's unlikely to cool down in the next few days until crypto exchanges implement more sanctions rule on Russia.


One day analysis of BCHUSDTThe next support zone is 290-295 with a lot of frequency. The market has used this zone as support and resistance multiple times in the past. This area is extremely likely to move the market. In this case, I would consider this level as a potential entry point in a lower timeframe. If the market didn't head down, instead, it reassembles the buying power, therefore, the target again is to stand above the resistance zone, I would like to see another rally up to 323.

$BCH Bullish ButterflyNice double bottom here with bullish divergence. Larger Bullish Butterfly with a type 2 return at a historical inflection zone. I'm a big fan of POW coins, and i think privacy coins will do as well considering the current climate and events around the world.


One day analysis of BCHUSDTPerfectly rebounded from the support zone again and the price started to cross above MA lines. From 1 day chart, there's a big green candle with a high lower wick which shows there's still a lot of people who are buying at the moment and shows some confidence towards the market. The best situation is price keep heading up to the previous high (around 352).

One day analysis of BCHUSDTStill holding on to our support zone now, but the situation is getting harder, the global market keeps falling still caused by political tensions and any movement could lead the price to eventually break to the downside. Since the situation is highly unclear now, this could be a chance for cryptos. To some extent, Russia's organizations could use crypto to avoid the western economic transactions which would boost stable coins' trading volume

BCHUSDT Market AnalysisAn expected rebound with an expected resistance above the head. so there could be two situations: the price will form a lower high just in the current candle then head down to break the support (260~270). or we will find a midpoint between the support and resistance which form a narrowed waving range 288~305 with low volume which I think would be more likely to happen, then try to conquer the resistance (305~315)

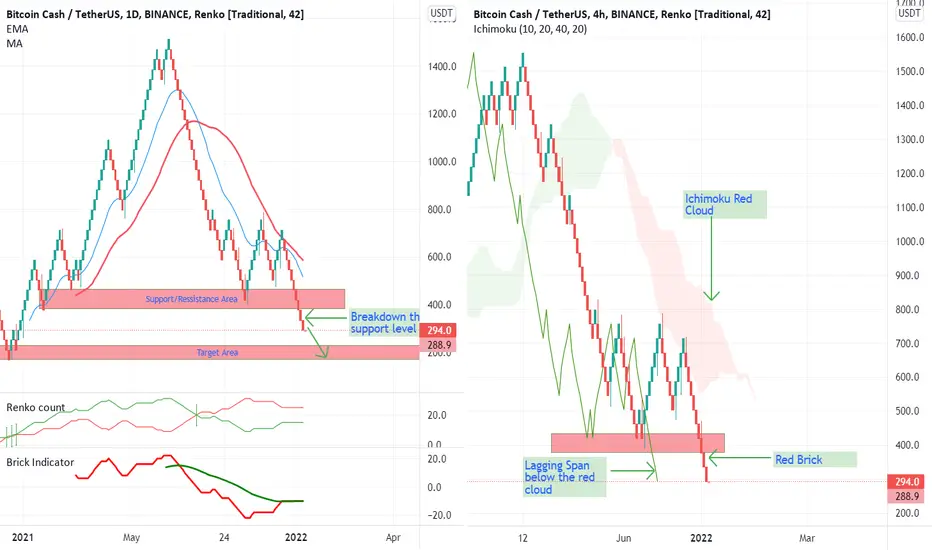
BCH broke down the support levelBCH broke down 400$ support level. Ichimoku analysis confirms the downtrend.(See chart on the left.) The target is around $ 190 COINBASE:BCHUSD BINANCE:BCHUSDT BITTREX:BCHUSDT
Analysis of BCHUSDTSeems like It's inevitable to test 260 again now. As we can see in the chart, the market keeps heading down and we barely see buying power. A big reason for the market fall should be the recent tension between Russia& Ukraine. Global stock indexes and U.S. futures fell. Futures on the Nasdaq-100 index stood 2.1% lower, while those for the S&P 500 dropped 1.4%, therefore cryptocurrencies come under pressure too. Yesterday was Presidents Day and this sell-up happened in the morning. In the near future, cryptos price would also be highly related to the political situation while the situation remains still unclear, the market is unlikely to have a positive turn.

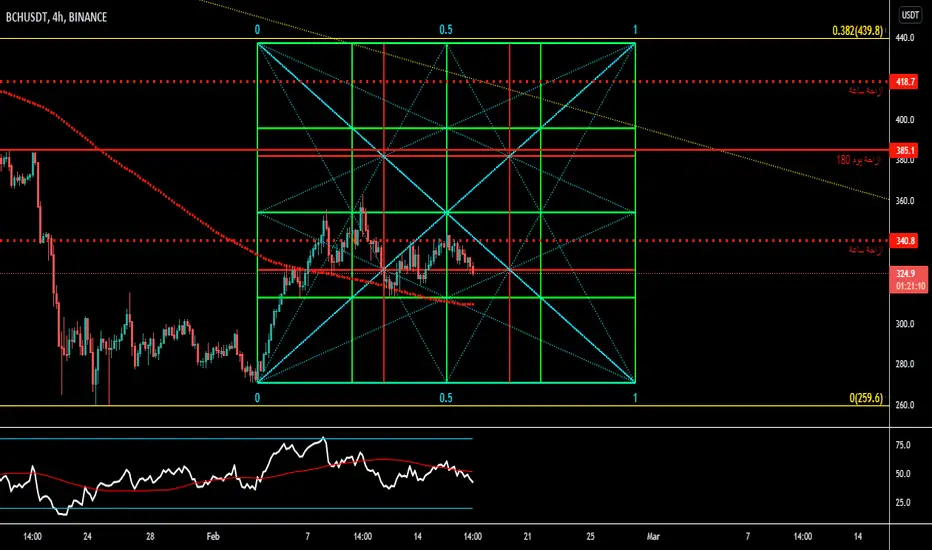
Bitcoin Cash how to earn guaranteed x3On the chart, I put the line at number one, this is the line that would allow past investors to earn money guaranteed by waiting for the price equilibrium. The current equilibrium is on the line designated under number 2, buying now and waiting for the price to go to that point, we are guaranteed to make a profit. In this case, only delisting of the coin and nothing more can interfere

One day analysis of BCHUSDTThe chart doesn’t look good. But if we analyze the volume carefully, we will find out that the buying power actually didn’t fade too much, which means there’s a slowly continuously buy activity. Plus with this rebound, the price do stand above to MA50 which is another good signal.

Bitcoin cash seems to complete ABC correction.Ready for 3rd waveBitcoin cash has completed ABC zigzag correction.Wave A was very deep whereas the wave C was shallow and ended as an endng diagonal which also signifies end of downtrend.Price below 254 will invalidate the wave count.Seems like we will soon see big impulse wave 3 breaking all time high....

One day analysis of BCHUSDT312 proved itself as support again along with the buying power are not willing to let bears conquer this position at least for now. As long as the price stay above it. I'll be seeking for the long trade.