BCH: Current SituationYou asked, and we delivered.
Bitcoin Cash (BCH) is trading at $331, a pivotal level that’s acting as a battleground between buyers and sellers. This price sits near a critical support zone, and recent price action shows BCH struggling to push higher amid broader crypto market weakness. The total crypto market cap has dropped by 4.4% in the last 24 hours, putting pressure on altcoins like BCH and fostering a cautious sentiment. Social media buzz, especially on platforms like X, has flagged $330 as a make-or-break level, holding here could spark optimism, while a breakdown might fuel bearish momentum. That said, take these posts with a grain of salt; they’re often speculative and lack the full technical or fundamental picture.
Technical Breakdown: What the Charts Are Saying
Short-Term (1-Hour and Daily Charts)
Support Levels:
Immediate: $330 – A close below this could signal trouble.
Next: $315.58 – A deeper drop might test this level if selling picks up.
Resistance Levels:
Immediate: $339 – A hurdle to watch for any upside push.
Next: $350 – A tougher ceiling that’s rejected recent rallies.
Indicators:
MACD: Bearish crossover, suggesting short-term weakness.
RSI: At 46.40, it’s neutral but leaning bearish, room to fall or bounce.
Moving Averages: Price is below the 20-period MA on the 1-hour chart, a sign of near-term softness.
Pattern: A falling wedge is forming, a setup that could hint at a bullish reversal if BCH breaks above the upper trendline with solid volume.
Long-Term (Weekly and Monthly Charts)
Support Levels:
Key: $300 – A major floor to hold for bulls.
Next: $263 – A deeper correction could target this if $300 fails.
Resistance Levels:
Key: $536 – A 50% Fibonacci retracement level and a big hurdle.
Next: $800 – A long-term target if momentum flips bullish.
Indicators:
200-Day MA: Trending down, reflecting prolonged bearish pressure.
RSI/MACD: Neutral on weekly, with no extreme signals yet.
Pattern: A double-bottom around $300 is worth watching, confirmation could spark a reversal, while a drop below $263 would sour the outlook.
Potential Scenarios: What Could Happen Next?
Short-Term Scenarios
Bullish Case:
If BCH holds $330 and punches through $339 with strong volume, it could climb to $350. A break above $350 might target $380, especially if MACD flips bullish. Look for a volume surge to confirm this move.
Bearish Case:
A close below $330 could trigger a slide to $315.58, or even $300 if selling accelerates. High volume on the drop would lock in bearish control, watch this closely.
Long-Term Scenarios
Bullish Case:
Holding $300 and breaking $536 could kick off a new uptrend, with $800 or higher in sight by 2026. This depends on a crypto market rebound and growing BCH adoption for payments.
Bearish Case:
A sustained fall below $300 might drag BCH to $263 or lower, especially if altcoins stay weak. This would kill the double-bottom setup and point to a longer downtrend.
Broader Context: What’s Driving BCH?
Market Sentiment: BCH’s identity as a scalable, low-fee payment option (thanks to bigger block sizes) keeps it in the game, but it faces stiff competition from other coins and regulatory uncertainty. Adoption is key, more real-world use could lift its value.
Tech Developments: Network upgrades enhancing scalability could boost BCH’s appeal. Watch for news on this front.
External Factors: Crypto prices often dance to macro tunes, think regulatory shifts, US economic data (like inflation), or Bitcoin’s moves. These could sway BCH in either direction.
Practical Tips for Traders and Investors
Risk Management: Crypto’s wild, set tight stop-losses and don’t over-leverage. A stop below $330 for shorts or $315 for longs could save your bacon.
Volume is King: Breakouts or breakdowns without volume are suspect. Wait for confirmation.
Stay Flexible: Markets shift fast, keep an eye on news and adjust your plan as needed.
BCHUSDT trade ideas

Let's trade on Bitcoin CashI’m, like, seeing a long position here! But, be careful this is MY vibin’ idea

bch buylimit midterm"🌟 Welcome to Golden Candle! 🌟
We're a team of 📈 passionate traders 📉 who love sharing our 🔍 technical analysis insights 🔎 with the TradingView community. 🌎
Our goal is to provide 💡 valuable perspectives 💡 on market trends and patterns, but 🚫 please note that our analyses are not intended as buy or sell recommendations. 🚫
Instead, they reflect our own 💭 personal attitudes and thoughts. 💭
Follow along and 📚 learn 📚 from our analyses! 📊💡"

BCH is ranging the coin is in range bound like an abcde correction and we are observing inverse cup and handle pattern following downward fall indicating potential bearish toward specified fibo level .if the coin recovers itself from the fibo level we will see a short rally
let's what the market will play out

In-depth critical analysis of Bitcoin Cash$BINANCE: BCHUSDT
### Technical Analysis of Bitcoin Cash (BCH)
**Date: March 1, 2023**
**Current Price Action**:
Bitcoin Cash (BCH) has demonstrated a strong bullish response, bouncing off projected support levels. The significant bounce indicates renewed bullish sentiment among traders, suggesting that the bulls are back in the game after consolidation.
**Price Patterns**:
The breakout from the falling wedge pattern is a notable bullish signal. Falling wedges typically signify a potential trend reversal, and the break above the upper trend line means that momentum may be shifting towards the upside.
**Targets**:
Given the bullish breakout, the following price targets are established:
1. **First Target**: $425
2. **Second Target**: $450
3. **Third Target**: $475
4. **Fourth Target**: $550
These targets are based on previous resistance levels and Fibonacci retracement levels, which suggest potential price points where momentum could meet resistance.
**Support Levels**:
1. **Strong Support**: $290 - $270
This range has been tested previously and shown resilience, indicating a significant level for bulls to defend.
2. **Invalidation Level**: $240
A one-day candle close below this level would invalidate the bullish outlook and signal a potential shift to bearish market conditions.
**Market Sentiment**:
Overall, the market sentiment appears bullish, with increased buying pressure indicated by the bounce from support and the breakout from the falling wedge. If momentum indicators were bullish, this outlook would be further supported.
**Conclusion**:
The technical setup for Bitcoin Cash is positive, with key price targets set for the upside. However, traders should closely monitor potential pullbacks and the $240 invalidation level to reassess market conditions. Monitoring volume during any price movements is advisable to confirm the trend's strength and validate entry or exit strategies.
**Disclaimer**:
This analysis is for informational purposes only and should not be considered financial advice. Always conduct your research and assess the risks involved in trading cryptocurrencies.

BCH Daily TIMEFRAME UPDATE (ON DEMAND)❤️ THIS POST AND I WILL SHARE NEXT pair
Bitcoin Cash was created as an alternative to the first and most valuable cryptocurrency — Bitcoin (BTC). In 2017, BCH developers modified the BTC code, releasing their software version and a full-fledged competitive product, which split Bitcoin into two blockchains: Bitcoin and Bitcoin Cash
ANY THOUGHTS ON SET:BCH ?

BCH Long Sl -12%BCH/USDT Long Setup
Reason:
Successfully Breakout of trend.
Break of Internal Structure.
Strong Bullish Momentum
All technical indicators suggesting Strong bullish Wave
Best Regards,
The Panda
💲 Pair: BCHUSDT.P
📊 Type: LONG
💰 Suggested Leverage: 8x
🏆 Winrate of Strategy: 88%
🔰 Entry: 326.525
Take Profits:
🎯 Tp1: 345.07 (5.679%)
🎯 Tp2: 377.54 (15.623%)
🎯 Tp3: 435.27 (33.303%)
🎯 Tp4: 489.39 (49.878%)
❌ Stoploss: 284.45 (12.886%)
🛡 Breakeven Target: Tp2
Best Regards,
The Panda⚔️

Bitcoin Cash ($BCH) Surged 35% Today Gearing Up for 70% SpikeThe peer-to-peer electronic cash system that aims to become sound global money with fast payments, micro fees, privacy and larger block size Surged 35% Today amidst crypto market volatility potentially gearing up for a 70% spike to the $500 resistance.
Bitcoin cash ( SET:BCH ) was created as an alternative to the first and most valuable cryptocurrency — Bitcoin (BTC) in 2017. Bitcoin cash ( SET:BCH ) chart pattern exhibited series of consolidation pattern that connotes to an upcoming surge and the 35% surge is a prelude to what's coming.
With the Relative Strength Index (RSI) at 65, SET:BCH is more than ready to capitalize on the current bullish engulfing pattern exhibited on the chart.
As of the time of writing, SET:BCH is up 21.78% with data from DefiLlama showing about $7.28M locked in Bitcoin cash network With about $1.92 Billion in volume for the past 5 days.
Bitcoin Cash Price Live Data
The live Bitcoin Cash price today is $388.10 USD with a 24-hour trading volume of $1,009,964,576 USD. We update our BCH to USD price in real-time. Bitcoin Cash is up 25.15% in the last 24 hours. The current CoinMarketCap ranking is #20, with a live market cap of $7,699,166,324 USD. It has a circulating supply of 19,838,141 BCH coins and a max. supply of 21,000,000 BCH coins.

Super Bullish Bitcoin Cash: Double-Bottom Clear SignalHere is another chart that reveals the truth of the market. Bitcoin Cash (BCHUSDT).
Notice a very clear and strong double-bottom based on the new 2025 baseline level. So Bitcoin Cash is now confirmed bullish and trades at the best possible price ever before a massive bullish wave.
This type of signal and chart data confirms what I've been saying, that is, the bottom is in and we are very soon going up.
This soon doesn't mean months nor weeks away, no, we are going up within days. In fact, Bitcoin Cash is super bullish now and moving forward and this growth cannot be stopped. This is a big strong project, not a small project and yet, look at the chart.
The volume is very very low on the drop. The main low already happened on February the 3rd. Here we have a double-bottom while some other pairs produced a higher low. It doesn't make much difference truly. After this event that is happening now, we are going up. Very high up. New All-Time Highs all across.
In 2025 we will have a major bull-market. The bull-market is not over because it is yet to start.
The chart is clear and the signals are clear and we can all agree with what the market has to say. We have so much positive news and positive developments across the market, this will reflect in the price faster that you can expect.
Three days, four days, five days... It is normal to see some consolidation before a massive bullish wave.
Cryptocurrency is going up. Mark my words.
It is very easy right now to buy Altcoins cheap.
It is very easy to buy and hold.
Think long-term.
Namaste.

BCHUSDT.PBINANCE:BCHUSDT.P
buy limit area yellow and green lines, for that area the chart has a swing in the price range of 333.98 - 324.72.
for stop loss set 5% of the buy target hit area. while this position is still waiting for the white box breakout at 350

Bitcoin Cash BCH price analysisThis idea is probably more for ancient #BCH holders, because the coin is slow)
They have been accumulated for a year and does not allow it to fall much below $300.
🔝 If this trend continues, then sooner or later, but still #BitcoinCash at $1500 will be seen again)
P.S:
If you like this project, then just in case, put a “bucket” to buy OKX:BCHUSDT at $190-200 for the coming days)
_____________________
Did you like our analysis? Leave a comment, like, and follow to get more

BCH USDT#Bitcoin Cash ( SET:BCH ) – Cup and Handle
The BCH chart is forming a Cup and Handle pattern, a strong technical indicator signaling a potential bullish reversal. This pattern illustrates a period of accumulation followed by a pullback, forming a rounded bottom, and is now gearing up for a potential breakout to the upside.
T: $832.2 🔥

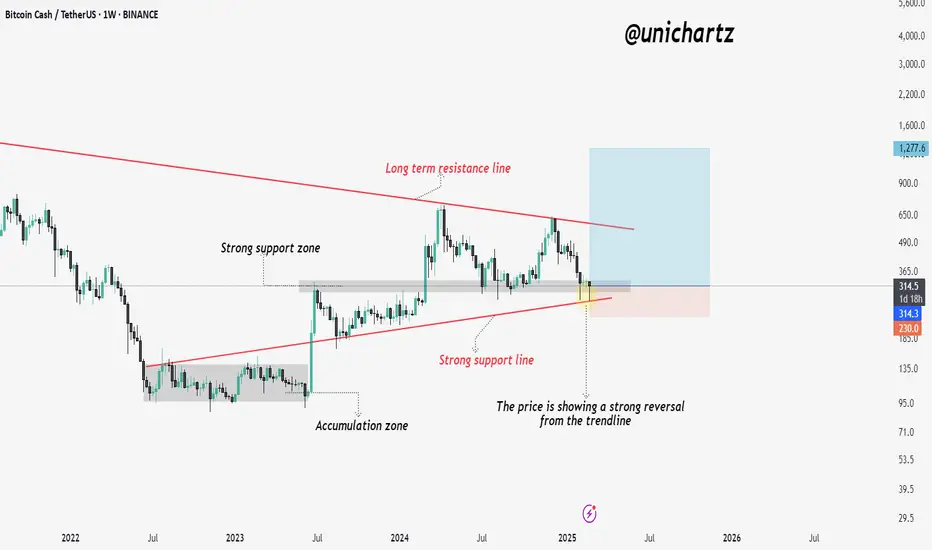
Bitcoin Cash at Critical Trendline – Next Big Move?Bitcoin Cash (BCH/USDT) is currently showing signs of a strong reversal after testing a key support zone and the ascending trendline. This level has acted as critical support in previous price cycles, making it an important area to watch.
The price has rebounded from the strong support line, which aligns with the accumulation zone from early 2023. Additionally, BCH remains within a long-term descending channel, with the upper resistance line acting as a ceiling for previous bullish moves.
bch midterm sell limit"🌟 Welcome to Golden Candle! 🌟
We're a team of 📈 passionate traders 📉 who love sharing our 🔍 technical analysis insights 🔎 with the TradingView community. 🌎
Our goal is to provide 💡 valuable perspectives 💡 on market trends and patterns, but 🚫 please note that our analyses are not intended as buy or sell recommendations. 🚫
Instead, they reflect our own 💭 personal attitudes and thoughts. 💭
Follow along and 📚 learn 📚 from our analyses! 📊💡"

Bitcoin Cash Quintuple Bottom & $2,595 2025 All-Time High TargetBitcoin Cash just tested our 2025 baseline for the fifth time this week. This action gives us a long-term quintuple bottom. A clear establishment of long-term support.
Good afternoon my fellow Cryptocurrency trader, I hope you are having a wonderful day.
This type of action is very good because it clearly reveals what comes next. Both the lows in August 2024 and earlier this month (3-Feb. 2025) ended up lower than the low hit this current week. This is a minor detail but can be really important as it tells of the fact that buyers where ready and waiting at support.
If the low was a lower low, prices moving below 3-February and below August 2024, this would mean that buyers were not present. Even if buyers later show up it is not the same as buyers being ready beforehand. Buyers being ready beforehand means that they know what is happening and know what is coming. This correction is no surprise move but instead well planned. By who? Nobody cares. The truth is that after prices move up they tend to move back down and, after moving down then we get another move up. This is what is important. We are now entering this move-up period/cycle/phase.
Now, this is nothing new. In late 2022 we had a long sideways pattern followed by a break-up (price jump). In 2023 the same dynamic is repeated; sideways prices and then another bullish jump. Finally, 2024 did the same but smaller for this pair. Since Bitcoin Cash moved strongly in 2023 it performed weakly in 2024. Those that performed weakly in 2023 performed strongly in 2024, examples exist such as Cardano.
2025 will be different. Here we have no sideways pattern but instead a long-term lower high. This can be a double-top or lower high, makes not much difference. What matters is the fact that our baseline, Bitcoin Cash's long-term support holds. This holding is the most relevant part because the new rise will start from a strong level, which means that prices will move even higher in the coming months.
2022, 2023, 2024... This is all down. Cryptocurrency moves in a 4 year cycle based on Bitcoin's halving. The year after the halving is the bull-market year. Bitcoin halved in 2020 and the bull-market happened in 2021. Bitcoin halved in 2024 and the bull-market happens now, 2025; Thanks a lot for your continued support.
We are ready for the next price jump, "break-up," as it happened before. But this one will be something especial. A bullish wave within a bullish cycle in a bull-market year ending in a bull-run. Did you notice something in this line? The bears are gone!
Prepare for massive growth.
You can profit massively if you approach the market in the right way.
You can profit with spot or lev. it is all the same.
It would be wise not to become greedy, accept what comes to you.
If you are going to run, say a marathon, you start by training, the training starts with slow walking. Then you start throttling and then finally you run. At first, you only run for a short period of time but you increase little by little, run more and more. Eventually, you can run for hours, but it all started with a slow walk.
It is the same with trading. You can start by earning and accepting the small and little trades. You can earn 10-20%, over and over, again and again. As you get used to the winning you will eventually start to win more. Then you can earn 50%, 100% and continue going higher until you become a winner at the traders marathon.
You cannot start by running 10 miles on the first day.
You cannot start by going all-in with 20-100X.
Let us start small.
If we can create a winning habit, we will be able to win more over the long-run.
Namaste.

BCHUSDT 1WBCH ~ 1W Analysis
#BCH If you still have a Conviction on this coin. Maybe this support block you can consider to start buying again from here.

bch looking bullish we are in a triangle with a triple bottom witch is a very bullish sign im calling 500 if we brake out of this wedge

I Turned Crazy Strategy Into a Python Program & It’s RunningAfter years of refining my AI Harmonic Fibonacci strategy, I’ve fully automated it into a Python-based trading system, and it’s now LIVE on Binance Copy Trading. The results? 773 trades in just 7 days with an insane 98% win rate!
📊 Why Is This Strategy So Powerful?
✅ AI-driven precision – No emotions, just math.
✅ High-frequency trading – More trades, more wins.
✅ Zero risk approach – Built-in smart risk management.
✅ Fully automated – Profits while you sleep.
🔥 And the best part? You can access it right now.
🔍 Search "아몰랑" on Binance Futures Copy and see it in action!
sorry I accidentally made with a Korean nickname,
#Binance #CopyTrading #PythonTrading #AITrading #TradingBot #CryptoTrading #HarmonicPatterns #HighWinRate
www.binance.com

Bitcoin Cash: Back To 2023 Baseline Levels & $4222 New 2025 ATH Good morning my fellow Cryptocurrency trader, let's start with the fun part. Bitcoin Cash's new 2025 All-Time High potential sits at $2,594 or $4,142.
Which one ends up being the final target will be decided by you as a market participant. It all depends on how strong buyers are, how much confidence participants hold for the market, for how long can they hold when the bull-run starts. Actually, it will be decided by the whales but the fifth wave of the bull-market tends to be the speculative wave, everything goes crazy at that time and the potential becomes unlimited for as long as the mania phase remains. Let's aim high because Bitcoin Cash always tends to surprise.
It is likely that some strong, positive news event will develop and this will in turn support Bitcoin Cash's price. Some major institution or organization buying BCH or deciding to accept as a payment method. There will be lots of this throughout 2025. Those buying now, accumulating now and holding long-term, will reap the rewards. You will be blessed with massive profits if you decide to join the fun.
Cryptocurrency is bullish. The Altcoins are about to blow up in a way you have not seen before. If you entered the market after 2021, you are about to have the biggest surprise of your life. A positive surprise.
If you are a Cryptocurrency holder since early 2021 or before, you already know the feeling and how Crypto produces exponential growth. Final results can end up being 10X, 20X, even 30X or more. Many of the smaller and newer projects will grow 50X and beyond. 100X is also possible but we are happy with buying low.
Greed can be detrimental to your health and success. So we focus on the win, the great entry price and entry timing. We let the market take care of the rest.
We focus on a plan; develop a plan and just do our thing. Step by step, focused. If we approach the market with the right mindset now, we will do good once bullish momentum grows. You reap what you sow. If you plant profits filled, patience, abundance and healthy seeds, you will get fruits in the form of happiness, success, big money and personal growth.
We are ready to win.
Thanks a lot for your continued support.
Bitcoin Cash activated its 2023 baseline level. This is a price range where BCHUSDT produced a consolidation phase before a strong bullish advance. This level has been activated again as a higher low. Both signals are bullish. The re-activation indicates a new accumulation period and the higher low indicates long-term strength.
We are going high. Very high.
I am not staying out nor staying behind.
All my money is Crypto, what about you? What about yours?
All my money is in —All-in.
2025 is the year of Cryptocurrency.
Soon, we will know about this decision based on the results.
No leverage —or low leverage— results in very low risk. Basically no risk as you hold the actual coins. Holding the coins preceding a bull-market, can be smatter than using margin.
If you have experience, by all means, go ahead.
Regardless if you are a beginner or advance, you need a growing spot portfolio. This portfolio is like a savings account, it needs to receive money all of the time from your weekly and monthly pay.
You feed your portfolio now, in the short-term, and the market will pay you forever.
Thank you for reading.
Cryptocurrency is here to stay and is here for the long-term.
Cryptocurrency is the evolution of money.
Communication evolved.
Food evolved.
Travel evolved.
Housing evolved.
All areas of our lives are evolving and continue to evolve.
It is only logical and natural to see Bitcoin as the default currency of a digital world.
Everything is done on a device now, we are used and enjoy our smart phones.
Crypto is a technology based money and is here to change the world. For the better.
Namaste.


bch buy midterm"🌟 Welcome to Golden Candle! 🌟
We're a team of 📈 passionate traders 📉 who love sharing our 🔍 technical analysis insights 🔎 with the TradingView community. 🌎
Our goal is to provide 💡 valuable perspectives 💡 on market trends and patterns, but 🚫 please note that our analyses are not intended as buy or sell recommendations. 🚫
Instead, they reflect our own 💭 personal attitudes and thoughts. 💭
Follow along and 📚 learn 📚 from our analyses! 📊💡"

bch range"🌟 Welcome to Golden Candle! 🌟
We're a team of 📈 passionate traders 📉 who love sharing our 🔍 technical analysis insights 🔎 with the TradingView community. 🌎
Our goal is to provide 💡 valuable perspectives 💡 on market trends and patterns, but 🚫 please note that our analyses are not intended as buy or sell recommendations. 🚫
Instead, they reflect our own 💭 personal attitudes and thoughts. 💭
Follow along and 📚 learn 📚 from our analyses! 📊💡"

TradeCityPro | BCH: Breakout or Deeper Correction?👋 Welcome to TradeCity Pro!
In this analysis, I’ll be reviewing BCH. This coin is one of the older assets in the market, with chart data available since 2018. However, the chart I’m analyzing today is from Binance, which provides data from 2020 onward.
📅 Weekly Timeframe
In the weekly timeframe, we observe an uptrend that began at a low of 97.7. The first bullish leg pushed the price to 293.9, followed by a correction down to 189.6, and then another leg up to 693.
🔍 Currently, the price has tested the 693 resistance twice. At the same time, we have an ascending trendline, which was broken in the last weekly candle. The price has also formed a shadow towards the 293.9 support level.
🔽 If the price continues to decline and stabilizes below 293.9, we can confirm a double-top pattern. If this support breaks, the price could move down to 189.6. If the downward momentum continues, we could even see a decline to 97.7.
✨ For a short position, you can enter if 293.9 breaks, accompanied by increasing sell volume. The target for this short position would be 189.6. However, since the overall trend remains bullish, it’s important to manage risk carefully to avoid excessive losses. A break of the 41.72 RSI support could confirm bearish momentum.
📈 On the other hand, if the price stabilizes above 693, it has the potential to move up to 1414.7, which is the highest resistance in this chart and a key level. While BCH’s actual ATH occurred in 2019 and is not visible on this chart, this resistance remains crucial, and the price may react to it.
📅 Daily Timeframe
In the daily timeframe, we see a ranging box between 293.9 and 488.8, with the price now reaching the lower boundary.
⚡️ Following the breakdown of the 407.2 support, the price printed a large red candle, dropping straight to the bottom of the range. A significant support zone exists between 293.9 and 314.6.
💥 The RSI oscillator is currently in the oversold zone, meaning we should wait for a structure to form before taking a position. If the price breaks below 314.6 and 293.9, it could provide a short entry opportunity.
💫 For a long position, patience is required until the price establishes a new structure. If that happens, entering a long position upon a breakout of the structure’s high would be a valid strategy. The next resistance levels at 407.2 and 488.8 can serve both as targets for lower triggers and as new long-entry points.
🔼 The key supply zone is between 618.8 and 700.9—an extremely strong resistance area. If the price manages to break above this zone and hold, it could initiate the next bullish leg, with targets already identified in the weekly timeframe.
⭐️ A break above 56.81 on the RSI would serve as strong confirmation for a long position. Overall market volume is currently declining, so any volume surge accompanying a breakout would help validate the position.
📝 Final Thoughts
This analysis reflects our opinions and is not financial advice.
Share your thoughts in the comments, and don’t forget to share this analysis with your friends! ❤️
