UKOILSPOT "Brent Crude Oil" Energies Market Bullish Heist Plan🌟Hi! Hola! Ola! Bonjour! Hallo!🌟
Dear Money Makers & Robbers, 🤑 💰
Based on 🔥Thief Trading style technical analysis🔥, here is our master plan to heist the UKOILSPOT "Brent Crude Oil" Energies market. Please adhere to the strategy I've outlined in the chart, which emphasizes long entry. Our aim is the high-risk Red Zone. Risky level, overbought market, consolidation, trend reversal, trap at the level where traders and bearish robbers are stronger. 👀 So Be Careful, wealthy and safe trade.💪🏆🎉
Entry 📈 : You can enter a bull trade at Pullback,
however I advise placing Multiple Buy limit orders within a 15 or 30 minute timeframe. Entry from the most recent or closest low & high level should be in retest.
Stop Loss 🛑: Using the 4H period, the recent / nearest low level.
Goal 🎯: 78.437
80.000
Scalpers, take note : only scalp on the Long side. If you have a lot of money, you can go straight away; if not, you can join swing traders and carry out the robbery plan. Use trailing SL to safeguard your money 💰.
Warning⚠️ : Our heist strategy is incompatible with Fundamental Analysis news 📰 🗞️. We'll wreck our plan by smashing the Stop Loss 🚫🚏. Avoid entering the market right after the news release.
Take advantage of the target and get away 🎯 Swing Traders Please reserve the half amount of money and watch for the next dynamic level or order block breakout. Once it is resolved, we can go on to the next new target in our heist plan.
💖Supporting our robbery plan will enable us to effortlessly make and steal money 💰💵 Tell your friends, Colleagues and family to follow, like, and share. Boost the strength of our robbery team. Every day in this market make money with ease by using the Thief Trading Style.🏆💪🤝❤️🎉🚀
I'll see you soon with another heist plan, so stay tuned 🫂
BCOUSD trade ideas

Oil initial break out - longBrent oil has been in a tight range for a while. It has initial broken a descending grind line on the daily. It may retest but it may not.
overall i think there is a much bigger move to the upside looking on the weekly but will take time to happen.


UKOIL - Long SetupMy main trading principle is that the price always moves from swept liquidity levels to untouched liquidity levels.
In particular case we clearly can see the following context: price swept 1D key swing low and left untouched swing high.
But to take more statistically more probable trades we should wait for some type of lower timeframe confirmation, and it this case we can notice sign of strength, so potentially there is a higher probability to see price higher.
Your success is determined solely by your ability to consistently follow the same principles.

BCOUSDThe price has been moving around a descending trendline for some time. Notably, the September 30, 2024 candle, which shows the highest volume since March 13, 2023, has not been broken to the downside. I believe the trend reversal is about to begin, with a critical level at 75.060 to watch for confirmation.

What Is the Difference Between Brent and WTI Crude OilWhat Is the Difference Between Brent and WTI Crude Oil for Traders?
Brent Crude and WTI are two of the most important oil benchmarks in the world, influencing global markets and trading strategies. While both represent high-quality crude, they differ in origin, composition, pricing, and market dynamics. This article explores questions like “What is Brent Crude?”, “What is WTI Crude?”, and “What is the difference between Brent and crude oil from West Texas?”, helping traders navigate their unique characteristics.
Brent Oil vs Crude Oil from West Texas
Brent Crude and West Texas Intermediate (WTI) are two primary benchmarks in the global oil market, each representing distinct qualities and origins.
What Is Brent Crude Oil?
Brent Crude originates from the North Sea, encompassing oil from fields between the United Kingdom and Norway, like Brent, Forties, Oseberg, Ekofisk, and Troll. This region's offshore production benefits from direct access to sea routes, facilitating efficient transportation to international markets. The North Sea's strategic location allows Brent Crude to serve as a global pricing benchmark and influence oil prices worldwide.
This blend is slightly heavier and contains more sulphur compared to WTI. Despite this, Brent Crude is extensively traded and serves as a pricing reference for about two-thirds of the world's oil contracts, primarily on the Intercontinental Exchange (ICE).
What Is WTI Crude Oil?
West Texas Intermediate is primarily sourced from US oil fields in Texas, North Dakota, and Louisiana. The landlocked nature of these production sites means that WTI relies heavily on an extensive network of pipelines and storage facilities for distribution. A key hub for WTI is Cushing, Oklahoma, which serves as a central point for oil storage and pricing. This infrastructure supports WTI's role as a benchmark for US oil prices.
Known for its lightness and low sulphur content, West Texas Crude is ideal for refining into gasoline and other high-demand products. WTI serves as a major benchmark for oil prices in the United States and is the underlying commodity for the New York Mercantile Exchange's (NYMEX) oil futures contract.
Brent and WTI Crude Oil CFDs
Most retail traders interact with Brent and WTI through Contracts for Difference (CFDs) instead of futures contracts. CFDs enable traders to speculate on price fluctuations without having to own the underlying physical oil. Instead, they open buy and sell positions and take advantage of the difference in the price from the time the contract is opened to when it’s closed.
This makes CFDs a popular choice for retail traders looking to make the most of short-term price fluctuations in oil without the complexities of physical ownership, storage, or delivery. CFDs also offer leverage, allowing traders to control larger positions with smaller capital.
You can trade Brent and WTI crude oil at FXOpen with tight spreads and low commissions! Check the recent oil prices at the TickTrader trading platform.
Quality and Composition Differences
Brent Crude is classified as a light, sweet crude oil. It has an API gravity of approximately 38 degrees, indicating a relatively low density. Its sulphur content is about 0.37%, making it less sweet compared to WTI. Brent's composition is well-suited for refining into diesel fuel and gasoline, which are in high demand globally.
But what is WTI like? Known for its superior quality, WTI boasts an API gravity of around 39.6 degrees, making it lighter than Brent. Its sulphur content is approximately 0.24%, classifying it as a sweeter crude. This lower sulphur content simplifies the refining process, allowing for the production of higher yields of gasoline and other high-value products.
These differences in API gravity and sulphur content are significant for refiners. Lighter, sweeter crudes like WTI are generally more desirable because they require less processing to meet environmental standards and produce a higher proportion of valuable end products. However, the choice between Brent and WTI can also depend on regional availability, refinery configurations, and specific product demand.
Trading Volumes and Market Liquidity
Brent Crude and WTI both see significant trading volumes, but they differ in terms of their market liquidity and global reach.
As mentioned above, Brent Crude is widely traded on international markets, and it serves as the pricing benchmark for roughly two-thirds of the world's oil contracts. Its broad appeal comes from being a global benchmark, which makes it highly liquid in global exchanges like ICE Futures Europe.
This high liquidity means traders can buy and sell contracts with relative ease, often with tighter spreads. As a result, it’s popular among traders looking for high-volume, internationally-influenced oil exposure.
On the other hand, WTI is primarily traded in the US through exchanges like the NYMEX (New York Mercantile Exchange). While still highly liquid, WTI's trading volumes tend to be more concentrated within the US market.
Despite this, it remains a crucial benchmark, especially for traders focusing on the US oil industry. Its close ties to the domestic market mean liquidity can be slightly more affected by US-specific factors.
Pricing Influences and Differences Between Brent and WTI
The geographic focus and market influence distinguish WTI Crude vs Brent oil. Brent is a globally traded benchmark, making it more reactive to international forces, while WTI’s market is more US-centric, with pricing heavily influenced by domestic factors and energy dynamics.
Therefore, Brent Crude and WTI often trade at different prices, with Brent Crude typically priced higher. This price difference, known as the Brent-WTI spread, reflects the varying dynamics between global and US markets. Traders keep a close eye on this spread, as it signals the relative strength of international versus US oil markets.
Price Influences for Brent Crude
- Geopolitical events: Brent is highly sensitive to tensions or conflicts in major oil-producing regions like the Middle East and North Africa. Any disruptions to supply routes or production in these areas can cause its prices to spike.
- OPEC+ decisions: Since many OPEC+ members produce oil that influences Brent’s pricing, their decisions on production cuts or increases have a direct impact on its price. A reduction in global output typically raises prices.
- Global shipping and transport logistics: Brent is traded internationally, so shipping costs, potential blockages in transport routes (e.g., the Strait of Hormuz), and other logistics play a role in price movements.
- Global energy demand: Trends in global demand, especially from key regions like Europe and Asia, affect pricing. For instance, economic growth in these regions tends to push prices higher.
Price Influences for WTI
- US shale oil production: WTI is highly responsive to the levels of US shale oil output. When production surges, oversupply can put downward pressure on prices.
- US oil inventory levels: Key storage hubs like Cushing, Oklahoma, are crucial for pricing. Rising inventory levels signal oversupply, which typically lowers prices, while declining inventories may indicate higher demand and push prices up.
- Pipeline and transportation infrastructure: Bottlenecks in US oil pipelines or delays in transportation can influence WTI pricing. For instance, limited capacity in pipelines can restrict oil flow to refineries, leading to fluctuations in prices.
- Domestic energy policies: Government regulations, taxes, or subsidies affecting US energy production can impact prices, with changes in drilling activity or environmental policies influencing supply levels.
Which Oil Should Traders Choose?
When deciding between WTI vs Brent, traders consider their market focus, trading strategy, and the factors driving each benchmark. Here’s an overview of what might help you choose:
1. Geopolitical Focus
- Brent Crude is more sensitive to global geopolitical events, making it a strong choice for traders who focus on international markets. If you analyse global tensions, OPEC+ decisions, or international energy policies, Brent is likely more relevant.
- WTI is less influenced by global events and more driven by US domestic factors. Traders focused on US politics, infrastructure, and energy policies may find WTI a better fit.
2. Market Liquidity and Trading Volume
- Brent Crude is widely traded across global exchanges, giving it strong liquidity. It’s ideal for traders who prefer access to international markets and global trading volumes. Its liquidity also makes it attractive for those trading larger volumes or seeking tighter spreads.
- WTI has high liquidity as well, but it’s more concentrated in US markets. This makes it better suited for traders with a specific interest in US oil dynamics.
3. Price Volatility
- Brent Crude tends to react more to geopolitical shocks, meaning it can experience more volatility from global crises. Traders looking for opportunities driven by international supply disruptions or geopolitical risks might prefer Brent.
- WTI is typically influenced by domestic production and inventory levels, which can result in different volatility patterns. US-focused traders or those tracking domestic shale oil production often gravitate toward WTI for its more region-specific volatility.
4. Regional Focus
- Brent Crude is favoured by traders who have a global outlook or trade oil products tied to European, Asian, or African markets.
- WTI is a solid choice for traders interested in US oil markets or those who rely on data from domestic US reports like the EIA.
The Bottom Line
In summary, understanding the differences between Brent Crude and WTI is crucial for traders analysing global oil markets. Both benchmarks offer unique opportunities depending on your trading strategy and market focus, whether you prefer the global influence of Brent or the US-centric dynamics of WTI. To get started with Brent and WTI CFDs, consider opening an FXOpen account for access to these key markets alongside low-cost trading conditions.
FAQ
Why Is Oil Called Brent Crude?
Brent Crude gets its name from the Brent oil field located in the North Sea, discovered by Shell in the 1970s. The name "Brent" was derived from a naming convention based on birds—specifically, the Brent goose. Over time, it’s become the benchmark for oil produced in the North Sea, now serving as a global pricing standard for much of the world's oil supply.
What Does WTI Stand For?
WTI stands for West Texas Intermediate. It refers to a grade of crude oil that is primarily produced in the United States, specifically from oil fields in Texas, North Dakota, and surrounding regions. WTI is one of the key benchmarks for oil pricing, particularly in North America.
Is Brent Crude Sweet or Sour?
Brent Crude is considered a light, sweet crude oil. It has a low sulphur content, making it easier to refine into high-value products like gasoline and diesel. However, it contains slightly more sulphur than WTI, which is why it's marginally classified as less sweet.
Why Is Brent Always More Expensive Than WTI?
Brent is often more expensive than WTI due to its global demand and greater sensitivity to geopolitical risks. Brent is influenced by international factors, including OPEC+ decisions and conflicts in key oil-producing regions, which often lead to supply disruptions. WTI, meanwhile, is more affected by domestic US supply and demand.
Is Saudi Oil Brent or WTI?
Saudi oil is neither Brent nor WTI. It falls under its own classification, primarily as Arabian Light Crude. However, Brent Crude is often used as a pricing benchmark for oil exports from Saudi Arabia and other OPEC nations.
This article represents the opinion of the Companies operating under the FXOpen brand only. It is not to be construed as an offer, solicitation, or recommendation with respect to products and services provided by the Companies operating under the FXOpen brand, nor is it to be considered financial advice.

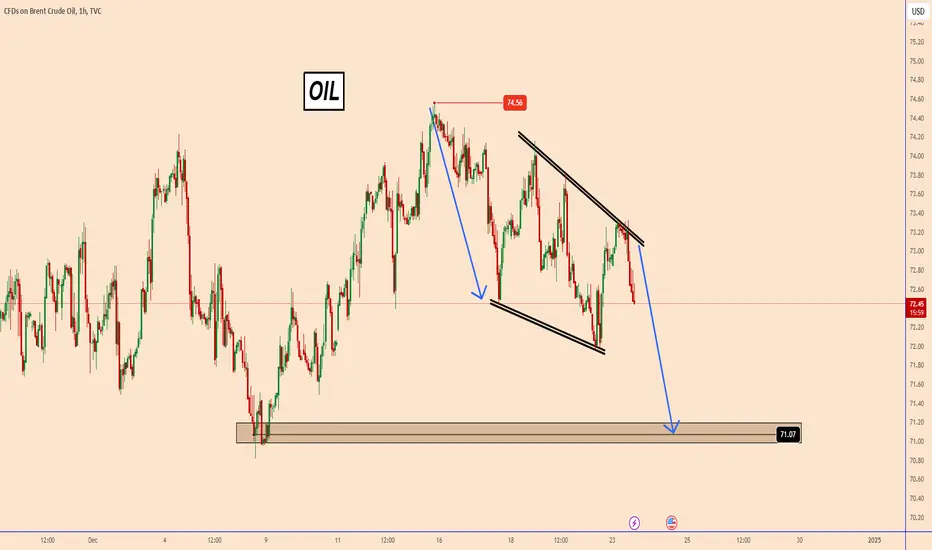
Oil Poised for Further Decline in December 2024Oil Poised for Further Decline in December 2024
On December 13, 2024, oil reached a new peak for the month, but since then, it has been on a downward trend.
Given the ongoing geopolitical instability, oil prices are experiencing a bearish wave with many fluctuations.
While trading in this manner is riskier, oil continues to make lower lows, suggesting a potential decline to the 70-71 range soon.
You can find more details in the chart!
Thank you!
BRENT Faces Further Downside Before RecoveryHello,
BLACKBULL:BRENT is likely to experience more downside before we see any upward movement. If the price fails to settle above the 1M PP and maintain that level, new lows are expected.
No Nonsense. Just Really Good Market Insights. Leave a Boost
TradeWithTheTrend3344

Brent / UK CRUDE OIL Energy Market Heist Plan on Bullish Side🌟Hi! Hola! Ola! Bonjour! Hallo!🌟
Dear Money Makers & Robbers, 🤑 💰
Based on 🔥Thief Trading style technical analysis🔥, here is our master plan to heist the Brent / UK CRUDE OIL Energy market. Please adhere to the strategy I've outlined in the chart, which emphasizes long entry. Our aim is the high-risk Red Zone. Risky level, overbought market, consolidation, trend reversal, trap at the level where traders and bearish robbers are stronger. 👀 So Be Careful, wealthy and safe trade.💪🏆🎉
Entry 📈 : You can enter a bull trade anywhere,
however I advise placing Multiple Buy limit orders within a 15 or 30 minute timeframe. Entry from the most recent or closest low & high level should be in retest.
Stop Loss 🛑: Using the 4H period, the recent / nearest low level.
Goal 🎯: 75.500
Scalpers, take note : only scalp on the Long side. If you have a lot of money, you can go straight away; if not, you can join swing traders and carry out the robbery plan. Use trailing SL to safeguard your money 💰.
Warning⚠️ : Our heist strategy is incompatible with Fundamental Analysis news 📰 🗞️. We'll wreck our plan by smashing the Stop Loss 🚫🚏. Avoid entering the market right after the news release.
Take advantage of the target and get away 🎯 Swing Traders Please reserve the half amount of money and watch for the next dynamic level or order block breakout. Once it is resolved, we can go on to the next new target in our heist plan.
💖Supporting our robbery plan will enable us to effortlessly make and steal money 💰💵 Tell your friends, Colleagues and family to follow, like, and share. Boost the strength of our robbery team. Every day in this market make money with ease by using the Thief Trading Style.🏆💪🤝❤️🎉🚀
I'll see you soon with another heist plan, so stay tuned 🫂

Oil next MovementOil competed the 4th wave of Elliot and moved upward exactly on wave 4 PRZ (Price reversal Zone). meanwhile the shark pattern is completed.
in case if Oil start to complete the wave 5 of Elliot the target price is shown and in case if the price reject the wave 4 PRZ downward, the shark PRZ also is been shown which can be a area to change the price process.
Thanks for comment and boost

Believe It or Not: A Big Move in Brent Oil is Loading!The energy markets are heating up, and Brent Oil is gearing up for a massive move. Whether it's a bullish rally or a sharp dip, the current price action screams “something big is coming!”
📊 What’s Brewing?
1️⃣ Tight Price Compression: Brent Oil is consolidating, forming a wedge pattern that often precedes explosive breakouts.
2️⃣ Volume Drying Up: The recent decline in trading volume suggests traders are waiting for confirmation—a perfect setup for a significant move.
3️⃣ Macro Factors in Play: Geopolitical tensions and OPEC's production decisions could act as the catalysts for the next big trend.
🔍 Technical Snapshot:
Resistance Zone: $___ (insert key level), a breach here could send it soaring.
Support Level: $___ (insert key level), breaking below this could lead to sharp corrections.
Indicators to Watch:
RSI: Is it hinting at overbought or oversold levels?
Moving Averages: Are they aligning for a golden cross or bearish crossover?
The Big Question:
Are we heading for a bullish breakout to $___, or is this the calm before a sharp pullback to $___?
📈 The clock is ticking! Drop your predictions in the comments and let’s ride this wave together. 🌊

"UKOILSPOT / BRENT CRUDE OIL" Energies Market Bullish Heist PlanHola! Ola! My Dear Robbers / Money Makers & Losers, 🤑 💰
This is our master plan to Heist "UKOILSPOT / BRENT CRUDE OIL" Energies Market based on Thief Trading style Technical Analysis.. kindly please follow the plan I have mentioned in the chart focus on Long entry. Our target is Red Zone that is High risk Dangerous level, market is overbought / Consolidation / Trend Reversal / Trap at the level Bearish Robbers / Traders gain the strength. Be safe and be careful and Be rich.
Entry 📈 : Can be taken Anywhere, What I suggest you to Place Buy Limit Orders in 15mins Timeframe Recent / Nearest Low Point take entry should be in pullback.
Stop Loss 🛑 : Recent Swing Low using 2H timeframe
Target 🎯 : 74.500
Attention for Scalpers : Focus to scalp only on Long side, If you've got a lot of money you can get out right away otherwise you can join with a swing trade robbers and continue the heist plan, Use Trailing SL to protect our money 💰.
Warning : Fundamental Analysis news 📰 🗞️ comes against our robbery plan. our plan will be ruined smash the Stop Loss 🚫🚏. Don't Enter the market at the news update.
Loot and escape on the target 🎯 Swing Traders Plz Book the partial sum of money and wait for next breakout of dynamic level / Order block, Once it is cleared we can continue our heist plan to next new target.
💖Support our Robbery plan we can easily make money & take money 💰💵 Follow, Like & Share with your friends and Lovers. Make our Robbery Team Very Strong Join Ur hands with US. Loot Everything in this market everyday make money easily with Thief Trading Style.
Stay tuned with me and see you again with another Heist Plan..... 🫂

Brent's Next Move: 1D PP Break or 1M PP Test?Hello,
BLACKBULL:BRENT has shown some upward momentum and could see further gains if the price breaks above the 1D PP level and establishes it as support. However, if this level acts as resistance, we might witness another test of the 1M PP.
No Nonsense. Just Really Good Market Insights. Leave a Boost
TradeWithTheTrend3344

My targets for Brent crude oil!Hello guys
These are my targets and my SL too
My ideas are exclusive to myself only and is not regarded as an advice for traders or investors and are not more than personal thoughts which I just wanted to share with you all and I do hope they could help.
I am not selling any signals and I do not take money favour any trades recommendations. They are free of charge all lifelong but I keep the copy rights of them though to not be copied or shared or sold.

Black gold continues its decline!Oil prices are falling for several reasons:
• Saudi Arabia has decided to lower oil prices for buyers in the Asian market.
• A strong dollar continues to pressure black gold.
The drop in oil prices below $70 per barrel is likely being restrained by OPEC+ policies aimed at controlling supply volumes. The organization has decided to postpone the planned January 2025 increase in oil production to April 2025.
Traders dealing with Brent crude oil show the most pessimistic sentiment in recent months after OPEC+ countries decided to delay the resumption of oil production halted since 2022. At best, this postponement may only slow the price decline amid seasonal demand reduction in the first quarter. With the holidays approaching, market volatility is also decreasing, as traders exercise caution and avoid making aggressive bets on sharp price movements.
Morgan Stanley and HSBC have revised their forecasts for oil oversupply, expecting Brent crude oil prices to reach $70 per barrel by 2025. Bank of America analysts predict that the average price of Brent will be $65 per barrel in the coming years.
According to a survey conducted by the law firm Haynes Boone LLP, banks expect WTI crude oil prices to drop to $60 per barrel by 2027.
Trade #BRENT and #WTI crude oil with FreshForex and maximize your profits with leverage of 1:2000 and tight spreads.
This allows you to manage positions efficiently, minimize costs, and capitalize on price fluctuations for potential gains.

BrentAbout oil I think we should wait for 73,715 to be touched. then we can think about sell from 73,740 after confirmations. It will be Risk/Reward 6 if it hits our target 72,365
the next possible long position will be somewhere around 72. #DYOR

Brent - Will stability return to the region?!Brent oil is located between EMA200 and EMA50 in the 4H time frame and is moving in its downward channel. We will look for oil buying positions on the midline of the ascending channel. In case of a valid failure of this channel, we can witness the continuation of the upward trend. On the other hand, within the supply zone, we can make short-term sales with appropriate risk reward.
China has announced plans to implement a “relatively accommodative” monetary policy. This announcement, accompanied by promises of support for more “active” fiscal policies, signals Beijing’s intention to further ease economic conditions. The news drew significant market attention, resulting in a 6% rise in the value of Chinese investment funds on U.S. stock exchanges. Similarly, the Australian dollar gained notable strength in currency markets, and commodity prices saw an uptick.
Meanwhile, according to Bloomberg sources, Chinese drone manufacturers have recently imposed restrictions on exporting key components used in drone production to the United States and Europe. This move strongly suggests that Beijing is unwilling to exert pressure on Moscow to end the war.
On another front, Donald Trump, the U.S. President-elect, announced after meeting with Ukrainian President Volodymyr Zelensky over the weekend that he is making serious efforts to end the war.Writing on his social media platform, Truth Social, Trump stated, “A ceasefire must be declared immediately, and negotiations must begin.” He added, “I know the President of Russia well. Now is the time for him to act. China can help. The world is watching!”
Simultaneously, the Biden administration, with Trump’s backing, is working to secure a ceasefire agreement and the release of hostages in Gaza before Trump’s inauguration on January 20. The negotiations have resumed swiftly and discreetly, with close coordination between Biden’s and Trump’s teams. Steve Witkoff, Trump’s newly appointed envoy to the Middle East, is playing a pivotal role in these talks.
Trump has demanded the release of hostages before his inauguration, warning that otherwise, “hell will break loose in the Middle East.” Biden administration officials have welcomed Trump’s support and are striving to ensure a smooth transition between the two administrations. Adam Boehler has been appointed as the lead official for hostage affairs and is expected to play an active role in Gaza negotiations.
Meanwhile, Goldman Sachs anticipates that OPEC+ production will remain data-dependent. The bank expects OPEC+ to increase production for four consecutive months starting in July, coinciding with strong summer demand. Additionally, Goldman Sachs predicts that India’s oil demand will grow by 0.3 million barrels per day next year.
According to the U.S. Energy Information Administration (EIA) in its latest Short-Term Energy Outlook (STEO), U.S. crude oil production is forecast to reach 13.24 million barrels per day this year and 13.52 million barrels per day next year. The EIA has also revised its 2024 price forecasts for Brent and WTI crude oil downward, projecting $76.51 per barrel for Brent and $80.49 per barrel for WTI. These figures are lower than last month’s forecasts of $77 and $80.95 per barrel, respectively.
U.S. crude oil inventories rose by 0.499 million barrels in the week ending December 6, 2024, following a 1.232 million barrel increase the previous week. According to the API Weekly Statistical Bulletin, this marks the fifth increase in eight weeks, defying market expectations of a 1.3 million barrel draw.

Brent: Key Levels for Upside or DownsideHello,
BLACKBULL:BRENT has once again dropped towards its previous lows. For an upward move, we need to see a breakout and confirmation above the 1D PP. A definitive upward shift requires a breakout and confirmation above the 1M PP. If it fails to hold above the 1D PP, further downside is likely.
No Nonsense. Just Really Good Market Insights. Leave a Boost
TradeWithTheTrend3344

UKOIL - Long SetupMy main trading principle is that the price always moves from swept liquidity levels to untouched liquidity levels.
In particular case we clearly can see the following context: price swept 1D key liquidity level and left untouched level higher.
But to take more statistically more probable trades we should wait for some time of lower timeframe confirmation. For me the best way to confirm higher timeframe context is structure.
We can notice the break of market structure (sign of strength) on key liquidity level with GAP, so there is a higher probability to see price higher at least on opposite level (marked higher).
Your success is determined solely by your ability to consistently follow the same principles.

UKOIL/Brent Crude Oil Energies Market Heist Plan on Bearish SideOla! Ola! My Dear Robbers / Money Makers & Losers, 🤑💰
This is our master plan to Heist UKOIL / Brent Crude Oil Energies Market based on Thief Trading style Technical Analysis.. kindly please follow the plan I have mentioned in the chart focus on Short entry. Our target is Near the Green Zone that is High risk Dangerous level, market is oversold / Consolidation / Trend Reversal / Trap at the level Bullish Robbers / Traders gain the strength. Be safe and be careful and Be rich 💰.
Entry 👇 📉: Can be taken Anywhere, What I suggest you to Place Sell Limit Orders in 15mins Timeframe, Recent / Nearest High Point entry should be in pullback.
Stop Loss 🛑: Recent Swing High using 1H timeframe
Attention for Scalpers : Focus to scalp only on Short side, If you've got a money you can get out right away otherwise you can join with a swing trade robbers and continue the heist plan, Use Trailing SL to protect our money 💰.
Warning : Fundamental Analysis news 📰 🗞️ comes against our robbery plan. our plan will be ruined smash the Stop Loss 🚫🚏. Don't Enter the market at the news update.
Loot and escape on the target 🎯 Swing Traders Plz Book the partial sum of money and wait for next breakout of dynamic level / Order block, Once it is cleared we can continue our heist plan to next new target.
💖Support our Robbery plan we can easily make money & take money 💰💵 Follow, Like & Share with your friends and Lovers. Make our Robbery Team Very Strong Join Ur hands with US. Loot Everything in this market everyday make money easily with Thief Trading Style.
Stay tuned with me and see you again with another Heist Plan..... 🫂

Crude Oil Compresses Near Key Support
Brent crude oil has been consolidating near a critical support level for more than two months. With the stage set for a decisive breakout, let’s explore what’s driving the market and where we could go from here.
A Fragile Geopolitical Backdrop
Although a ceasefire between Israel and Hezbollah was agreed last Wednesday, the environment in the middle east is far from stable. Reports of Israeli strikes on Lebanese targets earlier this week have kept tensions simmering.
However, the broader supply picture has eased. The International Energy Agency predicts an excess supply of over 1 million barrels per day in 2025, which has weighed on prices. On Friday, Brent crude closed at $72.94, and WTI at $68, with both benchmarks down over 3% for the week. This bearish tone has been reinforced by concerns over weaker demand prospects, as higher US interest rates appear less likely to be cut this month.
Adding to the mix, President-elect Donald Trump’s recent threats of 100% tariffs on BRICS nations have strengthened the US dollar. A stronger greenback makes dollar-denominated oil more expensive for other currencies, further pressuring demand.
The Technical Picture: A Triangle of Tension
On the weekly chart, oil prices have anchored around the March 2023 swing lows, which represent a key inflection point. September’s brief dip below this level saw buyers step in, and since then, the market has been stuck in a prolonged consolidation phase.
Brent Crude Weekly Candle Chart
Past performance is not a reliable indicator of future results
Shifting to the daily timeframe, the consolidation takes the form of a triangle pattern. Prices are effectively being ‘funnelled’ within an ever-tightening range, marked by lower swing highs and higher swing lows. Volume has steadily declined, which signals that the market is under compression and a significant breakout could be on the horizon.
Brent Crude Daily Candle Chart
Past performance is not a reliable indicator of future results
With this compression nearing its climax, two scenarios are in play:
1. A breakout to the upside: A long-bodied candle closing near its highs, accompanied by strong volume, would suggest the bulls are back in control. News of OPEC+ extending production cuts or easing dollar strength could catalyse this move.
2. A breakdown to the downside: A close below support would snap the current consolidation and likely trigger accelerated selling, particularly if concerns about oversupply in 2025 gain traction.
All Eyes on OPEC+
The upcoming OPEC+ meeting on 5th December will play a pivotal role in determining the market’s next direction. The group is expected to discuss delaying a planned production increase originally scheduled for January. An indefinite delay could ease some of the downward pressure on prices, providing a tailwind for any bullish breakout.
For now, the market is in wait-and-see mode, compressing further as traders position themselves for the outcome of this critical meeting. All eyes are on OPEC+ as the oil market braces for its next big move.
Disclaimer: This is for information and learning purposes only. The information provided does not constitute investment advice nor take into account the individual financial circumstances or objectives of any investor. Any information that may be provided relating to past performance is not a reliable indicator of future results or performance. Social media channels are not relevant for UK residents.
Spread bets and CFDs are complex instruments and come with a high risk of losing money rapidly due to leverage. 82.67% of retail investor accounts lose money when trading spread bets and CFDs with this provider. You should consider whether you understand how spread bets and CFDs work and whether you can afford to take the high risk of losing your money.

Brent Crude Oil Wave Analysis 3 December 2024
- Brent crude oil rising inside daily Triangle
- Likely to rise to resistance level 74.00
Brent crude oil recently reversed up from the support trendline of the daily Triangle inside which the price has been moving since September.
The upward reversal from this support trendline stopped the earlier impulse waves iii and 3 – which belong to the medium-term downward impulse sequence (3) from the start of October.
Brent crude oil can be expected to rise further to the next resistance level 74.00, coinciding with the resistance trendline of this Triangle.

Brent Outlook: Key Levels for Downside or Bullish ReversalHello,
BLACKBULL:BRENT is likely to face more downside if the 1D PP acts as resistance again. In that case, the price may revisit previous lows at 70.754 and 68.675. A break and sustained move below these levels will confirm further downside. However, a break and hold above the 1M PP could signal a bullish reversal and open the door to further upside.
No Nonsense. Just Really Good Market Insights. Leave a Boost
TradeWithTheTrend3344
