Amazon is overbought as price heads into overhead resistanceAmazon weekly chart analysis indicates an overbought condition at significant resistance.
Trading Forex/CFDs on margin carries a high level of risk and may not be suitable for all investors. Leverage can work against you.
Stratos Markets Limited (www.fxcm.com)
CFDs are complex instruments and come with a high risk of losing money rapidly due to leverage. 66% of retail investor accounts lose money when trading CFDs with this provider. You should consider whether you understand how CFDs work and whether you can afford to take the high risk of losing your money.
Stratos Europe Ltd (trading as “FXCM” or “FXCM EU”), previously FXCM EU Ltd (www.fxcm.com):
CFDs are complex instruments and come with a high risk of losing money rapidly due to leverage. 70% of retail investor accounts lose money when trading CFDs with this provider. You should consider whether you understand how CFDs work and whether you can afford to take the high risk of losing your money.
Stratos Trading Pty. Limited (www.fxcm.com):
Trading FX/CFDs carries significant risks. FXCM AU (AFSL 309763), please read the Financial Services Guide, Product Disclosure Statement, Target Market Determination and Terms of Business at www.fxcm.com
Stratos Global LLC (www.fxcm.com):
Losses can exceed deposits.
Any opinions, news, research, analyses, prices, other information, or links to third-party sites contained on this video are provided on an "as-is" basis, as general market commentary and do not constitute investment advice. The market commentary has not been prepared in accordance with legal requirements designed to promote the independence of investment research, and it is therefore not subject to any prohibition on dealing ahead of dissemination. Although this commentary is not produced by an independent source, FXCM takes all sufficient steps to eliminate or prevent any conflicts of interests arising out of the production and dissemination of this communication. The employees of FXCM commit to acting in the clients' best interests and represent their views without misleading, deceiving, or otherwise impairing the clients' ability to make informed investment decisions. For more information about the FXCM's internal organizational and administrative arrangements for the prevention of conflicts, please refer to the Firms' Managing Conflicts Policy.
Please ensure that you read and understand our Full Disclaimer and Liability provision concerning the foregoing Information, which can be accessed via FXCM`s website:
Stratos Markets clients please see: www.fxcm.com
Stratos Europe Ltd clients please see: www.fxcm.com
Stratos Trading Pty. Limited clients please see: www.fxcm.com
Stratos Global LLC clients please see: www.fxcm.com
Past Performance is not an indicator of future results.
AMZN trade ideas

AMZNAMZN appears to be in an upward trend, but it is currently experiencing consolidation in the middle of its price range.

AMZN will retest it’s all time high soon..!Anthropic AI is an American artificial intelligence (AI) safety and research company founded in 2 here in Scotts Valley, California! They focus on developing safe and beneficial AI systems. Here's a breakdown of some key points about Anthropic AI:
Mission:
Their primary goal is to ensure that advancements in Artificial Intelligence are directed towards beneficial outcomes for humanity.
Focus:
They conduct research on various aspects of AI safety, including:
Alignment:Ensuring AI systems act in accordance with human values.
Transparency: Understanding how AI systems reach decisions.
Robustness: Mitigating the risks of unintended consequences from AI.
Products:
Their main product is a family of large language models (LLMs) called Claude. Claude is known for its focus on safety principles during development and training. As of March 4, 2024, Claude 3 is the latest version.
Interestingly, Claude 3 has been incorporated into Amazon Web Services' (AWS) cloud-based platform for AI services, known as Bedrock. This allows companies to leverage the capabilities of Claude for their own AI projects.
Funding:
Anthropic AI has attracted significant funding, with over $1.5 billion raised as of July 2023.
*One notable investor is Amazon, which has partnered with Anthropic to offer Claude on its cloud platform.
Team:
Anthropic is led by a team with experience in machine learning, physics, policy, and product development.
The founders include Dario Amodei and Daniela Amodei, who were previously involved in OpenAI, another prominent AI research company.
Overall:
Anthropic AI is a company to watch in the field of artificial intelligence. Their focus on AI safety and the development of large language models like Claude position them as a significant player in shaping the future of AI.

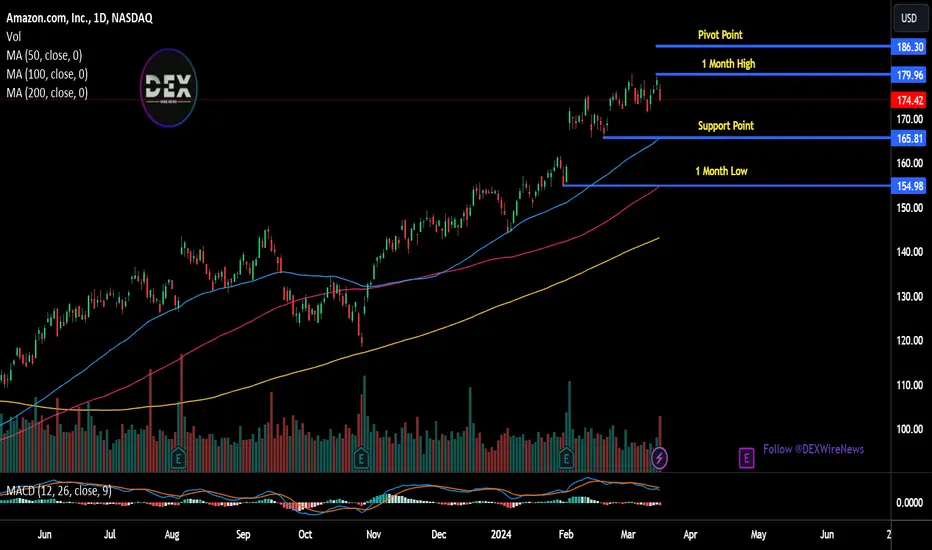
AMZN heads up at $177: likely break but possible "lower high" Amazon is finally catching up to its brethren.
It is currently testing a key level at 177.04/05
IF a correction is near, THIS could be the start.
$ 177.04 - 177.05 tight fib confluence is the key.
$ 170.83 - 171.71 is the first good support below.
$ 187.49 - 188.98 is next major resistance above.
I do think that the bull momentum will continue.
Break and Retest could be a late entry or an add.
Retrace could offer entries at the supports below.
===========================================
.

Amazon's Billion-Dollar: Anthropic Investment Fuels AI Arms RaceAmazon's foray into the realm of artificial intelligence has reached unprecedented heights with its monumental investment in Anthropic, a San Francisco-based startup pioneering generative AI technology. With a staggering $2.75 billion injection, Amazon ( NASDAQ:AMZN ) solidifies its commitment to staying ahead in the AI arms race, marking its largest venture investment to date. This strategic move underscores the escalating competition among tech giants to harness the transformative power of AI and secure their positions in the rapidly evolving technological landscape.
Amazon's Strategic Maneuver:
By doubling down on its investment in Anthropic, Amazon ( NASDAQ:AMZN ) demonstrates its strategic foresight in identifying and capitalizing on emerging technologies with disruptive potential. Anthropic's cutting-edge AI capabilities, including its foundation model and chatbot Claude, position it as a formidable contender in the AI landscape, challenging established players like OpenAI and ChatGPT. Amazon's substantial backing not only enhances Anthropic's resources for research and development but also strengthens its competitive edge in driving advancements in generative AI.
Implications for AI Innovation:
The infusion of billions of dollars into Anthropic reflects the growing significance of AI as a transformative force across industries. With Anthropic's groundbreaking AI models outperforming industry benchmarks and setting new standards for performance and capability, the potential for innovation in areas such as language processing, reasoning, and multimedia analysis is immense. Amazon's strategic collaboration with Anthropic is poised to accelerate the pace of AI innovation and unlock new possibilities for enhancing customer experiences and driving business outcomes.
Tech Giants' Spending Blitz:
Amazon's blockbuster investment in Anthropic is part of a broader trend of heightened investment activity among cloud providers and tech giants in the AI space. As competition intensifies, companies like Microsoft, Google, and Salesforce are also making significant investments in AI startups to bolster their AI capabilities and expand their market reach. This spending blitz underscores the pivotal role of AI in shaping the future of technology and underscores the strategic imperative for companies to stay at the forefront of AI innovation.
Regulatory Scrutiny and Ethical Considerations:
While the surge in AI investments signals a growing appetite for innovation, it also raises important questions regarding regulatory oversight and ethical considerations. Concerns about antitrust issues, revenue reporting practices, and the potential for misleading investors have prompted regulatory scrutiny, including inquiries by the U.S. Federal Trade Commission. As AI continues to reshape industries and societies, stakeholders must navigate complex ethical and regulatory landscapes to ensure responsible and equitable AI development and deployment.

✅AMAZON POTENTIAL SHORT🔥
✅AMAZON will soon retest a key resistance level of 188.92$
So I think that the pair will make a pullback
And go down to retest the demand level below at 174.16$
SHORT🔥
✅Like and subscribe to never miss a new idea!✅

Amazon Stock: Bulls Charge, Bears RetreatWhen we look at the chart of the Amazon stock, two things stand out: the clear upward trend and the noticeable hidden bullish divergence in the VOLD indicator. The latter indicates that despite significant efforts, the bears are unable to push the price down. In a clear and long-established upward trend, this suggests further rising prices.
The presented trading idea offers a good risk-reward ratio of 1.6:1.

The importance of the Inside bars!An inside bar is a two- candlestick pattern used in technical analysis to identify potential breakouts or reversals in the price of a security.
The first candlestick, called the "mother bar," is any sized candlestick. The second candlestick, called the "inside bar," is entirely contained within the high and low of the mother bar. This means that the inside bar's high is lower than the mother bar's high, and the inside bar's low is higher than the mother bar's low.
There are two main ways to interpret inside bars:
Continuation: An inside bar can signal a continuation of the prevailing trend. For example, if the mother bar is bullish (i.e., a bar with a higher close than open), then an inside bar following the mother bar may signal that the bulls are still in control and that the price is likely to continue rising. Conversely, if the mother bar is bearish (i.e., a bar with a lower close than open), then an inside bar following the mother bar may signal that the bears are still in control and that the price is likely to continue falling.
Reversal: An inside bar can also signal a potential reversal of the prevailing trend. This is because the inside bar suggests that there is indecision or hesitation among traders, which can sometimes lead to a reversal in price direction
Conclusion: Although losing money in the weeks inside bars formed is inevitable, Inside bars are silent before the storm.

Possible Inverse H&SPrice broke above the neckline recenlty with a retest. Earnings this week. Resistance around the 155 to 160 range. Upside target is close to 200. I like long term calls to manage risk.

Amazon in the third waveDear analysts and traders,
I hope you are doing well and are motivated for the week ahead. I wish you all the success in your business endeavors. Remember that success in trading lies in consistently defining and sticking to your rules.
As someone interested in the Elliott Wave Principle, I find it to be an invaluable tool for market analysis. I have developed my approach by combining this principle with my personal experience and by considering different scenarios that are likely to occur in the market. It should be noted that I do not like to be surprised in the market, and that's why I have different market prospects. I follow them to be sure and recognize the structure that is forming so that I can 100% recognize it.
I will share my analysis with you, but please note that I am not providing any buy or sell signals. My perspective on idea analysis is completely unbiased, so if the idea analysis meets your standards, you can use it as a guide to make an informed decision.
I have attached my previous analysis of the same market so that you can compare and see the differences. All the details of my analysis are clearly labeled, making it easy for you to understand. However, having a basic familiarity with the Elliott Wave Principle theory will help you understand the analytical idea more easily.
I have been studying the Elliott Wave Principle for almost three years now, and over time, my understanding of this knowledge and experience has grown. What I have achieved so far is the legacy of a genius called Ralph Nelson Eliot, and I am really happy with my progress. May peace be upon him.
Thank you for your support so far. I will always remember your kindness. Please share your comments and criticisms with me.
I hope my analysis will be useful to you in your business journey, and I wish you all the best.
Sincerely,
Mr. Nobody

AMAZON BULLISH BREAKOUT ON CONSOLIDATIONAmazon just confirmed a bullish breakout on the identified minor resistance level created with the consolidation zone. Expecting a move back up towards the previous high created.

Amazon Rally or Crash: Decision Point Approaching!For Amazon, we're currently at a critical juncture with two potential scenarios:
Scenario 1 - Uptrend: This scenario suggests that Amazon has completed a five-wave cycle, finishing Wave I in September 2020, and concluded the corrective phase (Wave II) by December 2022. If this is the case, we're now in Wave III, indicated by a five-wave impulse upwards, comprising a higher Wave (1) followed by a corrective Wave (2). This scenario implies that after hitting a low at $81.43, the stock is in an uptrend. The maximum extension for this uptrend, or red Wave 5, leading to a higher Wave (1), is targeted at $181.
Scenario 2 - Ongoing Correction: Alternatively, it's posited that the overarching Wave II hasn't finished yet, and only a Wave (A) of the correction has been completed so far. Here, we anticipate the formation of Wave (B) shortly, to be followed by a Wave (C). The exact target of Wave (C) would depend on where Wave (B) concludes. For this scenario, the benchmarks for a potential Expanded Flat correction range between $177 (100% extension) and $214 (138% extension). Surpassing these values would negate the scenario of an incomplete Wave II, confirming that we are in Wave III.
The current chart patterns lean more towards the first scenario, indicating an uptrend and the end of Wave II at $81.43. The critical levels are thus set at $181 for confirming the uptrend, and between $177 to $214 for the alternate scenario. Breaking through these levels would clarify which phase Amazon is currently in.

Amazon stock break out pattern Amazon stock is now ready to break out after a strong consolidation pattern.

AmznNice move incoming in the next week or 2.
Rising wedge setup here but looking inside the wedge and there range trade or (Flag setup) the range is 172-180
The 20sma has now move up to add support to the trendline around 175-176.. if Amzn breaks 175 then 172 is incoming. I dont think 172 will give way unless something very negative for amzn happens or overall market correction.
Im leaning long here to ATH or 188..
Entry:
A close above 180
Or
A retest of 20sma around 175-176..
Afterwards is expect a correction back to support or trendline around 160

AMZN Oversold - Initial LongCouple points to consider
1) RSI
2) Bullish divergence as drawn
3) Price below BB (In general price tends to print inside Bollinger Bands, usually a move below/above them will almost immediately result in the opposite move)
4) 5 oscillators flashing bullish on 3D chart
For me an easy 20-30% profit long trade. Too bad I can't be arsed to open a trading account on a broker.

$AMZN CyclesNASDAQ:AMZN Cycle
Daily - Printed DCL and now showing negative divergence indicating the weekly cycle should start declining soon.
Weekly - On week 21 and looking for a decline down to the weekly HCL (bar 28)
Monthly - still early on the monthly.

3 Tips to Improve Your TimingTiming is everything in trading. The ability to enter and exit positions at the right moment can significantly impact your profitability.
Here are three simple tips to help you enhance your timing and make better trading decisions:
1. Lower Your Execution Timeframe
Lowering your trading timeframe can provide more precise insights into short-term market dynamics.
Example: Combining Breakouts
Maybe your trading strategy is buying breakouts from flag patterns on the daily candle chart that align with long-term uptrends.
The best breakout trades occur simultaneously across multiple timeframes and achieve high levels of participation. Lowering your execution time frame to the 1hr candle chart can potentially help you to achieve a more precise entry.
Flag Breakout Daily Candle Chart: Amazon (AMZN)
Past performance is not a reliable indicator of future results
Flag Breakout Hourly Candle Chart: Amazon (AMZN)
Past performance is not a reliable indicator of future results
Example: Timing Pullbacks
Maybe your trading strategy is buying pullbacks on the hourly candle chart.
A pullback on a higher timeframe is a downtrend on a lower timeframe. Traders can add precision to timing their pullbacks by looking for trend reversal patterns on lower timeframes that align with the higher timeframe trend.
In the below example, a trader who buys pullbacks to the 20 – 50 period moving averages on the hourly candle chart could use trend reversal patterns on the 5min candle chart to precisely time their entry.
Timing Pullbacks Hourly Candle Chart: GBP/USD
Past performance is not a reliable indicator of future results
5min Candle Chart Adds Precision: GBP/USD
Past performance is not a reliable indicator of future results
2. Use Pre-Alerts
If you’ve been trading for a while, chances are you’re already utilising the valuable tool that is price alerts – ensuring you will be notified when a price hits a certain level.
However, if you’re a momentum trader and setting price alerts at breakout levels, you may want to rethink where you’re placing your price alerts.
The best breakouts are powerful, high-volume events where price is moving quickly. Placing an alert at the breakout level can make trading the breakout rushed and stressful – making for suboptimal timing.
Pre-alerts are price alerts set at levels that prior to the breakout occurring. When used properly they have the potential to bring a number of benefits:
Depth and Detail: Pre-alerts help you observe the breakout in real time. This can provide more detail about the breakouts conviction than if you’re only monitoring the market post breakout.
Reduced Stress: A pre-alert ensures you are prepared and focused on execution prior to the breakout. This will reduce stress levels which should ultimately help you to make better decisions.
Faster Execution: If you’re ready and at your desk prior to the breakout occurring, you stand a better chance of achieving a better entry price.
3. Combine Technical and Fundamental Catalysts
Integrating technical analysis with fundamental catalysts can enhance your timing and decision-making process.
Here are some practical strategies for combining catalysts effectively:
Stay Informed: Stay updated on relevant market news, economic data releases, and corporate earnings announcements that may impact the markets you trade. Utilise financial news websites, economic calendars, and real-time news feeds to stay informed about upcoming events and their potential implications on market dynamics.
Validate Technical Signals: Confirm technical setups with supporting fundamental factors. For example, if you identify a bullish chart pattern, look for positive news or fundamental developments that align with the pattern's bullish bias.
Be Selective: Prioritise quality over quantity when selecting news events to incorporate into your trading analysis. By focusing on impactful catalysts, you can streamline your analysis process and allocate your resources more effectively to capitalise on the most promising trading opportunities.
For more information on the power of combining technical and fundamental catalysts, check out our two-part Trade The News series (link at the bottom of the page).
Disclaimer: This is for information and learning purposes only. The information provided does not constitute investment advice nor take into account the individual financial circumstances or objectives of any investor. Any information that may be provided relating to past performance is not a reliable indicator of future results or performance. Social media channels are not relevant for UK residents.
Spread bets and CFDs are complex instruments and come with a high risk of losing money rapidly due to leverage. 84.01% of retail investor accounts lose money when trading spread bets and CFDs with this provider. You should consider whether you understand how spread bets and CFDs work and whether you can afford to take the high risk of losing your money.

Amazon Pair : Amazon AMZN
Description :
Bullish Channel as an Corrective Pattern in Short Time Frame
RSI - Divergence
Break of Structure
Rising Wedge in Long Time Frame
CHoCH

Amazon (AMZN) Looking for 7 Swing CorrectionShort Term Elliott Wave view in Amazon (AMZN) suggests that wave 4 is in progress as double three Elliott Wave structure. Rally to 180.14. Down from there, wave a ended at 176 and rally in wave b ended at 177.08. The stock then resumed lower in wave c towards 173.3 which completed wave (w) in higher degree. Up from there, wave (x) unfolded as a flat structure. Up from wave (w), wave a ended at 176.46 and wave b ended at 172.06. Wave c higher ended at 178.79 which completed wave (x). The stock then turned lower in wave (y) with internal subdivision as a zigzag structure.
Down from wave (x), wave a ended at 174.33 and wave b ended at 175.93. Wave c lower ended at 171.47 which completed wave (y) of ((w)). Stock then bounced higher in wave ((x)) as another double three in lesser degree. Up from wave ((w)), wave (w) ended at 176.76 and wave (x) ended at 174.88. Wave (y) higher ended at 179.52 which completed wave ((x)). Stock then turned lower in wave ((y)). Down from wave ((x)), wave (a) ended at 173.9 and wave (b) ended at 176.69. Expect the stock to extend lower in wave (c) of ((y)) to complete wave 4. Potential target lower is 100% – 161.8% Fibonacci extension of wave ((w)). This area comes at 165.54 – 170.88 where buyers can appear. Near term, as far as pivot at 179.52 high stays intact, stock has scope to extend lower.

AMZN's Cup and Handle forecasts bullish continuation LONGMZN on a daily chart is in the continuation phase of a cup and handle patter which started In
August 2022. Of the Magnificent 7, it has performed better than the rest with the exception of
NVDA. The cup and handle pattern suggests continuation to the price level of $ 200 which is
similar to the all-time high with 5- 8% added for inflation ( July and November 2021 in the
range of 187 ). On the reliability of a cup and handle pattern and that of a daily chart
compared with a lower time frame I will take long positions in AMZN in both AMZU EFT shares
and long dated call options for AMZN more or less ITM at $ 175.

Amazon's Zoox Robotaxis Accelerate Towards Autonomous FutureIn the race towards autonomous driving supremacy, Amazon's self-driving car unit, Zoox, is making significant strides to enhance its capabilities and expand its testing footprint. With plans to drive faster, farther, and even at night in Las Vegas, Zoox is positioning itself to compete with rivals like Waymo and General Motors' Cruise. These developments underscore the relentless pursuit of innovation in the realm of self-driving technology and the quest to redefine transportation as we know it.
Zoox's Ambitious Expansion:
Announced recently, Zoox's expansion plans in California and Nevada signal a bold step forward in its quest for autonomy. The company aims to increase the testing parameters for its fleet of uniquely designed vehicles, allowing them to operate at higher speeds of up to 45 miles per hour. Additionally, Zoox is extending its testing territory in Las Vegas to five miles, exposing its robotaxis to more diverse and challenging driving conditions than ever before.
Embracing Nighttime Driving and Adverse Weather:
In a bid to gather comprehensive data and enhance the robustness of its autonomous systems, Zoox is venturing into nighttime driving and light rain conditions. This strategic move underscores the company's commitment to addressing real-world challenges and fine-tuning its technology to operate seamlessly in various environmental scenarios.
The Pursuit of Full Autonomy:
Like its competitors, Zoox aspires to achieve full autonomy, envisioning a future where human drivers are replaced by self-driving vehicles. While the timeline for this transition remains uncertain, the advancements made by Zoox in expanding testing capabilities and refining its technology bring this vision closer to reality.
Navigating Regulatory Challenges:
While the promise of autonomous driving is tantalizing, regulatory hurdles remain a significant barrier to widespread adoption. The halting of testing by General Motors' Cruise following regulatory scrutiny serves as a stark reminder of the challenges inherent in navigating the regulatory landscape. Nevertheless, companies like Zoox are undeterred, pressing forward with their innovation agenda while ensuring compliance with regulatory requirements.
Amazon's Strategic Acquisition:
Amazon's acquisition of Zoox in 2020 for over $1 billion sparked speculation about the tech giant's intentions, including the possibility of using the autonomous vehicles for delivery purposes. While Zoox has yet to unveil its long-term plans beyond robotaxis, the acquisition underscores Amazon's strategic vision and its commitment to revolutionizing the future of transportation.
Conclusion:
As Zoox accelerates towards a future of autonomy, the trajectory of self-driving technology continues to evolve rapidly. With each milestone achieved and every challenge overcome, companies like Zoox are edging closer to realizing the transformative potential of autonomous driving. As the world eagerly anticipates the dawn of a new era in transportation, one thing is clear: the journey towards autonomy is fraught with challenges and opportunities, but the destination promises a future of safer, more efficient, and truly revolutionary transportation.
AMZN primed to break 52 week high of 180.25Perfect bounce off of VWAP, 21 day EMA, and trendline. Bounce off of fib golden pocket. ATR trailing stop for entries is bullish.

Amazon - Break And RetestHello Traders, welcome to today's analysis of Amazon.
--------
Explanation of my video analysis:
In 2020 Amazon created a beautiful triangle breakout which was followed by a +75% rally and then a -50% correction. After the correction was over, Amazon perfectly retested a confluence of support and reversed aggressively towards the upside. Considering that Amazon just rallied 100%, I am now just waiting for a retest of the structure mentioned in the analysis.
--------
I will only take a trade if all the rules of my strategy are satisfied.
Let me know in the comment section below if you have any questions.
Keep your long term vision.
