How to navigate the Amazonian Squeeze. AMZNHello I am the Cafe Trader.
This week has been a deep dive on the MAG 7 and today AMZN is up next.
We are going to look at long term and short term opportunities.
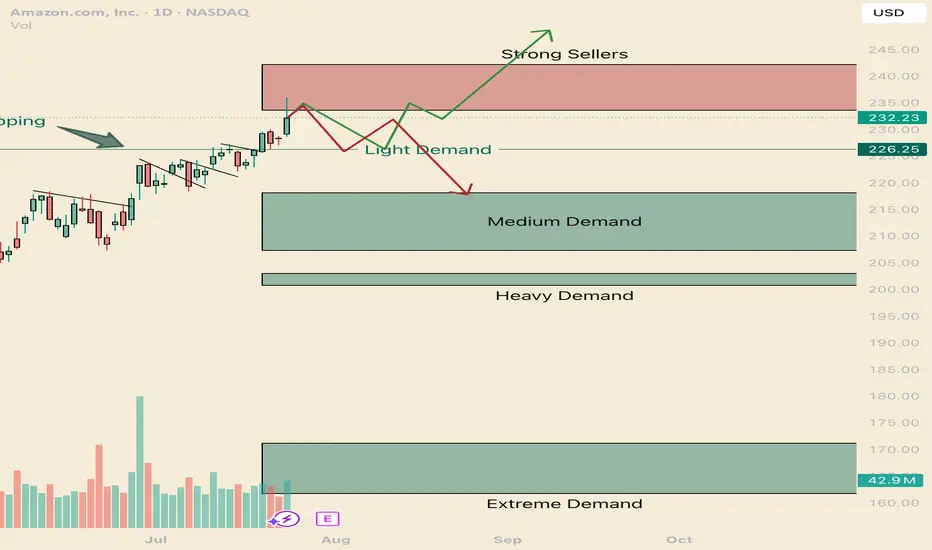
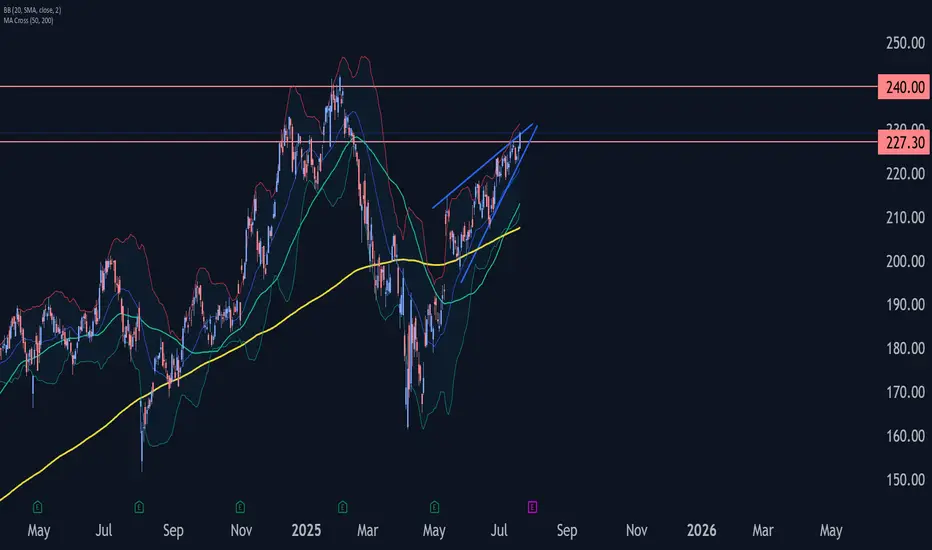
We are near the All Time Highs, with one final Seller to get through before making the break.
Today we tested to see if those sellers
Key facts today
Next report date
—
Report period
—
EPS estimate
—
Revenue estimate
—
5,970 CLP
59.13 T CLP
636.69 T CLP
9.60 B
About Amazon.com
Sector
Industry
CEO
Andrew R. Jassy
Website
Headquarters
Seattle
Founded
1994
FIGI
BBG00YFSC9Z6
Amazon.com, Inc. is a multinational technology company, which engages in the provision of online retail shopping services. It operates through the following segments: North America, International, and Amazon Web Services (AWS). The North America segment offers retail sale of consumer products, including from sellers, advertising, and subscriptions services through North America-focused online and physical stores. The International segment focuses on retail sale of consumer products, including from sellers, advertising, and subscription services through internationally-focused online stores. The AWS segment is composed of global sales of compute, storage, database, and other services for start-ups, enterprises, government agencies, and academic institutions. The company was founded by Jeffrey P. Bezos in July 1994 and is headquartered in Seattle, WA.
Related stocks
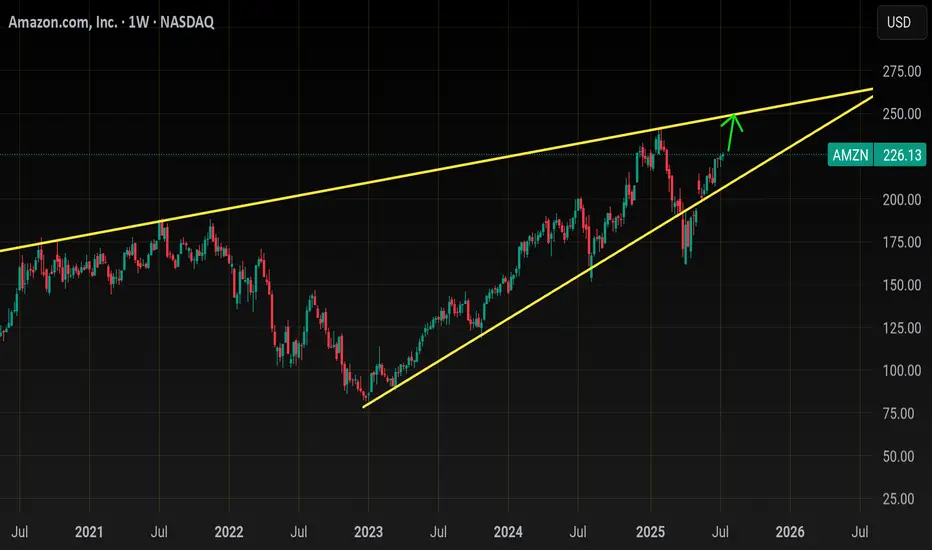
AmznLooks like 250 is incoming on this stock
V-shape recovery happening in real time
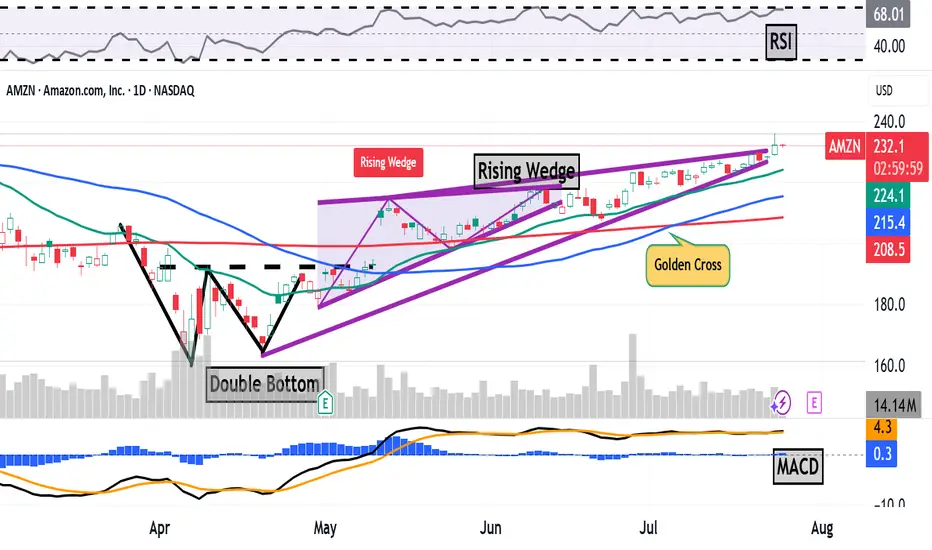
Don't put too much Emphasison this rising wedge in terms of bearishness.. just use it as a range to trade... Will most likely trade inside of it until a catalyst comes to push it to breakout to the upside
Looking
Amazon Has a Mixed Technical Picture Heading Into EarningsNext week will see four of the "Magnificent Seven" stocks report quarterly earnings -- Apple NASDAQ:AAPL , Amazon NASDAQ:AMZN , Microsoft NASDAQ:MSFT and Meta Platforms NASDAQ:META . Let's check out AMZN ahead of its results.
Amazon's Fundamental Analysis
FactSet recently reported analys
Amazon Market Robbery Blueprint – Swing/Scalp Long Setup🟨💣 “AMZN Market Heist Blueprint – Bullish Robbery in Progress 🚨💼💸” 💣🟨
By Thief Trader – Rob the Market with Precision
🌍 Hello World! Hi, Hola, Ola, Bonjour, Hallo, Marhaba!
🤑💰 Calling all Money Makers & Market Robbers – get ready to execute the next bullish heist on AMAZON.COM, INC (NASDAQ: AMZN),
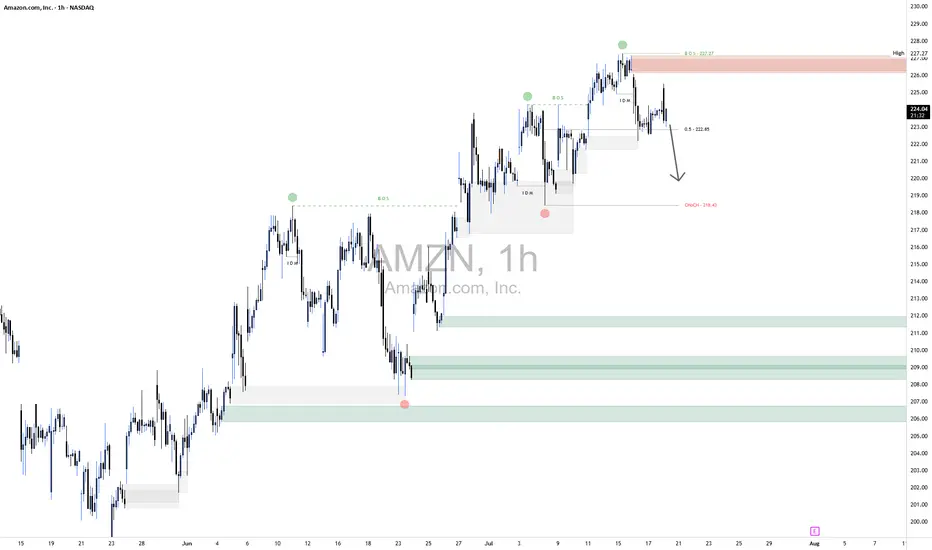
Amazon Wave Analysis – 21 July 2025
- Amazon broke resistance zone
- Likely to rise to resistance 240.00
Amazon recently broke the resistance zone between the resistance level 227.30 (top of the previous impulse wave i) and the resistance trendline of the daily Rising Wedge from May.
The breakout of this resistance zone accelerated
AMZN at a Crossroad! TA for July 16Options & Intraday Trading Setups to Watch This Week 🔍
🧠 GEX Analysis & Options Sentiment (Tanuki)
* GEX Sentiment: Mildly Bullish
* CALLs Volume: 10.6% → Neutral-to-Weak Bullish
* IV Rank (IVR): 26.3 → Low implied volatility rank
* IVx Avg: 33.9 → Neutral options environment
Gamma Walls / Levels t

AMZN Short1.Liquidity Landscape
Buy-Side Liquidity Cleared:
Liquidity above the recent swing high was taken — likely triggering breakout traders and stop orders from earlier shorts.
This move appears to be a classic liquidity raid before a reversal.
Sell-Side Liquidity in Focus:
Price is now targeting sel
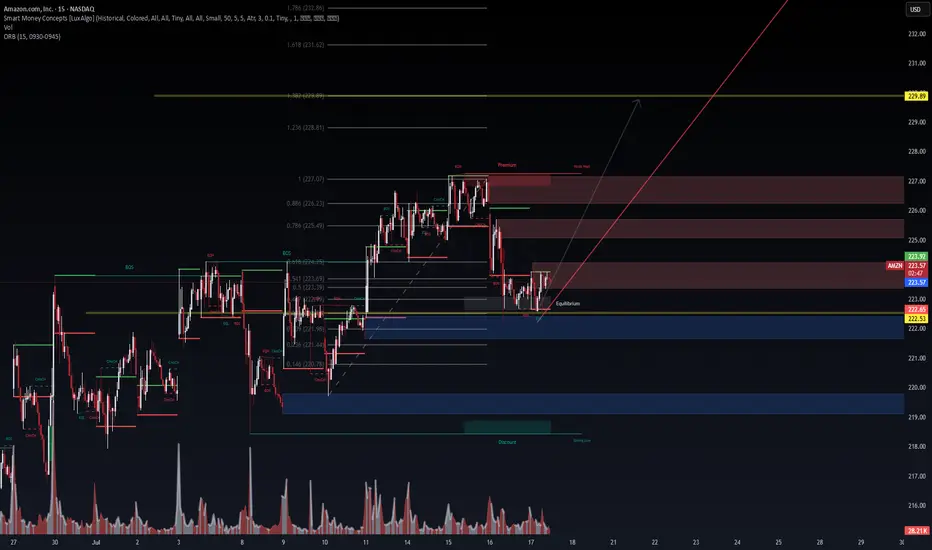
AMZN 15m – Institutional Demand Reclaim in Progress | VolanX Pro📈 AMZN 15m – Institutional Demand Reclaim in Progress | VolanX Protocol Alert
Amazon (AMZN) is staging a potential bullish reversal from a deep discount zone following a strong rejection near the 0.146–0.236 Fibonacci confluence at ~$220.78–221.44. We are now consolidating near the equilibrium zone
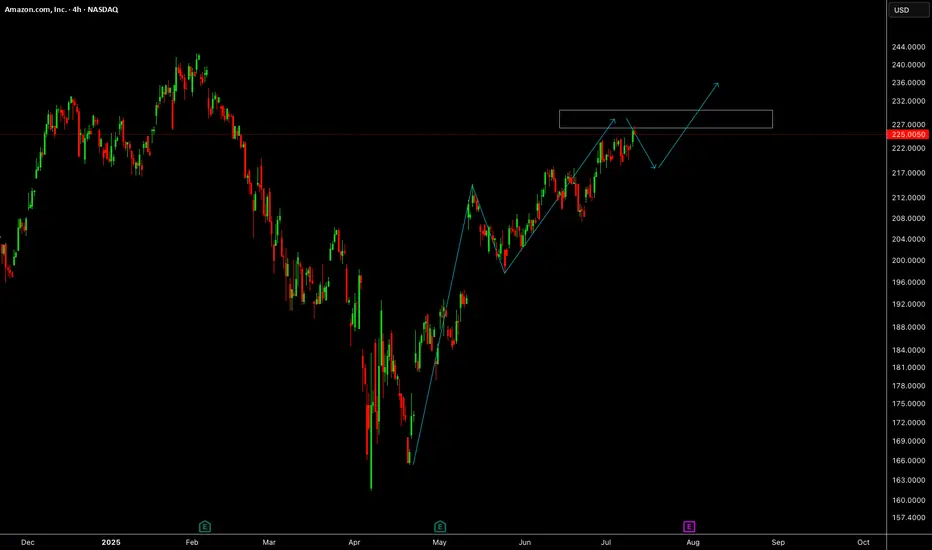
AMZN: Daily Trend Change with Bullish Continuation Setup
🗓 Published: June 26, 2025
📍 Ticker: NASDAQ:AMZN – Amazon.com Inc.
🕒 Timeframes: Daily & 4H
📊 Technical Bias: Bullish
📈 Trend: Higher Highs & Higher Lows
🧠 Analysis Summary
Amazon has successfully reclaimed a bullish market structure on the daily chart by forming higher highs and higher lows sin

AmazonAmazon needs small correction and further push up towards 235 level.
Disclosure: We are part of Trade Nation's Influencer program and receive a monthly fee for using their TradingView charts in our analysis.
See all ideas
Summarizing what the indicators are suggesting.
Neutral
SellBuy
Strong sellStrong buy
Strong sellSellNeutralBuyStrong buy
Neutral
SellBuy
Strong sellStrong buy
Strong sellSellNeutralBuyStrong buy
Neutral
SellBuy
Strong sellStrong buy
Strong sellSellNeutralBuyStrong buy
An aggregate view of professional's ratings.
Neutral
SellBuy
Strong sellStrong buy
Strong sellSellNeutralBuyStrong buy
Neutral
SellBuy
Strong sellStrong buy
Strong sellSellNeutralBuyStrong buy
Neutral
SellBuy
Strong sellStrong buy
Strong sellSellNeutralBuyStrong buy
Displays a symbol's price movements over previous years to identify recurring trends.
Curated watchlists where AMZNCL is featured.


Frequently Asked Questions
The current price of AMZNCL is 222,530 CLP — it has increased by 0.89% in the past 24 hours. Watch AMAZON COM INC stock price performance more closely on the chart.
Depending on the exchange, the stock ticker may vary. For instance, on BCS exchange AMAZON COM INC stocks are traded under the ticker AMZNCL.
AMZNCL stock has risen by 3.03% compared to the previous week, the month change is a 11.44% rise, over the last year AMAZON COM INC has showed a 30.90% increase.
We've gathered analysts' opinions on AMAZON COM INC future price: according to them, AMZNCL price has a max estimate of 285,714.29 CLP and a min estimate of 185,714.29 CLP. Watch AMZNCL chart and read a more detailed AMAZON COM INC stock forecast: see what analysts think of AMAZON COM INC and suggest that you do with its stocks.
AMZNCL reached its all-time high on Dec 19, 2024 with the price of 238,000 CLP, and its all-time low was 71,520 CLP and was reached on Jan 5, 2023. View more price dynamics on AMZNCL chart.
See other stocks reaching their highest and lowest prices.
See other stocks reaching their highest and lowest prices.
AMZNCL stock is 2.45% volatile and has beta coefficient of 1.34. Track AMAZON COM INC stock price on the chart and check out the list of the most volatile stocks — is AMAZON COM INC there?
Today AMAZON COM INC has the market capitalization of 2,344.52 T, it has increased by 2.04% over the last week.
Yes, you can track AMAZON COM INC financials in yearly and quarterly reports right on TradingView.
AMAZON COM INC is going to release the next earnings report on Jul 31, 2025. Keep track of upcoming events with our Earnings Calendar.
AMZNCL earnings for the last quarter are 1.52 K CLP per share, whereas the estimation was 1.30 K CLP resulting in a 16.38% surprise. The estimated earnings for the next quarter are 1.24 K CLP per share. See more details about AMAZON COM INC earnings.
AMAZON COM INC revenue for the last quarter amounts to 148.40 T CLP, despite the estimated figure of 147.90 T CLP. In the next quarter, revenue is expected to reach 151.65 T CLP.
AMZNCL net income for the last quarter is 16.33 T CLP, while the quarter before that showed 19.96 T CLP of net income which accounts for −18.22% change. Track more AMAZON COM INC financial stats to get the full picture.
No, AMZNCL doesn't pay any dividends to its shareholders. But don't worry, we've prepared a list of high-dividend stocks for you.
As of Jul 26, 2025, the company has 1.56 M employees. See our rating of the largest employees — is AMAZON COM INC on this list?
EBITDA measures a company's operating performance, its growth signifies an improvement in the efficiency of a company. AMAZON COM INC EBITDA is 121.93 T CLP, and current EBITDA margin is 19.15%. See more stats in AMAZON COM INC financial statements.
Like other stocks, AMZNCL shares are traded on stock exchanges, e.g. Nasdaq, Nyse, Euronext, and the easiest way to buy them is through an online stock broker. To do this, you need to open an account and follow a broker's procedures, then start trading. You can trade AMAZON COM INC stock right from TradingView charts — choose your broker and connect to your account.
Investing in stocks requires a comprehensive research: you should carefully study all the available data, e.g. company's financials, related news, and its technical analysis. So AMAZON COM INC technincal analysis shows the buy rating today, and its 1 week rating is strong buy. Since market conditions are prone to changes, it's worth looking a bit further into the future — according to the 1 month rating AMAZON COM INC stock shows the strong buy signal. See more of AMAZON COM INC technicals for a more comprehensive analysis.
If you're still not sure, try looking for inspiration in our curated watchlists.
If you're still not sure, try looking for inspiration in our curated watchlists.