Boeing: Aerobatics ✈️Welcome to Boeing’s aerobatics-show! Watch with bated breath as the share is taking off from the magenta-colored zone, propelling toward the resistance at $224.76, which it should conquer soon to conclude the loop of wave 1 in green in the green zone between $251.82 and $288.54. Then, in a death-defying stunt, Boeing should drop back below $224.76 and dive below the support at $173.85 afterward. However, there is a 33% chance that Boeing could curb its boost earlier, slipping below $173.85 prematurely to develop wave alt.2 in green into the green zone between $168.58 and $141.08. In that case, wave alt.1 in green would have already been finished in January.
BACL trade ideas

Boing, were to go from here?It’s looks going at least 50% fibo from here, but 88 fibo more attracting to me at this stage,
Lets see how it goes

BOEING COMPANY short bearish push for expect
Hi viewers, BA price break zone, tech. side showing we can expect bearish trend
TP1:192
TP2:186
TP3:180

BA - Wedge TighteningBA has been stuck in this channel for the start of the year. Price action has been tight as the movement has been very range bound.
As time continues to move on through the next quarter there may be an event that pushes price to break out of this sideways ranging movement. Near the middle of February we started to see price start to test ranges which could signal a potential reaction. Price showed to thin out near the price of 220 as the bulls ran thin and bears took over.
Looking to see how price continues to play within the range and potentially move out.

BoeingClosed right at .618
Looking for a pullback early in the week to 21ema at around 208, Max 205. They won't drop this back below 205 unless the Dow tanks or some negative company news comes out.
Boeing and MSFT played a big part in the Dow jones comeback late in the week.
Short target
208
Stop loss 216

Boeing Long 1Dthe action has been presenting a clear upward trend for months. it had a retracement that confirms the entry in favor of the main trend with a pullback pattern

BAHas been distributing since early Jan, finally broke down last week. We closed outside our Bollinger bands so we might dead cat bounce to 205 before heading Lower.
My target is 190 gap close .
Resistances 205, 215
Support 195, 190
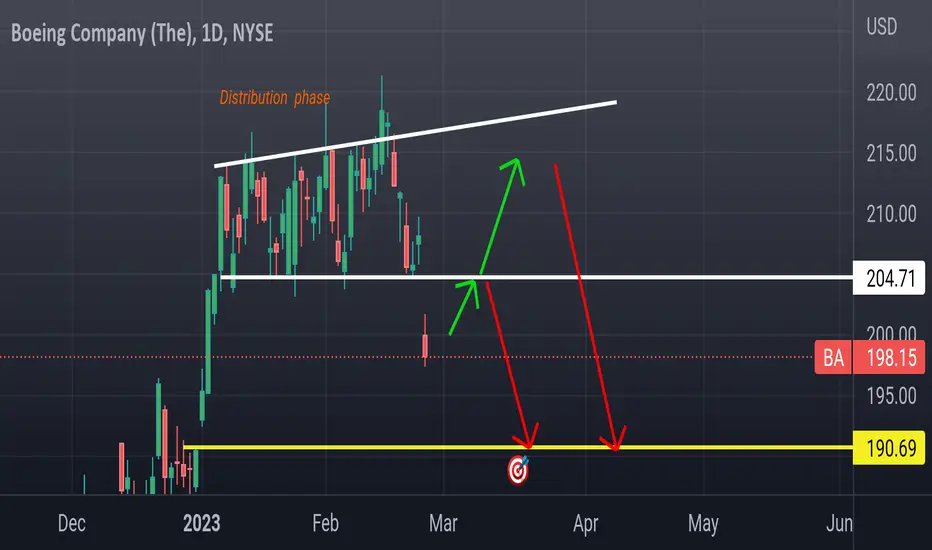
BA: Week of Feb 27 Uh oh, BA is seemingly experiencing some troubles with take off.
Coming in a bit hot on its landing back down to earth.
Finally breaking down from this distribution like top its been doing and it seems like it will continue to pull back.
To what extent, not sure, but as of right now, the ranges to watch for next week are in the chart along with the corresponding probability.
Probability is displayed cumulatively as, of course, no identical dates.
BA lost a whopping 6% this past week and is riding pretty oversold on stochastics, but not so much on RSI.
Despite this, probability model thinks a continuation down is the most likely situation here. We also have a bearish reference target.
Just thoughts, not advice!
Safe trades.

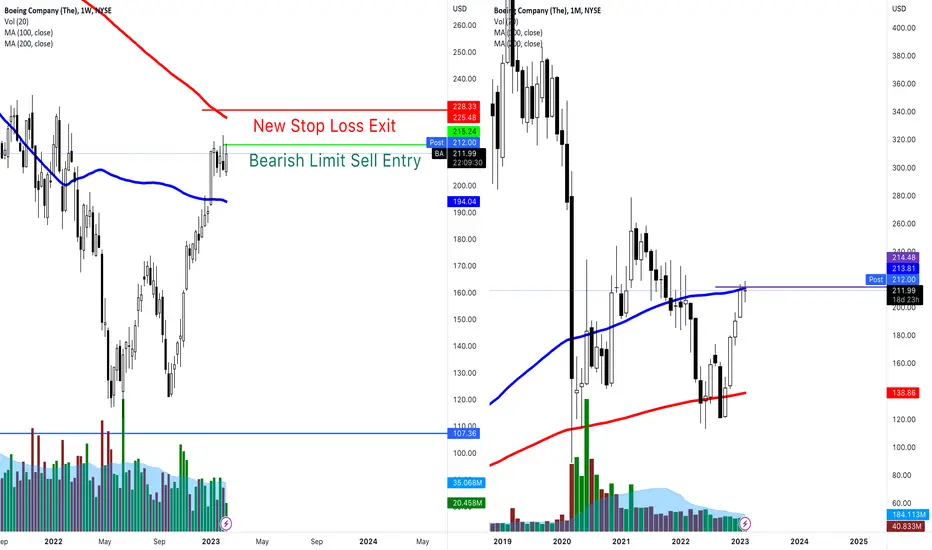
Short on BA Lost 1R back in JAn shorting off of the 100 SMA on a weekly. Now, shorting 100 sma on a monthly, stop is above the 200 sma on a weekly. BE THE TRAP
BA FEB24 220/FEB17 225 DIAGONAL CALLHIGH BASE SET-UP
Detailed Definition of setup and what market conditions are desirable
Ok, so on January the 13th, BA made a new swing high and it's been trading above the 50-day SMA...really since about November 2nd. So as far as trend analysis goes, BA looks like it has more momentum to the upside in the coming months.
Detailed Definition of the trigger (entry point) used to enter positions
You can say this also has an ascending triangle pattern but I saw this more as a longer than 5 day base with lower or equal volume. I had set an alert for 212.15 using yesterday's high as my trigger. I also wanted to wait until earnings to see the price action. Seems to me as this has a higher probability of it going higher.
Detailed Definition used to determine Stops (abandon or adjust)
No stops will be used. I'm set up for max loss risking under 2% of my portfolio.
Detailed Definition of the methods used to determine targets
Let's take a look at the 4 hour chart. Since about November 10th 2022, it's been poking it's head above it until the price action brought it into the upwards channel I drew. So if it trades in this area until the 17th of this month.. then it should come close to my 225 target. But it may even want to jump up to the other channel above it and push to 230, 235, 240 maybe? That's why I went with a diagonal strategy just incase it does take off more.
How strike prices and expiration dates are selected
If we look at the hour chart I think it may want to slowly trade within this channel to get to 225 by the week of the 17th. Also, this traded in this range of 200ish to 225ish for most of the back half of 2021. So I would think it might want to trade in this area once again. 3 weeks is more than enough time for this trade to unfold.
Position management strategies when the stock goes lower
If the stock goes lower I'll let the combo expire worthless since I'm set up for max loss.
Position management strategies when the stock goes sideways
Again, set up for max loss so if it just stays here, i'll let it expire worthless and move on to the next trade.
Position management strategies when the stock goes higher
This is the outcome I prefer. If this goes straight through 225 and stays above 225 come the 17th, I'll close out the entire combo. That's why I would prefer this pushes up to the higher channel and stays above 225 until the 17th.
Position management strategy at expiration
Come February 17th, if this is trading below 225, I'll let my 225 strike expire and hold on to my 220 strike until the 24th. The week of the 24th I'll monitor this and close out the 220 strike once it gets to my 225 target.

$BA Potential DistributionWill watch what happens out of this consolidation zone. If breaks below, will look for a pop back into shelf for a SS. If breaks above thesis invalidated.

BOEING COMPANY in next periods new bullish for expect
Hi viewers, BA bullish in last periods, more on technically side its for exepct still bullish trend soon
TP1:225
TP2:233
TP3:240

Longsetup for BA - The Boeing CompanyNYSE:BA
We realized some unusual call volume in the last days for the stock of BA. Also the chart looks really good for a breadout above 220 $.
Executives for Air India unveiled the single-largest airplane purchase ever on Tuesday (Feb 14), purchasing close to 500 planes from Boeing and Airbus. Although the price was not made public, industry experts estimate the cost at about $85 billion.
Under Tata Group’s ownership , Air India will look to challenge domestic giant IndiGo and regain its place as the country’s largest airline. Specifically, the airline will buy 220 planes from US-based Boeing and 250 from Airbus that will be assembled in Europe. (source: yahoo finance)
We bought the stock at 15.57 $
Buy Market: 218.45 $
Sell Stop Loss: 199.50
Sell Profit Target: 245.00
When the stock reaches 230.00 $ you can also move the stoploss to your entry price as a breakeven stop.

Stock Idea: $BA (15 Feb 2023)$BA
- Held breakout from range post-CPI on Tue
- Still possible to enter closer to $216 pivot

BA: Week of Feb 13Looks like a distribution top, no?
But you know BA, full of tricks and games.
Ranges shown in chart. Reference target is around 212. Open above, I would be bearish to it. Open below, I would be bullish to it.
Momentum favours a move to the upside next week. Monthly range has highs in the 220s.
I am looking to long to be honest. But we will reference the 99% target on Monday.
Check back on this post, and I will post the 99% target on open on Monday.
Safe trades


BoeingLook at Boeing price action last 30 days. Now go and look at Dow jones or DIA price action last 30days.
Boeing is listed on the Dow, sometimes heavy weighted stocks mimic the moves of the ETf or index its listed under. In this case both The dow jones and Boeing had a massive run up late last fall. Since January the dow has been trading between resistance and 50sma (See link). Boeing has been trading under 215 fib resistance and 21ema.
Boeing movements without any company specific news will mimic the Dow . Today Dow close at resistance and so did Boeing. Let's see what happens tomorrow..
Overhead Boeing has a gap to close at 234.
Below 21ema Boeing has support at 195
Fib levels
High - 278.57
Low - 113.02

Something going on with BoeingSomething is going on with Boeing $BA
Sales acceleration into double digits and volume pattern screaming accumulation. Holding tight at highs.
One to keep your eyes on.

BA D3 - potentially reversing an extended run at key zoneBA is extended and struggling at key zone of confluence. The stock currently has relatively low implied volatility in comparison over the last few months, so it is setting up for legging into a high probability option spread.

BA Price headed to monthly resistanceDifficult chart to do the analysis. However, at a high timeframe like monthly, it is a bit easier. It seems there is a big monthly resistance sitting just 15% above the current price. That resistance is a zone 238-243.
There is higher probability that if price moves higher from here, it will stall in that range and probably face a rejection there for a pullback. In case of a pullback, the price will find support at the marked monthly support.

$BA Boeing formed a large double bottom base , and smaller IH&S continuation base can be decent entry

BA The Boeing Company Options Ahead of EarningsIf you haven`t BA The Boeing Company after my last post:
Then you should know that Looking at the BA The Boeing Company options chain ahead of earnings , I would buy the $210 strike price Call with
2023-4-21 expiration date for about
$14.90 premium.
If the options turn out to be profitable Before the earnings release, I would sell at least 50%.
Looking forward to read your opinion about it.

Stock Idea: $BA (1 Feb 2023)$BA
- Slower name, but building a tight flag while surfing 10 and 20 DMAs
