Boeing - Get ready to sell and go short$8.25 is what Boeing is looking to move this week from Fridays closing price. I think the chart explains it all. No questions will be answered. I will let the emotional people fight amongst themselves but mark this post and come back in 8 months. You will see my posts are beyond accurate. Good luck. For the record, I started my short position at 226.50
BACL trade ideas

$BA pivotWatching for reaction off double top and 1.0 st dev of pitchfork. Overextended beyond the 9ema daily. Puts if it fails to break 227 or below 221.24. Bullish engulfing hammer daily and displayed good relative strength and rvol on a downtrend day in the indices with ER runup Jan 26 and airlines ER this week and last week as a catalyst. Calls if it breaks 227 with volume.

Boeing looking to break out of downtrend channel. Keep on watch!
Look for Boeing next week to breakout of this channel or reverse back into channel. Time will tell, best of luck traders!
Give a thumbs up if you like this analysis! Comment down below your thoughts if you agree or want me to look at other stocks to analyze!

Question will BA break out or continue the downtrendBA is in a meaningful downtrend. However much has changed. First they may be finally able to go back into production and complete deliveries now that China has signed off.
Second the wildfire that is Omicron is expected to burn out quick. People are sick of the covid and want to travel.
what will happen next? 1 Breakout 2 resume downtrend
This deserves to be watched.

$BA weekly...Going to be a fun week next week if we keep running, if not, I will be prepped with some put hedges just in case. Have a great weekend all!

BARejected again at the 200 sma & daily downtrend on high volume. Feels like distribution. Going with this feeling until we get a decisive close above the blue downtrend line.

$BA just getting started...Weekly setting up to blow through all SMAs...let's see what next week brings...

BA short (pt. 4)I have revised my chart after BA broke above what I believed was a resistance line. I took my BA puts at 110% gain as BA turned on me and started to reverse higher. As for now I am still short BA and am now going to rely on the revised chart which still appears to be in a descending channel, but could also play out to be a bearish megaphone pattern. I picked up puts for Feb. 25 exp. @ktaba likes his steak medium. I, however, am a little more barbaric and prefer a little more moo in my meat. @ktaba medium rare for me ;)
Not financial advice

Reversal of course! To the moon!All you bears are gonna get slaughtered! BA is on it's way up! It's been going down for about 8 months now and with all the good news coming out, it has nowhere to go but up! Price target is $300 by the EOY.

Boeing: Looking for Lower Levels? The Boeing Company - Short Term - We look to Sell at 208.00 (stop at 216.00)
Preferred trade is to sell into rallies. Previous support, now becomes resistance at 205.00. Levels close to the 50% pullback level of 209.60 found sellers. Daily signals are bearish. The bias is still for lower levels and we look for any gains to be limited. Further downside is expected although we prefer to set shorts at our bespoke resistance levels at 205.00, resulting in improved risk/reward.
Our profit targets will be 187.00 and 176.00
Resistance: 205.00 / 230.00 / 240.00
Support: 200.00 / 190.00 / 180.00
Disclaimer – Saxo Bank Group. Please be reminded – you alone are responsible for your trading – both gains and losses. There is a very high degree of risk involved in trading. The technical analysis, like any and all indicators, strategies, columns, articles and other features accessible on/though this site (including those from Signal Centre) are for informational purposes only and should not be construed as investment advice by you. Such technical analysis are believed to be obtained from sources believed to be reliable, but not warrant their respective completeness or accuracy, or warrant any results from the use of the information. Your use of the technical analysis, as would also your use of any and all mentioned indicators, strategies, columns, articles and all other features, is entirely at your own risk and it is your sole responsibility to evaluate the accuracy, completeness and usefulness (including suitability) of the information. You should assess the risk of any trade with your financial adviser and make your own independent decision(s) regarding any tradable products which may be the subject matter of the technical analysis or any of the said indicators, strategies, columns, articles and all other features.
Please also be reminded that if despite the above, any of the said technical analysis (or any of the said indicators, strategies, columns, articles and other features accessible on/through this site) is found to be advisory or a recommendation; and not merely informational in nature, the same is in any event provided with the intention of being for general circulation and availability only. As such it is not intended to and does not form part of any offer or recommendation directed at you specifically, or have any regard to the investment objectives, financial situation or needs of yourself or any other specific person. Before committing to a trade or investment therefore, please seek advice from a financial or other professional adviser regarding the suitability of the product for you and (where available) read the relevant product offer/description documents, including the risk disclosures. If you do not wish to seek such financial advice, please still exercise your mind and consider carefully whether the product is suitable for you because you alone remain responsible for your trading – both gains and losses.

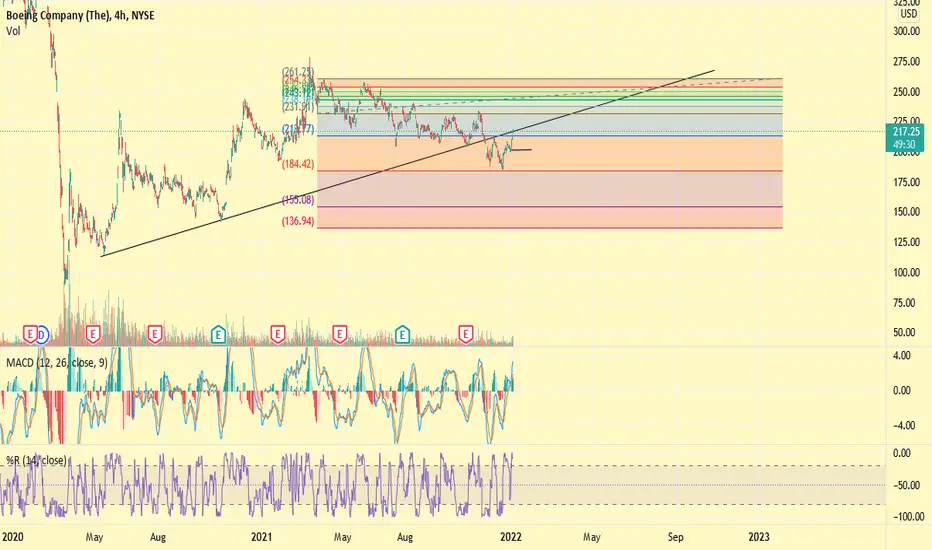
Extended Falling Channel in $BA$BA has been the opposite of a pandemic darling and has been slowly grinding its way from out of the March 20 lows in a series of falling channels in which it currently finds itself. Interestingly the previous two channels were much shorter and volume highs from each channel has been decreasing. This should setup a big move soon. Bias is to break out and continue upward movement. From a macro perspective the commercial side is still up in the air (pun intended) but the defense side should have good support from posturing even without an actual conflict. Biggest risk is the channel keeps falling and this turns into a breakdown and a revisit of March 20.

$BA failure to start the week...Failing with the market, but relative weakness as well. I would like to hold $210 today in order to stay bullish for the week, or else we are just continuing the range with sub-$200 at risk again

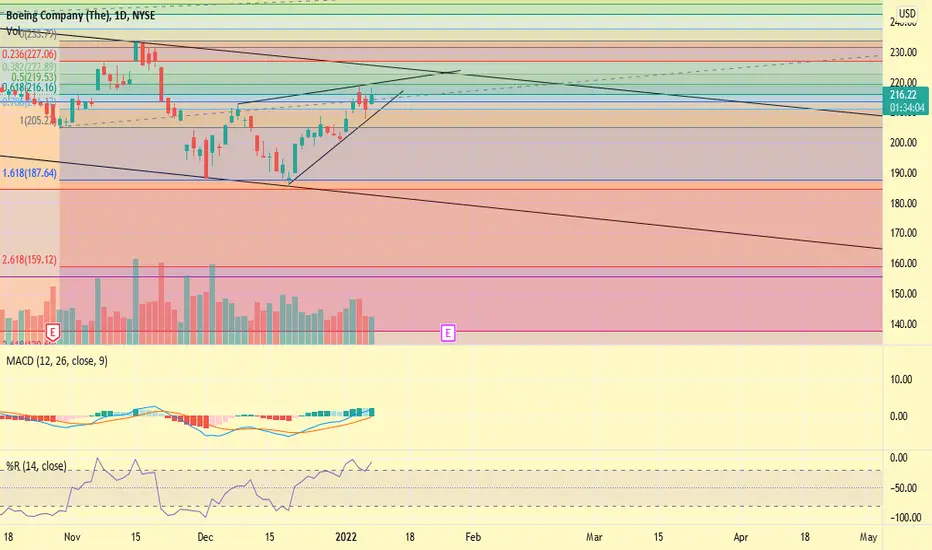
BA Reversal Time? BA appears to be breaking a downtrend and also reclaiming an important fib level. Lots of Bullish options activity recently as well. Top chart going into next week. Every line on my chart has been there for several weeks. Also MACD very close to crosing. Needs weekly close over 225 to be even more bullish.

BA short (pt.3)As much as @ktaba and I disagree on this stock, it's still fun to poke the bull (in this case). If BA can't hold this triangle, I see BA falling to $200 or lower next week. @ktaba let's see how this plays out!
Not financial advice
BA PutFollowing BAs big red day yesterday and first day printing a light green bar on the MACD I'm looking for continuation to the downside with a break of yesterdays LOD.

BA#BA chart
BA broken the downtrend line
ready to fly
after 2 days very strong bearish sell off in the market price did not go under the trend line which means a alot of buyers are buying the Boeing to keep above the trend line .
price tested 50 MA and jump which means bullish signal. confirmation is when 20 MA go above 50 MA which is a strong indication of jumping to higher price.

at resistance ! the next 30 days 👀ba recently saw a fresh rejection at its extreme trend resistance, a dip to support will most likely happen in the next 30-60 days.
I will consider a long position once we hit support, paytience.
like and follow for more 💘

Boeing ~ BA 242 or so should hit next on Boeing. Dow should remain strong this year.
Boeing may begin to move and breakout much further on the longer term DTL.

$BA good week but...Now with the pull back in the market, we are still only just in a range. We did not break through. I grabbed some same week put protection earlier in case the whole market pulls back...end of week for $SPY and $QQQ are pretty critical here...

BA holdingBA is holding against resistance. If $BA can't break resistance, expect a fall back to $186, then eventually to $155 to fill gap.
BA at a cross roadsMy last examine of Boeing was a complete failure. This time around I took more time to try and evaluate all possibilities.
BOEING close right up to its year long resistance in addition to 100sma. RSI also has some resistance in this area. Also at the top of its bollingerbands
A breakout here would be huge and I think we could push for 226 fibonacci area before any pullback. 200sma also at 226
If we reject and close below 210 we could pullback to 193 then 170


$BA Relative strength....Nice rebound today from $210's back up close to high of the day, see if we can get a runner into close...
