Boeing 2022 OutlookBA will head up to $350 area around Aug time then will collapse to $30.
If you have any questions, lemme know in the comments and will answer you as soon as I can.
Thank you,
#NEWYEAR2022
#STOCKMARKET
#INDUSTRY40
BACL trade ideas


$BA updated daily...Above the 10 and 21 Day SMA, inside day, below the anchored VWAP from the previous high.

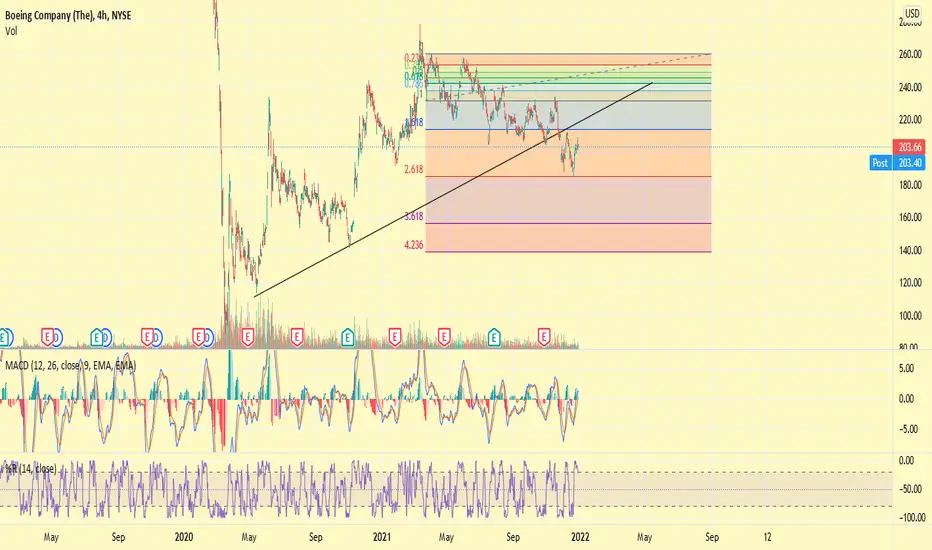
BA to go lowerBA has had a slew of issues since two Boeing MAX commercial jets crashed in '18 and '19. From delayed deliveries to missing sales opportunities, Boeing stock still has more selling ahead. The 3.618 fib retracement sits rights at the gap at 158, but if the stock breaks down to those levels, I foresee the support being at the 4.236 level at 140-142.
Not financial advice
First red close in 5 days. More to come?BA looks like it may have lost its momentum. It is down 6% from where it was a year ago and tested the important level of $200 in the morning. The stop is the previous high of 205 if it moves to the 212 level by chance. A conservative TP is 193 with the 180's the next significant level.

$BA solid start...Target still $210, then $220 if we can keep this momentum going. Crucial to hold $200 on any pullback...

$BA ✈💡Gave us a nice reversal in the group this morning as we noticed call activity increasing. Cleared important levels and had some good news!


$BA held well...$220 is the first target on a recovery play here. Held pretty well on poor news over the holidays on cancelled flights, a lot riding on the end of this week to show strength.

$BA holding $200 line...After the airline cancellations I fully expected this to drop hard sub $200, today airlines and this are holding better that I expected. On watch for end of the year. Would like over $200 to end the year, ideally $210+, then start a rally in 2022 assuming COVID subsides...

Not much left for BA before it goes up in flamesLittle boys it's fundamental setup is sealed, not that one needs the fundamentals to know that. Thousands of flights cancelled in the last 2 days alone. The virus they are clueless about is being the headline to blame. The chart says it all. Boeing is about to nosedive in 2022 faster than your little mickey mouse can scream. Enjoy the couple bucks left before the nose dive. You don't want to be on a Boeing plane anyway, they have a habit of crashing and going up in flames.

BA LONGNYSE:BA
At the support zone, we got the two bottom pattern in D1 , at W1 the second bottom create morubozu candle
=> Long time!!

Huge drop coming For those that need a reason. They need news. Hundreds of flights being cancelled a day. Boeing has a far fall to take. Investors be patient. Day traders. Well good kick making Chunp change. Investors who control the market be patient. Boeing will be in the clearance aisle in the coming months.


DOOMIN RNNot really much to say here...outlook is quite bearish until proven wrong, Everything probably looks cheap in markets to people who have got in recently let's see how long that lasts.

BA headed to 170 in the next couple of weeks Been a slow short since dropping below 200 but that's because of the oversold conditions on the weekly. closed beneath 193 fibonacci level that's been holding it up that last month. In the next couple weeks I expect new travel restrictions on Europe because the increasing cases over there and pending lockdowns. I think we will be headed to 170 within a month.

BA Bearish Trend AnalysisLooking for a retracement to the 203.58 area before taking an entry to the short side

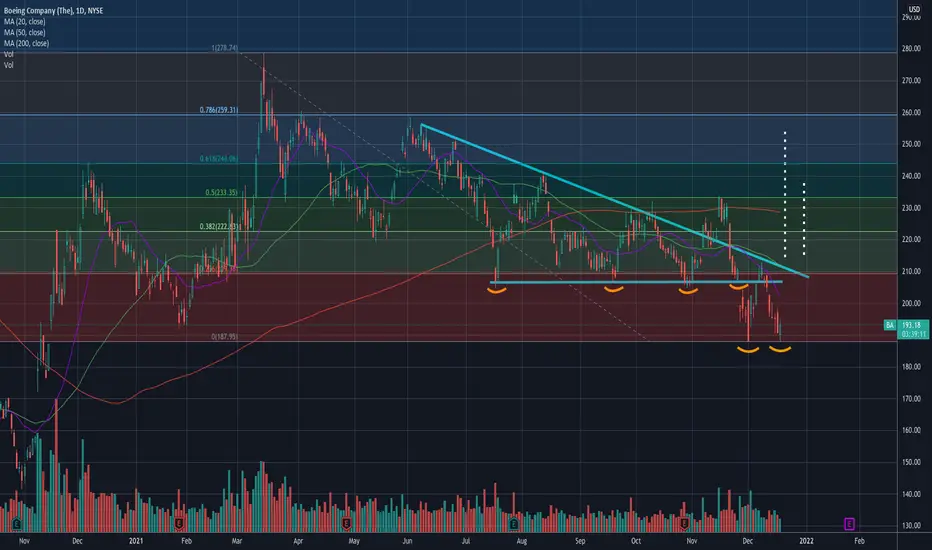
$BA - Double bottom?Boeing looking like double bottomed! If the price can reverse and break above $212 will be bullish and considered double bottom is confirmed.
Target 1 - $212
Target 2 - $235
Risk - price fall below $188 or failed to break above $212.
———————————————————
How to read my charts?
- Matching color trend lines shows the pattern. Sometimes a chart can have multiple patterns. Each pattern will have matching color trend lines.
- The yellow horizontal lines shows support and resistance areas.
- Fib lines also shows support and resistance areas.
- The dotted white lines shows price projection for breakout or breakdown target.
Disclaimer: Do your own DD. Not an investment advice.
BA double bottom!divergence and bollinger bands tightening could be a great klong position for the long term since Boeing is a strong fundamental company!

boeing will crash soon too 150 dollar with classic analysis all trends were brouken and the target of BA WILL BE 150 TO restest down trend from the top

BA Descending Triangle Weekly Options PlayDescription
BA has been working this Descending Triangle from its post-covid crash high around 278. There was one false breakout to the upside on 15NOV, which I traded, related idea linked.
Descending Triangles are bearish in nature, and the implied move carries BA down to 137.
Intermediate supports are at 194, 179 and eventually 144.5.
The immense amount of short triggers I am getting in this market is alarming, indicating institutional liquidation has been going on since around JAN - FEB.
The "new strain scare" from last Friday shows a perfect of example of investors looking for excuses to sell, not reasons.
In reality, the market is not worth its current valuation.
Good News = Rising rates = bad for earnings = bad for stock market
And bad news is just bad news.
Long Put
Levels on Chart
SL > 205.8
PT : 179
*Stops based off underlying stock price, not mark to market loss
The Trade
BUY
12/31 180P
R/R & Breakevens vary on fill.
The long put is placed at a reasonable midpoint between current stock price and eventual price target utilizing available strikes. I do not expect BA to reach this price target in a month.
Manage Risk
Only invest what you are willing to lose

Boeing TurbulenceMy first trading idea on tradingview, the contents are for informational purposes only and do not constitute investment or trading advice. :)
A short opportunity for BA with the break of a descending triangle and price<ema50<ema100. A pullback to the baseline of the triangle was a great entry @ $209-210.
The current price of 196 still presents an opportunity to short with a profit target of $150, stop loss of $214 (slightly above the baseline), a risk-reward ratio of ~2.4. Will watch for resistance at 180, 165, and 150 demand zones and exit potentially on high volume.

Nice relative strength on $BA this morning... Nice relative strength on $BA this morning... the 200Cs had great OI! Already about tagged so a little caution now.
