BA - Boeing CompanyNYSE:BA
Idea is simple:
Long position from the current price ($207).
Stop - $204.66 (-1% risk)
Profit - first take approximately $216.5 (4.6% upside)
Profit/Risk - 4.6/1 = 4.6
Feel free to comment / add a feedback
BACL trade ideas

$baentre : after close 4 hour above 220 or exiting the channel
tp : 240 then 265
sl : close under 218

$BA working on a weekly bullish engulfing...Interesting day here, nice consolidation after the bounce at support. No real play yet, but could provide a decent lotto tomorrow

BOEING ANALYSISBoeing is in an interesting position here setting up for a nice break of the downtrend into a long if this all plays out.
We expect the downtrend to break and as soon as a close above the resistance is made we can long until the target!
Always be patient and wait for confirmation, Happy Trading!

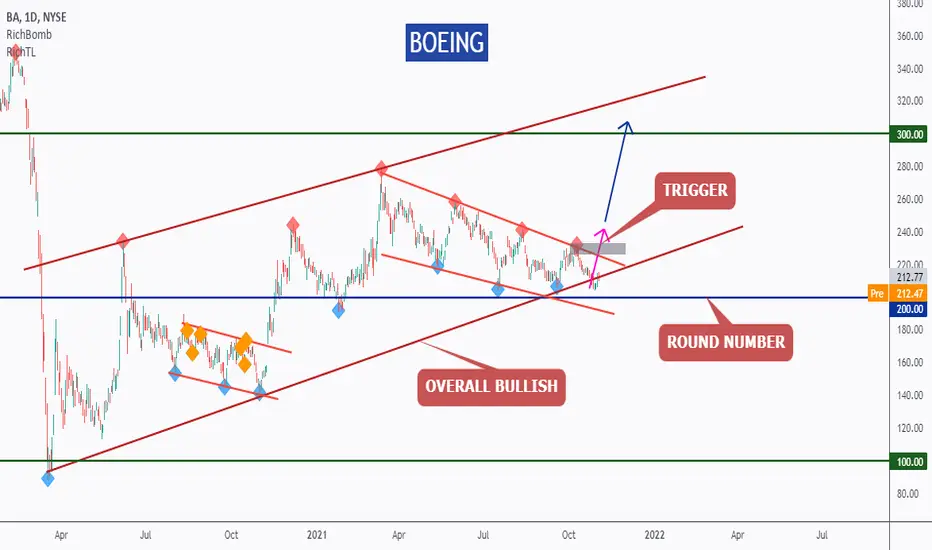
BOEING - Wait For The Trigger!Hello everyone, if you like the idea, do not forget to support with a like and follow.
BA is overall bullish, trading inside our brown channel and since it is retesting the lower brown trendline and round number 200.0, we will be looking for trend-following buy setups.
on DAILY: BA formed a valid channel in red , but it is not ready to go yet. Before we buy, we want the bulls to take over again.
Trigger => Waiting for a momentum candle close above the last high in gray to buy.
Meanwhile, until the buy is activated, BA would be overall bearish can still trade lower.
Good luck!
All Strategies Are Good; If Managed Properly!
~Rich
Boeing repetitive pattern LongIf we look at the analysis, I have tried to keep it simple. It is a prediction based on decent risk reward and a bounce from 214$ can take it to atleast 260 levels first.

BA - Nice bounce from support Zone.BA - Bounced from Support zone after earnings .
Very limited to risk to enter the position
Watch for the falling wedge break out and follow through day.

$BA is this for real?....Recovered where it needed to so far...if this is for real, we hit $220 this week, then try one more time to push out of this wedge...

Boeing taxiing on the runway once again..!This is a very important support level and could lead to a low-risk price action trade!
There is a good chance BA move to 225, however, if it broke below 24.60, it could go down to 190-195 level.
Entry: 206
Stop loss: 204.59 (190 long term)
Reward/Risk: 13.5
Target range: 225
Time Frame: 2-4 wks
Possible gain: 9.2%
Possible loss: 0.68%
Position size: 5 % of trading capital
Best,
Moshkelgosha
DISCLAIMER
I’m not a certified financial planner/advisor nor a certified financial analyst nor an economist nor a CPA nor an accountant nor a lawyer. I’m not a finance professional through formal education. The contents on this site are for informational purposes only and do not constitute financial, accounting, or legal advice. I can’t promise that the information shared on my posts is appropriate for you or anyone else. By using this site, you agree to hold me harmless from any ramifications, financial or otherwise, that occur to you as a result of acting on information found on this site.

LONG BA BIG 15+% returnsBoeing is poised to rally after a double bottom and multiple equity yields rising this has been observed in the past causing a median increase in price

$BA - calls above 209 | Puts below 202, expecting reversal$BA - watch for calls above 209 | Puts below 202 , currently holding support level and good bounce on friday close

BA trade Opportunity Ba has support around 207, Ba has also been trading In a descending triangle for a couple months as shown on the chart. On the 1 month chart there is a clear down trend and if BA goes over 2010 there is a very good chance it will head to 223.

$BA not holding today...Any long plays don't seem worth the risk at this point until it had a recovery day, looks ready to break here. We'll see

Finally alert signaled on BA, what now?BA finally on my watch list after hitting my box below the bottom of the trend. either this area holds and we begin to leg up higher toward 300 or we break below 204 and make our way toward 190. at this point best option here is to play leaps on BA and rest assured they will pay nicely. short term, neutral'; Long term, BULL!

$BA either we fail, or rebound hard...The last few times we tested this line, we had a nice rebound. The risk/reward is pretty good here...I am going to try an 11/19 $230 call at $0.82, will to risk it here. Could cover to the downside with an 11/19 $180 put at $0.49...set it and forget it

BA 2 Possible OutcomesAs much as Boeing sucks the company should remain bullish especially once an official rotation begins into aircrafts / travel.
This one is personally one of the tickers I rarely will ever trade and is nearly a no trade stock for me as it's irrational af . I believe the lvls to buy commons at are 194 , 160 .
Scooping up at these prices are amazing , 160 is only possible due to gap fill that may be there due to poor ER or even good ER .. who knows the stock does whatever it wants.
Expect 300 - 400 + in the long term for BA easily. Buy it, forget it.

BA triangle pattern on the daily chartPossible breakout from the triangle by BA.
Entry: 212
Target: 270
Stop-loss: 208
Period: 3-4 months
Position: 5% of capital

Boeing LongTriangle pattern near to be broken, it could go down too but the rejected supports make me think that the break will be up

BOEING COMPANY - $400 targetBoeing Forecasts Africa’s 20-year Commercial Aviation Market Opportunity Valued at Nearly $400 Billion
Boeing forecasts that Africa’s airlines will require 1,030 new airplanes by 2040 valued at $160 billion and aftermarket services such as manufacturing and repair worth $235 billion, enabling growth for air travel and economies across the continent. Boeing shared the projection as part of the 2021 Commercial Market Outlook (CMO), the company’s long-term assessment of demand for commercial airplanes and services.
Higher Commercial Deliveries to Aid Boeing (BA) Q3 Earnings
The Boeing Company is set to release third-quarter 2021 results on Oct 27, before the opening bell.
In the last reported quarter, the company delivered an earnings surprise of 161.54%. Massive commercial deliveries might have offset unchanged defense deliveries, which, in turn, are expected to have boosted Boeing’s performance in the third quarter.


$BA if it can pop above 225$BA post earnings if it can pop above 225 and close above it, we are going to see 250+ in coming week or so on it. #PlanYourTrades

BoeingI’ve been following BA for a while and the it is getting very close to a triple bottom at 206 -204 range. This has happened several times before. I’m looking for an in entry at this level.

$BA - Hourly Falling wedge to demand zone, watch for breakout$BA - Hourly Falling wedge forming, watch for breakout for calls or break below demand zone for puts, also seeing some bullish RSI divergence
