BA Boing still going down. This is my channel on boeing. its still going down. there is some small areas of consolidation on the 1 hr chart But it is still going down. Maybe a good options play to the down side. you could trade in the channel. we will see what happens.
BACL trade ideas

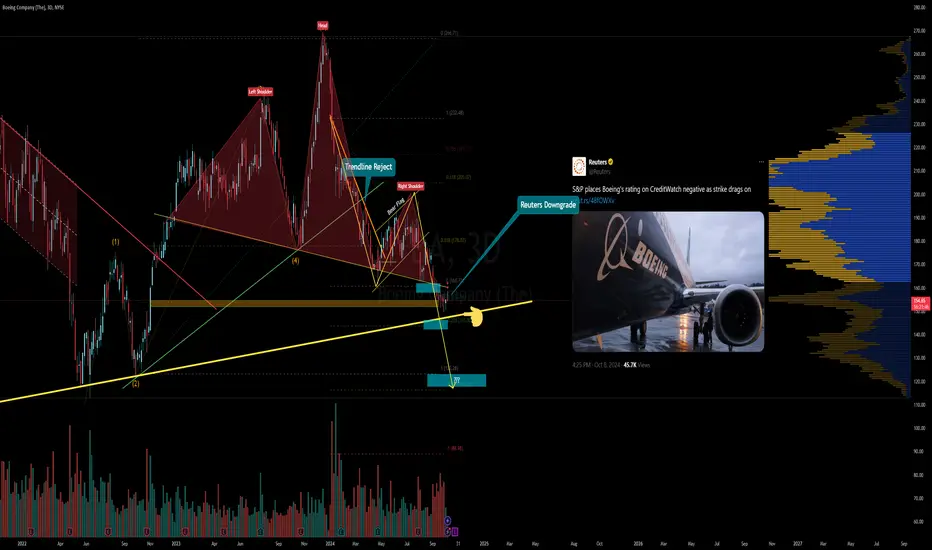
BOEING, TIME TO FLY AGAIN BIRDIE (MONTHLY CHART)BA bulls got shafted from the double top sell off at 265.
It is now breaking down through the monthly bull trend support. It is hanging on for dear life before the drop to $120.
rumors of BA having to dump shares to raise capital for the strike would be a great bargain for dip buyers.
Forgot if it was Peter Lynch or Munger. Maybe Howard Marks - one of them said one of the best deals is when someone is forced to give up shares, that is the best time to come in.

BA - Just a sneeze awayBA is on a thin ice here, just a sneeze away and breaks the bottom to touch 120's
I'm not trading this, this is a very volatile name with so many news events every other day.
Worst planes, best stock! Boeing.Based on 21 Wall Street analysts offering 12 month price targets for Boeing in the last 3 months. The average price target is $206.11 with a high forecast of $240.00 and a low forecast of $110.00. The average price target represents a 31.92% change from the last price of $156.24.

BA LONGPotential falling wedge and multi-year trend line confluence, good spot R:R for a long to target 173.25 as a first stop and attempt to breakout. If 173 clears we can target 50dsma and 200dsma above at 192-197.
Long setup is void below the blue line unless there is a FBD with a wick that forms rapidly.


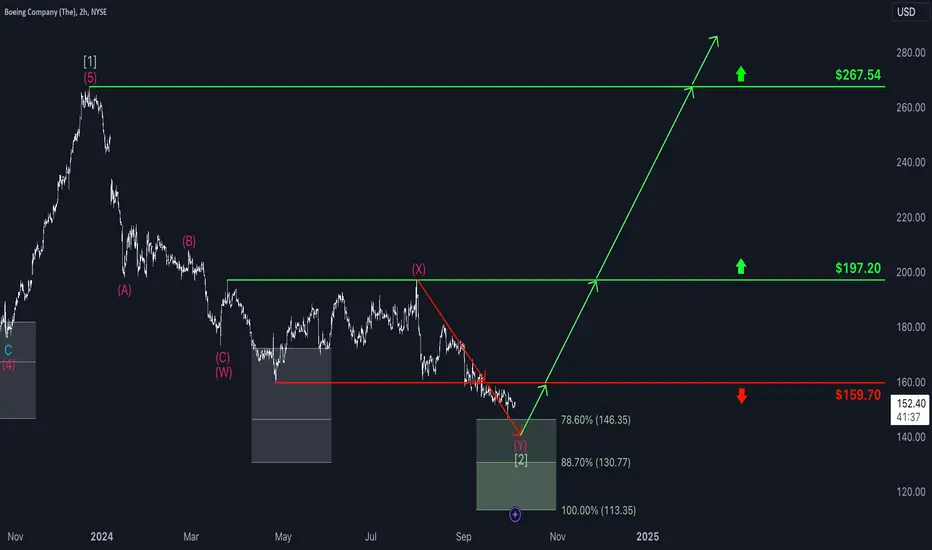
Boeing: Taking Off?Boeing continued its decline recently, moving steadily toward our green Target Zone ($146.35 – $113.35). Just this Tuesday, the price reversed only $0.23 above our Zone. While it’s technically possible that the stock has already established the low for wave (2) in green with this dip, we aren’t convinced. So, we expect another pullback soon, with the stock eventually landing within our Target Zone.
Boeing (BA) Shares Hover Near Two-Year LowBoeing (BA) Shares Hover Near Two-Year Low
Despite the S&P 500 index (US SPX 500 mini on FXOpen) rising roughly 20% since the start of 2024, Boeing (BA) shares are currently around the psychological level of $150 – a low last seen in autumn 2022.
Several factors have driven bearish sentiment for Boeing in 2024:
→ Reputational setbacks due to technical issues, including helium leaks and engine malfunctions on the Starliner spacecraft intended for astronaut transport to the ISS.
→ Boeing has struggled to meet its aircraft delivery targets, and it reported significant financial losses in Q2 2024, with earnings per share nearly halving forecasted estimates, further impacting investor confidence.
→ Fines from the U.S. Department of Justice, worker strikes, and other operational challenges have compounded issues.
Technical analysis of Boeing’s (BA) chart reveals:
→ In 2024, the share price has formed a downward channel (marked in red), with the Resistance 2 trendline suggesting that bearish sentiment could intensify.
→ The price hovers near the channel’s lower boundary, potentially supported by the $150 level.
This positioning might prompt bulls to attempt a breakout above Resistance 2, possibly replicating the pattern seen after the Resistance 1 break in May 2024.
Otherwise, a drop below $150 would indicate intensified bearish pressure and underline Boeing's fundamental challenges.
What’s Next?
Analysts remain optimistic about Boeing’s (BA) prospects. According to TipRanks, the average forecast for Boeing’s share price is over $200 within the next 12 months.
This article represents the opinion of the Companies operating under the FXOpen brand only. It is not to be construed as an offer, solicitation, or recommendation with respect to products and services provided by the Companies operating under the FXOpen brand, nor is it to be considered financial advice.

BA - LongMean Reversion Trade - Ticker: NYSE:BA (Long)
Setup:
Mean Reversion Trade (Long)
Key Criteria:
1. Price has tested a prior breakout/breakdown level, 15+ day pivot in price, or monthly/weekly Fair Value Gap (FVG).
2. Market Cap is above $10 billion.
3. Price swept highs, closed lower, with a gap between the open and the previous candle close.
Specifics for NYSE:BA :
* Market Cap: $95 Billion
* Relative Volume: 1.21
* Technical Levels: $150.00
* Technical Setup: Mean reversion trade based on weekly fair value gap fill, increased relative volume, price closing above VWAP.
Trade Details for NYSE:BA :
* Position: Long
* Entry Price: $154.50
* Stop Loss: $149.50 (below daily pivot)
* Risk per share: $5.00
* Risk: 1% of account equity
* Order Type: Buy Stop Order
Targets:
1. Target 1: $160 (1.2R) — Based on daily range.
2. Target 2: $167 (2.50R) — Based on weekly pivot level.
3. Additional Target: $173 (3.84R) — The full gap fill level.
Exit Techniques:
1. Scale out 33% at Target 1.
2. Scale out another 33% at Target 2.
3. Exit the remaining 34% based on a "Reason2Sell" approach:
* Price Reversal Patterns: Double tops, head and shoulders, falling wedges.
* Overbought Conditions: RSI exceeding 70.
* Negative Divergence: Price makes a new high, but technical indicators don’t confirm.
* Support Level Breakdown: Price breaking below significant support levels.
* Increased Volatility: Sudden surge in volatility or trading volume indicating selling pressure.
* Volume Nodes: Observe price action around liquidity points.
Reasoning:
The technical signal is clear: the price has tested a key weekly/monthly level and shown strong buying throughout the day, closing above both the VWAP and the prior day’s low. This signals a potential reversal and gives strength to the mean reversion trade idea.
1. Stock Sale Impact:
Boeing recently announced a $10 billion stock sale, but the actual sale won’t occur for at least a month. This means there’s a clear trading window of about 20 days where the stock isn’t immediately impacted by dilution concerns, giving us time to capitalize on this technical setup.
2. Earnings Timing:
Boeing's earnings are scheduled for October 23rd, which leaves exactly 15 trading days before the report. The strategy is to exit before earnings to avoid excess volatility, and this window aligns with the mean reversion trade thesis.
3. ATR and Tradeable Range:
With an ATR of $5.00 over the last 15 bars, the stock has a well-defined trading range that supports targeting the $160 and $167 levels. The ATR gives a reliable measure of daily movement, allowing for precise entry and exit planning within this mean reversion setup.
4. Defense Sector Strength:
Boeing (BA) is a key player in the defense sector, and with Lockheed Martin (LMT) and Northrop Grumman (NOC) holding strong while Boeing has slid, it’s worth noting the possibility that geopolitical tensions (e.g., the Israeli-Iran conflict) could boost BA’s involvement and add fundamental strength to the trade. The stock has been underperforming its peers, and this divergence signals a potential for a dead cat bounce or reversal.
5. Options Flow Conviction:
Recent options flow data from October 1st shows significant interest in out-of-the-money call options at strike prices of $170 and $175, with expirations from November 2024 to January 2025. The fact that these contracts are trading at premiums of 98%-100% suggests that large players in the market are positioning for a bullish move in Boeing. This aligns with the technical setup and signals institutional conviction behind a potential bottom being formed.
Stop Loss Strategy:
* Adjust the stop loss after Target 1 is hit, scaling out shares accordingly.
Additional Notes:
* Set automatic scaling for profit-taking as targets are reached. Manage your risk if the full position remains after targets are hit.
* Feel free to ask for any clarification or additional support.

Boeing TurnaroundOnce again, charting a simple RSI divergence and forecast a short-term turnaround for BA

Boeing secured five new and modified Defense contracts worth ...... Worth at least $8.46 billion, including a $6 billion deal for small diameter bombs and a $1.68 billion contract for C-17 Globemaster III support...
When ... MOOOOOOONN.... ????

BA LONGBullish divergence here on weekly and possible falling wedge
looking for longs above 143 to revisit 194.
long is void below 143.

BA is far from over It just broke out of a bear flag formation.
If 160 level fails to hold, this can see 142 and 116 quick.
Possible sub 100 level if rest of the market drops.
Target #1 - 160
Target #2 - 142
Target #3 - 116
The Infamous Boeing: Accidents Weight on PriceThe Infamous Boeing: Accidents Weigth on Price
Dear Esteemed Members,
Boeing’s stock price has also dropped by 8.5% since Monday after a plane had to make an emergency landing after a part of its fuselage ripped off mid-air. Another plane was grounded after a window fell out during takeoff. Alaska Airlines decided to inspect all Boeings.
The competition from Airbus, which has secured a deal with the US Air Force to provide 20 A330 Multi Role Tanker Transport aircraft for $3.5 billion. This deal could give Airbus an edge over Boeing in the military aviation market, and also boost its reputation and revenue.
Kind Regards,
Ely

Boeing Approaching Critical Support: Will $150 Hold or Break?Hey fellow traders,
Boeing ( NYSE:BA ) is facing some turbulent times both fundamentally and technically, and all eyes are on the charts to see what happens next. Let’s break it down.
After a series of tough news — including a machinist strike and warnings about a potential credit downgrade — Boeing has seen a sharp drop, falling nearly 4% on Friday alone. This brings the stock down to $156.77, close to a two-year low. But that’s not the full story; we’re approaching a pivotal level that could make or break Boeing’s near-term future.
What’s Happening on the Charts?
Downtrend Dominance: Boeing’s been in a consistent downtrend, with a well-established trendline that’s been pushing the price lower for some time now. Each time the stock tries to break through, it’s met with resistance. We’re getting close to testing that support again.
$150 Key Support: The price is closing in on $150 — a level that’s acted as a strong support in the past. This is the line in the sand, and a lot of traders are watching closely. Will it hold, or are we headed for further downside?
Possible Scenarios Ahead
Bullish Case: If Boeing finds support at $150, we could see a short-term bounce. The next logical target would be back to the $170-$175 range, which lines up with that downward trendline.
Bearish Case: On the flip side, if $150 breaks, things could get ugly. Given the current sentiment, we might be looking at a sharper drop, with $130 as the next potential support area.
Volume Will Tell the Story
One thing to keep an eye on is volume. If we start seeing increased selling pressure, it would confirm the bears are in control. Right now, the fundamentals (negative news, cash burn, strike) are aligning with the technicals — a dangerous combination.
Final Thoughts Here
Whether you’re bullish or bearish, the next few days could provide some interesting opportunities. If $150 holds, we might see some relief, but if it breaks, it could signal much bigger downside potential. Let me know what you think! Will Boeing bounce or break?

Boeing Faces Major Setback as Workers Vote to StrikeBoeing Co. (NYSE: NYSE:BA ) is once again facing turbulence, but this time, it's not related to its planes or production flaws. Thousands of Boeing factory workers have overwhelmingly voted to strike, rejecting a tentative contract agreement, sending shockwaves through the aerospace sector. The strike could have substantial financial consequences, not only for Boeing but also for airlines, suppliers, and the broader industry. Here’s an in-depth look at the technical and fundamental aspects of Boeing's current situation.
Union Discontent and Financial Repercussions
The decision by Boeing workers to strike, voting 96% in favor, comes after rejecting a contract that offered a 25% wage increase over four years and a commitment to invest in the Puget Sound region. The workers, represented by the International Association of Machinists and Aerospace Workers (IAM), found the deal insufficient, especially against the backdrop of Boeing’s previous issues and ongoing recovery efforts.
Key Factors:
- Financial Strain: Boeing has been struggling with production delays, safety concerns, and a staggering $60 billion debt load. A prolonged strike could worsen these issues, especially if it drags out as the 2008 strike did, costing Boeing $100 million per day.
- Impact on Operations: The strike affects Boeing’s major assembly plants on the West Coast, including Seattle and Portland. This could disrupt the production schedule of key models like the 737 MAX, already under scrutiny by regulators.
- Market Response: Boeing's stock is down 36% year-to-date, reflecting investor concerns over ongoing financial strains and potential production disruptions. With the strike, there is a real risk of further downgrades by rating agencies, putting additional pressure on Boeing’s credit standing.
Technical Outlook
Technically, Boeing’s stock is already on shaky ground, having been in a downward trend for most of the year. The strike news has pushed the stock further down, trading near its lowest levels since November 2022.
Technical Indicators:
Boeing's shares fell around 3% early Friday, breaking below key support levels as the market digested the strike news. The stock is now trading near $180, a critical psychological and historical support zone. A dip below the critical support of $126 will lead to massive sellout as it stands as the major building block holding Boeing (NYSE: NYSE:BA ) stock.
The stock has been trading well below its 50-day and 200-day moving averages, a bearish signal that indicates ongoing downward momentum. A death cross pattern was recently confirmed, suggesting further downside risk.
The Relative Strength Index (RSI) remains oversold, hovering around 40, indicating that while the stock is heavily beaten down, it could still see further selling pressure. The MACD is also trending negative, reinforcing the bearish outlook.
What’s Next for Boeing?
As Boeing (NYSE: NYSE:BA ) navigates these troubled waters, the outcome of the strike negotiations will be crucial. The company has expressed its willingness to return to the table, but workers are holding firm on their demands. For investors, the key will be to monitor any updates regarding the length and impact of the strike, especially on Boeing's production capabilities and financial outlook.
Boeing’s challenges are emblematic of broader issues in the aviation industry—supply chain disruptions, rising costs, and workforce discontent. A prolonged strike could set Boeing back in its recovery efforts, delaying production and hurting its reputation further. For now, the market is on edge, watching closely as Boeing seeks to balance financial prudence with the demands of its workforce.
Investor Takeaway
Boeing (NYSE: NYSE:BA ) remains a high-risk stock in the near term due to the ongoing strike and financial uncertainties. Investors should be cautious and consider the potential for further declines if the strike continues. Key technical support levels and the company’s ability to resolve union disputes will be critical factors influencing Boeing's stock performance in the weeks ahead.
While the long-term outlook for Boeing (NYSE: NYSE:BA ) remains tied to the broader recovery of the aviation industry, the current scenario presents significant short-term headwinds. Navigating these challenges successfully will require careful negotiation, strategic decision-making, and, most importantly, a commitment to restoring the trust of both its workforce and investors.

BA - when to buyhi Traders,
Let's have a look at BA stock on 1D time frame.
BA stock doesn't look good here.
The price has been in a down-trend and it's likely to continue this trend.
Buy zone: 114 $- 124$
Mid-term Target: 267

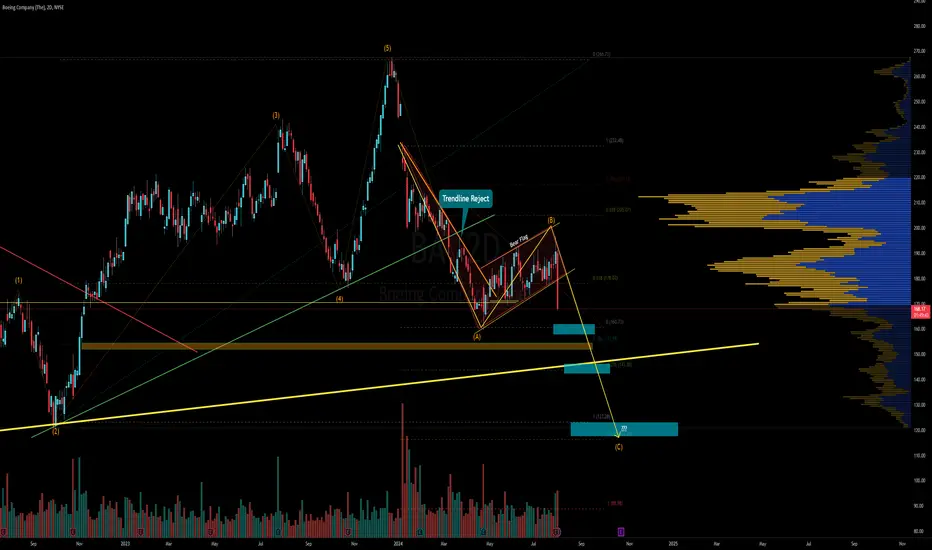
BA, buy the dip candidate, but still choppy futures ahead. after breaking out monthly descending wedge and hitting $265 high, we are now at the 200MA around $160.
stock will likely chop in the highlighted triangle.
very choppy from 160-190.
still choppy from 194-265.
it is at the buy the dip zone. it is now at the breakout level at ~160 from the december 2022 highs that led to 1 year rally up to 265.

Boeing Co(Extended Hours) | Chart & Forecast SummaryKey Indicators on Trade Set Up in General
1. Push Set Up
2. Range Set up
3. Break & Retest Set Up
Active Sessions on Relevant Range & Elemented Probabilities;
* Asian(Ranging) - London(Upwards) - NYC(Downwards)
* Weekend Crypto Session
# Trend | Time Frame Conductive | Weekly Time Frame
- General Trend
- Measurement on Session
* Support & Resistance
* Trade Area | Focus & Motion Ahead
# Position & Risk Reward | Daily Time Frame
- Measurement on Session
* Retracement | 0.5 & 0.618
* Extension | 0.786 & 1
Conclusion | Trade Plan Execution & Risk Management on Demand;
Overall Consensus | Sell

Wells Fargo Downgrades Boeing Amid Debt Woes and Delayed GoalsBoeing (NYSE: NYSE:BA ), once a stalwart of American industrial might, faces significant challenges that have cast a shadow over its future prospects. The aerospace giant's financial woes have worsened as Wells Fargo recently downgraded its stock to “underweight,” slashing the target price to $119—a staggering 32% downside from its last closing price. Here's a deep dive into both the fundamental and technical factors that are driving Boeing's troubles.
Mounting Debt and Delayed Cash Flow Goals
Boeing's financial health is under severe strain as the company grapples with a massive net debt of approximately $45 billion. The debt crisis stems from a series of setbacks, including safety scandals, regulatory curbs on its 737 MAX production, and ongoing supply chain disruptions. As Wells Fargo analyst Matthew Akers notes, Boeing's annual free cash flow (FCF) target of $10 billion, initially projected for 2025-26, now looks unachievable until at least 2027-28.
To get back on track, Boeing (NYSE: NYSE:BA ) needs to address its towering debt load before it can consider launching new aircraft development—a critical factor for maintaining market competitiveness against rivals like Airbus (AIR.PA). Wells Fargo estimates that Boeing may need to raise $30 billion in equity to zero out its net debt by 2027, a move that would likely dilute current shareholders. The company's cash flow will remain constrained through 2030 as it prioritizes debt reduction over growth initiatives.
Further complicating matters, Boeing's strategic decision-making is under scrutiny. While deferring the launch of new aircraft could help stabilize cash flow, it risks losing market share to Airbus, which continues to dominate in the commercial aircraft space. A scenario where Boeing focuses solely on debt repayment could lead to stagnation, potentially ceding ground to competitors in the long term.
Technical Analysis: Breaking Below Key Support Levels
From a technical standpoint, Boeing's stock price has been in a downward spiral, exacerbated by the latest downgrade. Shares plunged over 7% on Tuesday, hitting their lowest intraday level since November 2022. The stock is currently trading below all key moving averages, indicating a strong bearish trend. The Relative Strength Index (RSI) stands at 34, signaling that NYSE:BA is oversold but not yet showing signs of a potential reversal.
The current price action suggests that Boeing could be headed for even lower levels, with the next major support zone around $149. A break below this level could trigger further downside, with limited immediate catalysts to inspire a rebound. The stock's downward trajectory has been punctuated by a series of lower highs and lower lows, a classic indicator of a sustained bearish trend.
Investors should be wary of Boeing's chart, which offers little optimism in the near term. The lack of institutional buying interest and consistent downward pressure point to a potential retest of critical support areas. Moreover, recent volumes have been thin, underscoring a lack of confidence among major players in the market.
A Long Road to Recovery
Boeing's path to recovery is fraught with challenges. The combination of staggering debt, delayed cash flow targets, and potential shareholder dilution paints a bleak picture for the company's near-term outlook. Fundamentally, Boeing needs to address its debt woes and regain investor confidence, while technically, the stock faces significant resistance levels that may cap any upward momentum.
For investors, NYSE:BA currently spells caution. The stock's inability to find a firm footing amid a series of bearish headlines suggests that Boeing's turbulence is far from over. Unless there is a substantial shift in the company's strategy or market conditions, the stock may continue to face downward pressure, making it a risky bet in an already volatile market environment.

Boeing Faces Another Setback: Cracks Discovered in 777X JetlinerBoeing's turbulent year continues as the aerospace giant confronts yet another major issue. During initial test flights of its cutting-edge 777X jetliner, Boeing (NYSE: NYSE:BA ) discovered cracks in a critical structural component, adding to a growing list of setbacks for the company.
The Discovery
The cracks were identified during routine inspections following test flights in Hawaii. The affected component is the thrust link, a crucial part that connects the plane’s massive engines to the airframe. This link, made from heavy-duty titanium, is unique to the 777X and integral to the aircraft's overall integrity. The discovery of these cracks has forced Boeing to ground its entire 777X test fleet as engineers work to replace the faulty parts and analyze the root cause.
A Boeing (NYSE: NYSE:BA ) spokesperson commented, "During scheduled maintenance, we identified a component that did not perform as designed. Our team is replacing the part and capturing any learnings from the component and will resume flight testing when ready."
Financial and Reputational Impact
This latest incident comes at a time when Boeing (NYSE: NYSE:BA ) is already struggling with several other crises. The company’s stock has plummeted more than 30% this year, largely due to a series of safety and mechanical failures. Earlier in January, a door plug detached mid-flight from a Boeing 737 MAX 9 operated by Alaska Airlines, prompting the Federal Aviation Administration (FAA) to ground expansion plans for the 737 MAX.
The 777X, Boeing’s most advanced commercial aircraft, was initially slated to enter service in 2020. However, due to increased regulatory scrutiny and ongoing safety concerns, this date has been pushed back multiple times, now tentatively set for 2025. The latest discovery of cracks in a key component could delay the 777X's entry into commercial service even further, exacerbating Boeing’s financial woes.
The Bigger Picture
This incident is the latest in a string of safety concerns that have plagued Boeing in recent years, starting with the tragic crashes of two 737 MAX aircraft in 2018 and 2019. Those crashes, which claimed the lives of 346 people, triggered a global grounding of the 737 MAX fleet and resulted in Boeing agreeing to a $243.6 million fine and a three-year probation period as part of a plea deal with the U.S. Department of Justice.
In light of the new issues with the 777X, Boeing’s reputation is once again under scrutiny. The company, which once held an untarnished reputation for safety and innovation, is now viewed with increasing skepticism by regulators, airlines, and the flying public.
Technical Outlook
Boeing's (NYSE: NYSE:BA ) stock experienced a 4.2% decline at the close of Tuesday's trading session, and its Relative Strength Index (RSI) indicates an oversold condition at 46. Moreover, the stock is currently trading below the 50, 100, and 200 Moving Averages (MA), signaling a strong bearish trend. A bearish harami candlestick pattern is visible on the daily price chart, further indicating downward pressure. It's apparent that Boeing (NYSE: NYSE:BA ) has undergone a series of price corrections and has been confined within a falling wedge pattern for some time now. A potential bullish signal could occur if the stock manages to surpass the 200-day MA, signaling a potential reversal in trend.
Looking Forward
As Boeing (NYSE: NYSE:BA ) works to resolve the cracks in the 777X, the company faces significant challenges ahead. Not only must it address the technical flaws in its latest aircraft, but it also needs to restore confidence in its ability to deliver safe and reliable planes. With the aviation industry closely watching, Boeing’s next steps will be crucial in determining whether it can recover from this series of setbacks or if it will continue to struggle in the years to come.
For investors, the situation remains precarious. Boeing shares (NYSE: NYSE:BA ), which have already suffered steep declines, could face further downward pressure if the 777X’s issues lead to additional delays or safety concerns. The company’s ability to rebound from this latest mishap will depend on its response to the crisis and its capacity to regain the trust of both regulators and the public.

$BA is ready to fly
NYSE:BA at critical juncture. Bouncing off support at $169.85, eyeing resistance at $175.46. YUSUKE alert: $187.50 Call for 08/23/2024. Bullish divergence on weekly chart suggests potential upside. Watch for break above descending trendline. #BoeingOptions #TechnicalAnalysis
Boeing (BA) is currently at a pivotal point technically, with several key levels and patterns emerging across multiple timeframes.
Key Technical Levels:
- Support: $169.85
- Resistance: $175.46, $191.17
- Current Price: Around $170 (based on chart)
Weekly Chart Analysis:
The weekly chart shows BA forming a potential bullish reversal pattern. The stock has been in a downtrend since early 2019, but recent price action suggests a possible trend change:
1. Long-term descending trendline resistance around $205-$210.
2. Potential inverse head and shoulders pattern forming, with the neckline at the descending trendline.
3. Bullish divergence on momentum indicators (not shown, but implied by the chart structure).
Daily Chart Analysis:
The daily chart provides a closer look at the near-term price action:
1. BA is currently testing the $169.85 support level.
2. The stock is trading below its descending 50-day moving average, indicating short-term bearish sentiment.
3. Immediate resistance at $175.46, with further resistance at $191.17.
4. The stock is near the lower boundary of its recent trading range, suggesting a potential bounce.
Options Flow Alert:
The YUSUKE alert system has detected notable call option activity for BA:
- Contract: $187.50 Call expiring 08/23/2024
- Expiry: Over 1 year out, suggesting a longer-term bullish outlook
This options activity indicates that some traders are positioning for potential significant upside in BA over the next year. The strike price of $187.50 is well above the current stock price and even above the immediate resistance levels, suggesting an optimistic outlook.
Conclusion:
Boeing's stock is at a critical juncture. The long-term chart suggests a potential bullish reversal if the stock can break above the descending trendline. In the near term, the stock is testing support and could see a bounce. The options flow adds weight to the bullish case.
However, investors should be cautious. Boeing faces ongoing challenges with its 737 MAX program and broader industry headwinds. A failure to hold the $169.85 support could lead to further downside.
Key levels to watch:
- Bullish scenario: Break above $175.46, then $191.17
- Bearish scenario: Break below $169.85, with next support at $162.92
As always, combine this technical analysis with fundamental research and manage your risk appropriately.

BA - Boeing: many gaps to fill above...Trading at 72% below our estimate of its fair value
Earnings are forecast to grow 80.87% per year
Trading at good value compared to peers and industry
Analysts in good agreement that stock price will rise by 31.7%
