COST trade ideas

Costco Makes a Lower HighCostco ran to new highs in late December, but this year it’s been under pressure.
The warehouse retailer slid 11 percent in January – its sharpest monthly drop since December 2018. It then retraced about half the decline to make a lower high last week. Notice how the high not only consisted of an abandoned shooting-star candlestick. It also occurred at the 50-day simple moving average (SMA).
Speaking of the 50-day SMA, this chart includes our custom script Moving Average Speed highlighting its direction and rate of change. The last time it fell like this a year ago, COST had a deeper retest.
Given that history and the stock’s healthy gains in later 2021, some traders may view the recent price action as the start of an ABC correction. Will they also focus on the October low around $440 as the next likely support?
TradeStation is a pioneer in the trading industry, providing access to stocks, options, futures and cryptocurrencies. See our Overview for more.
Important Information
TradingView is not affiliated with TradeStation Securities Inc. or its affiliates. TradeStation Securities, Inc., TradeStation Crypto, Inc., and TradeStation Technologies, Inc. are each wholly owned subsidiaries of TradeStation Group, Inc., all operating, and providing products and services, under the TradeStation brand and trademark. When applying for, or purchasing, accounts, subscriptions, products and services, it is important that you know which company you will be dealing with. Please click here for further important information explaining what this means.
This content is for informational and educational purposes only. This is not a recommendation regarding any investment or investment strategy. Any opinions expressed herein are those of the author and do not represent the views or opinions of TradeStation or any of its affiliates.
Investing involves risks. Past performance, whether actual or indicated by historical tests of strategies, is no guarantee of future performance or success. There is a possibility that you may sustain a loss equal to or greater than your entire investment regardless of which asset class you trade (equities, options, futures, or digital assets); therefore, you should not invest or risk money that you cannot afford to lose. Before trading any asset class, first read the relevant risk disclosure statements on the Important Documents page, found here: www.tradestation.com .

COST dead cat bounce nearing the endCOST bounced nicely off oversold zone but now seems to be stalling. Volume profile at 527 is proving difficult to get past. Level to watch is a close below 514. Will quickly see it retest its breakout zone at 495. Will have to wait to see what it does at 495 if we get there.

cost long from 468Costco found support at the previous resistance area at 468. A nice bounce occurred on friday and we got a move up today.
only look for long positions on a retracement.

C&H COST on dailyCup and handle on costco.
I believe a possible swing trade is presenting itself here in costco.
I like this company long term as well.
The 50 sma is acting as the resistance right now.
Pt: 529,546,571

$COST - Staples 2/10Costco is the 2022 top pick representing 2.3% of the portfolio. Not a lot of faith in the staples sector for sure with it representing such a small part of the 2022 top pick portfolio. The only concern I have is if it hit that gap above and then started trend lower. Another concern would be a double top but there would be nice profits secured if that happened anyways. Costco has been a beast these last couple years and its e-commerce trend is still favorable. I like it.

Cost is long. toward 493Target 1 is 493 after testing the support on 466, it is going up toward 493
the next target will be 519
In my opinion, can be reached gaols in the next two weeks.

Long on COSTLong on COST if it bounces up at 469.5. RSI rebounding from lower bounds with MACD converging. Positive price/indicator divergence on 2h and 4h time frame. Stop loss right under 469.

COST daily470 area held, this demand zone look like a nice buy area keep it on your radar. Oversold defensive stock, good for portfolio diversification with the current economic environment.

Equity Markets1.22.22 Looking at TTD, Costco, Nvidia, and other markets that we have looked at in the past.

On my long/calls watchlist if we bounce here ✅cost holding above recent trend resistance even after the most recent dump, also looking like a double bottom bounce off a recent monthly candle.
this could be the short term bottom for COST, look for a move back to highs if it bounces here.
like and follow for more 💘

COST 1/11/2022Costco the heavyweight. One of the stocks that holds up NASDAQ
Daily Chart analysis
COST has been and a long-term uptrend since 2010 – 2011.
Price is current just below 50ema . It has also found support around area 514.
Today it looks like we will be finishing the day with a dragonfly doji at support.
Stochastic is also in oversold status
I will be looking to enter long and swing trade to 560.
Entry: 518.70
Stoploss: 500
Target: 560

COST SELL UPDATE.COSTCO is forming a ending diagonal on the higher tf. i would be looking for sell opportunities on costco.

Long $COSTGotta long the best grocery chain when the chart looks like this. Costco has been a monster and hoping for the run to continue after bouncing off this trend line here.

COST: Long BiasThe price still trading in the trend. Price might bounce at the channel support and continue its trend.

Be Safe if Buying PullbackI am not sure COST will surpass this high in the next few weeks or months. You may feel certain it will and we are all different.
I just know I am not buying this pull back.
If you are buying this pullback for a long term hold, I wish you luck as you are a braver soul than I am.
But many people are probably braver than I am.
Goodnight and no recommendation

Be Safe// Earnings12-9 AMCPossible Parabolic Arc.
This could still go higher. There is no rhyme or reason to this pattern. Eventually these do fall when the music stops. Arcs can be a long term pattern. Earnings are tomorrow after market close.
This chart is on a weekly timeframe.
Parabolic Arc chart patterns form with a steep rise in prices caused by irrational buying and intense speculation.
Irrational buying in the public generates a strong rally to push prices vertically, followed by a steep sell-off.
The Parabolic Arc is a reversal pattern and has a very predictable outcome. Although these patterns are predictable, they are relatively difficult to trade since the market sentiment is bullish.
The average eventually fall in the range of 62 to 79%, but can fall less or even more. The first target is usually the 50% level. An arc is not formed overnight and usually does not fall overnight either. It can be a slow process and this one may not be finished going up in price yet.
Parabolic Arc patterns consist of both panic buying on the way up and panic selling on the way down. As a stock breaks out and starts to rise, investors tend to feel its rising cycle is never going to end and build confidence based on hysteria. In the state of a rising Parabolic Arc, the price continues to rise without much of a pause and (or) with a series of upside gaps. This can be a long term pattern and is volatile as a rule on the way down.
The parabolic arc is definitely priced for perfection, and any negative news, or sheer greed, can send the security down.
What goes up, must come down, eventually.


Rising Wedge with Bearish Divergence on the MACDLooks like we may get a pullback from the highs here off the Bearish Divergence on the MACD and the impending overbought condition on the RSI at the top of this Rising Wedge Pattern.

cost toppingseems to be forming a rising wedge with timing aligning it up into that 113 i would ideally like to see it tap that and start to break the bottom trend line to bring it down, Nice divergences setting in as well
not financial advice


COSTNice uptrend since December, 21. Bullishly out of a minor downtrend. I expect it to enter 600s this year.

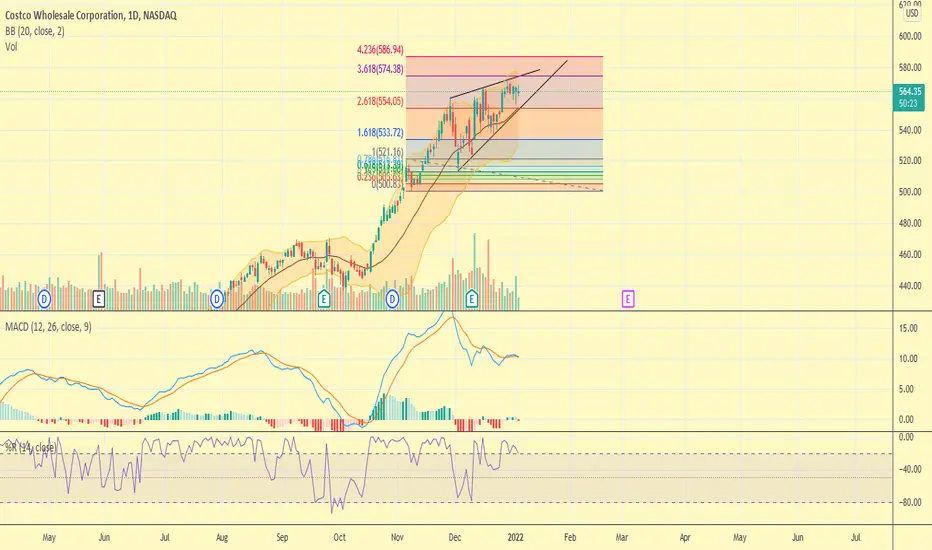
Short COSTCostco has had a significant run-up that last few months, but is trading like a tech stock at the moment. The stock has had difficulty breaking above the 3.618 fib level and a rising wedge has developed. My first target to the downside is 537. This setup is nullified if COST rises above 575.