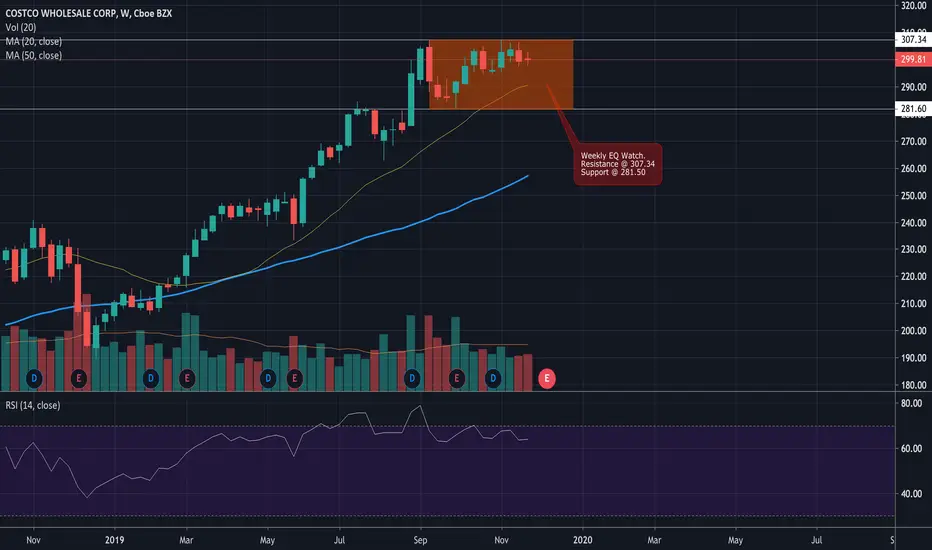
COST Weekly EQWeekly EQ on watch.
12/12/2019 is earnings and that could fuel the bulls or the bears to break this pattern.
COST trade ideas
$COST Looks Poised to Move Higher@Costco - rising trend channel support, ascending triangle support, already broke out & retested 161.8 Fib. I am still targeting $338. $COST
On a side note, still impossible for me to find parking at my Costco. Always packed.


$COST / CostcoI waiting for price to hit this trend line. Beautiful stock, $COST is one of my favorites to trade when it pulls back.


$COST coming to the end of a parabolic runIs this it for Costco? - consolidation for several weeks/months is what I'm expecting.

COST is tough to readIn one hand, its seems like its in an ascending wedge; accumulation is occurring more. However, a clear triple top can be seen, and bearish MACD divergence is clearly seen. 297 seems like a great value/low-risk area, but if a triple top is confirmed, we could see it dip to 270.

COSTIm looking at the channel break as possible fake out move and once back into the channel could run to the upper edge of the channel.

LONG COSTLong on breakout of ascending triangle. TP height of triangle.
Entry 307.44
Exit 298.56
TP 334
26.56/8.88 = 2.87R


More on COSTAdded extension targets...again, would be great to see a monthly break and close above prior highs

COST Cup and HandleCup and Handle. Great name. I'd like to see a break above $307.34 and a monthly close above that level. That would get me more excited for an eventual extended move higher.

Costco Breakout tradeEntry level $309 = Target price $332 = Stop loss $301.60
Costco has been bashing against the $304 level for some time and today could be the day the breakout comes.
Indicators are bullish and in reversal .

COST - Long setup Trading Room November 14,2019
Time: 01:13:25"
Entry: $307.45
Target: $335
stop loaa: $198.27


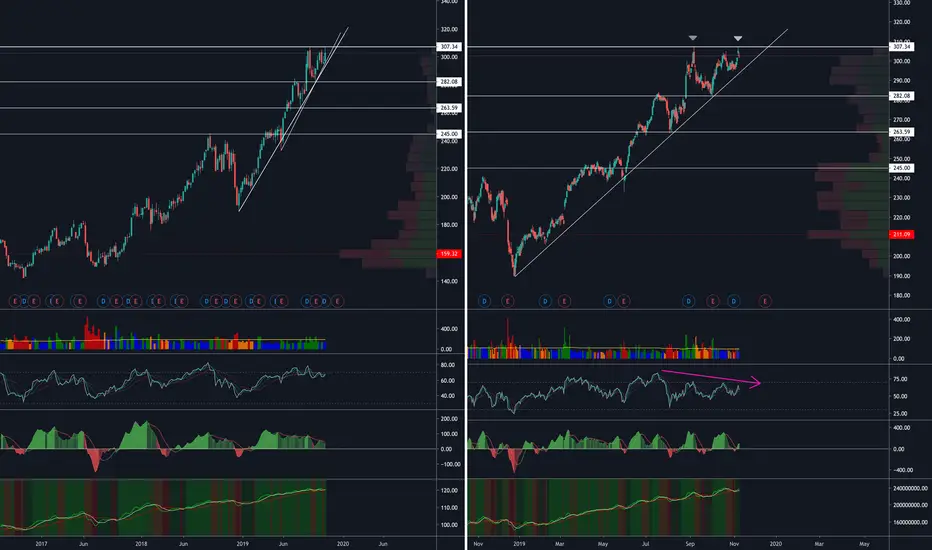
COST - trendingThis one will be short and sweet. Bullish if we stay above the white trend-line. On balance volume is the indicator I look to to gauge trend strength, it looks pretty strong at this level. I will note the double top, but I don't think its a brick wall. I will also note the slight RSI divergence, which is typically a hint to bulls that the ride is nearing its end. But I don't think we're quite there yet.
Buy at the trend-line not when price has deviated away from it. Make sure you have entry and exit parameters established prior to entering.
COST MACD divergence downLooks to be diverging down some from the double top. Picked up some 290 puts that expire November 15 for 25c.

COST Fb already done,but maybe...If there will be one more level break, i will go short, partly fixing the position on the way down.


Williams R% indicator on COSTThe Williams R% makes the read of the trend line changes easier. This chart for example, demonstrates that each time the indicator goes over the top in whichever direction it follows, a change of the trend line may occur.
Here, in point A goes from a upper trend followed by the indicator to a down trend immediately the R% shows that the trend changes is happening. The moment the R% shows that the trend is followed then we can place our order.

