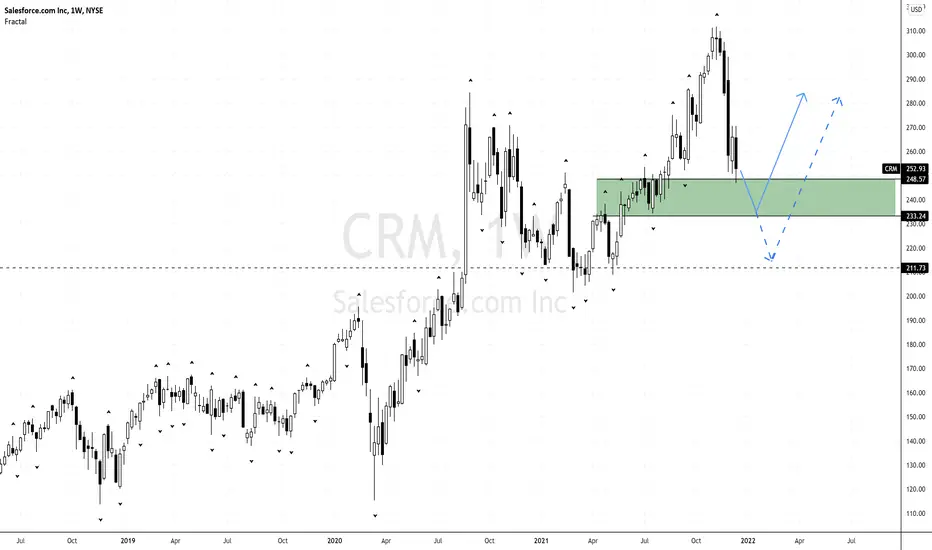
Multiple BottomsIf I were in this security today, I would place a stop under 201.50 which is the lowest of 4 bottoms, and cross my fingers, tightly, that this congestion zone of support is not broken. That stop is bit further from price than I usually feel comfortable entering a security, especially when Mr. Market has been so volatile as of late, so I will wait just a bit longer. If I miss out, I guess there is always another stock to buy. (o: I do not like buying on UP days anyway.
Earnings 3-1 AMC.
Green lines are major levels of support that I see. You may see different ones than I do.
CRM fell from what appears to be an Ugly top a while back. CRM did not form an ARC on the way up as the chart is not overly steep on weekly or monthly. CRM has now corrected all of the bearish rising wedges that were under price by breaking the bottom trendlines of each one and appears to be trying to recover lost ground. Time will tell.
I do think for the long term, this is a "Long" even though it may pull back again and again, so I clicked Long on the multiple choices of Long, Neutral, and Short.
Yesterday's candle could be an inverted hammer.
The 50 is trying to cross down through the 200 which some call a death cross. Price is below all the major longer term moving averages with several negative crossovers. Moving averages are lagging indicators but I do look at them and these look awful on this chart. Price is under these averages until it no longer is (o:
Some use the ATR (average true range) is based on volatility and some would multiply it by 2 and deduct it from price which is almost the same as a stop under the lowest bottom.
Price fell below the bottom bollinger band in the last few days with the SMA on 80, but has snapped back inside. This is oversold on weekly and daily RSI. CRM is not oversold on monthly RSI.
Chaikin's Money flow is trying to tilt up but is still negative.
The market is volatile and this could just be a rally up, but I have been tracking this one and noted the bottoms. There is a lot of resistance overhead and folks are stuck up there in financial pain who will sell on any rally up.
Short interest is very low. Looking at short interest is one of my rules before I buy anything. It gives me an idea of market sentiment, and frankly, shorties are not always right but most of the time they are.
EPS 4.69 PE 45.37 (on the low side for tech) Mkt cap 208 billion. Revenue is growing quarter over quarter.
No recommendation. If I am wrong on the Long (o; then I am just wrong and all I can do is make an educated guess as to what this may do. I do believe in the long term this would be a good investment if one were to get in at the right level.
CRMCL trade ideas

Do you think the shorts are still hidden in here ? $CRM idea$CRM nice lower shadow and an inside candle. Can this projects us higher or lower from here ? Drop a comment of what you think of the outcome

$CRM -- It's a BUY $CRM -- It's a BUY.
It looks like $CRM is about to bounce here at the support area.

CRM - Potential buy zone at 200
One more push down to 205 or 200 should see a hard bounce.
If you are short, it'd be good idea to trim your position.

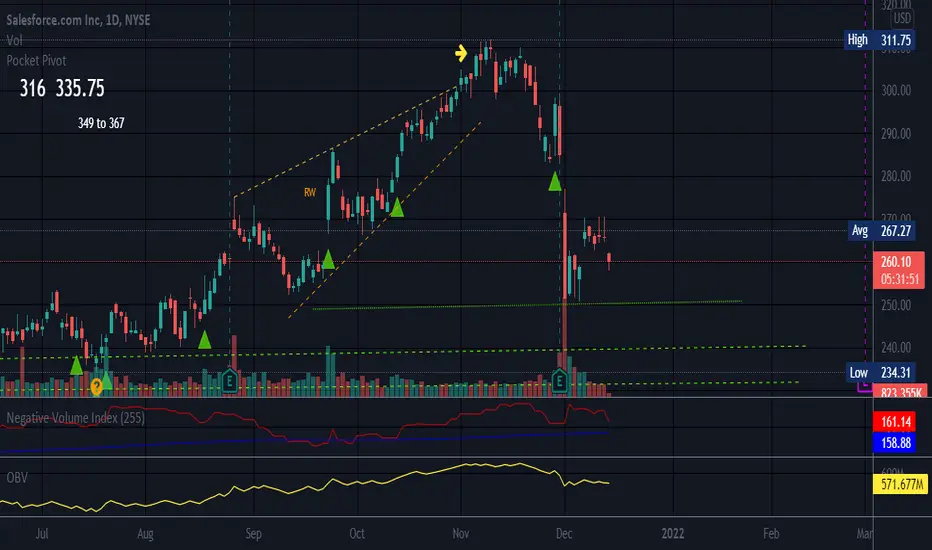
Rising WedgePrice has broken bottom trendline of upper rising wedge. Price has not broken the2nd lower rising wedge except for one candle close. (orange question mark) A rising wedge is not valid until lower trendline is broken and is a bearish chart formation.
Both trendlines slope up in a RW and narrow at the apex. The Rising Wedge is a bearish pattern that begins wide at the bottom and contracts as prices move higher and the trading range narrows. In contrast to symmetrical triangles, which have no definitive slope and no bullish or bearish bias, rising wedges definitely slope up and have a bearish bias.
The wedge pattern can be used as either a continuation or reversal pattern, depending on where it is found on a price chart. There are two types of wedge pattern: the rising (or ascending) wedge and the falling (or descending wedge).
A rising wedge in an uptrend is considered a reversal pattern that occurs when the price is making higher highs and higher lows. As the chart below shows, this is identified by a contracting range in prices. The price is confined within two lines which get closer together to create a pattern. This indicates a slowing of momentum and it usually precedes a reversal to the downside. This means that you can look for potential selling opportunities.
No recommendation/The alligator is trying to tilt upward but in an ideal alligator the red line should be on top in this chart.

CRM - Institutional Box + Fib levels6.854 level lines up with Consolidation Box POC (Point of Control)

$CRM last bounce attempt...Sitting at the 100 day sma, going to try a same week $230 call at $1.18...manage your own risk, stop at 50%

Potential Falling Wedge on CRMBulls tried to reclaim the 200 EMA, but were strongly rejected. Salesforce is down 11% in two days. We're entering my "Buy Zone" (where it's on my radar, but I need a confirmation, like divergence, before I'm ready to take a position). I'm expecting a Falling Wedge to form, and will likely wait for it to play out further. It's too risky for me at these levels, but more aggressive traders may have an opportunity to scalp some short-term profit before we head down further.
----------------------------------------------------------------
These are my personal views and not financial advice. Please do your own research before investing.
I'd love to hear your thoughts, ideas and feedback. Feel free to Comment and I'll try and get back to you quickly.
If you appreciated this analysis, consider Liking or Following . Thanks!

Trading at lower price level, potential for upside.Based on YoY and QoQ growth, CRM ended Q3 with strong revenue and net income. Net income were 360, 1,110, and 126 million respectively from 2018 to 2020. In 2021, net income was 4,072 million. It grew approximately 1131% since 2018 and 366% since 2019 (which was highest in 3-year period). Arising from that, it appears CRM management have been successful in mitigating impacts of COVID-19. CRM has acquired an additional Co-CEO, who possess an extensive knowledge in the business world and entrepreneurship; employed at Google and contributed to the success of Google map, started own company that was acquired by FB, and then founded another company which was evidently acquired by Salesforce. Strong management team is necessary in the current market condition, unmistakably shown in the past year due to COVID-19 revealing that some businesses fail to adjust. The guidance for SalesForce Q4 is the additional revenues and net income added to finish the year strong. This was presented by the management team that each product SalesForce has are showing durable growth.
SalesForce currently sits on 5,511 FCF.

$CRM: Short term bottomCalling a short-term bottom on CRM here. This is not a bloated tech stock, it's valued over time. They are currently at a P/S ratio of 8 and I think the stock might have put a temporary bottom. All in all, the stock would still go through the market correction cycle in the long term. In the short term, I expect it to close at least GAP 1. Also, notice the stock has extended below the lower Bollinger bands and oversold on all time frames.
Entry: $227 - $230 (I got 03/18 230 calls)
Targets: 247,260,291
Stop Loss: 220 (The stock still has a gap at 221)

Dream price 200EMANot financial advice but if the price touches 200 EMA ($195) that would be a rare entry opportunity for this stock. It only has happened three times last decade and it proved to be great entry point. Also same level coincides with 0.382 fib from November highs

CRM weekly Wolfe Wave bullish 1/2A Wolfe Wave is a chart pattern composed of five wave patterns in price that imply an underlying equilibrium price. Investors who use this system time their trades based upon the resistance and support lines indicated by the pattern.

Salesforce short termLooks like short term target would be $350. Its the Wave 5, so need to be careful and only longs if broader market is green.

CRM LONGPrice targets included, I am not a financial advisor, nor do I bear any responsibility of decisions made using the following information. this is my opinion only .
CRM
Salesforce
has been sitting around 215-220 for some time now, I am looking for a entry in tomorrows next session for options strictly, I will be going long on calls around each price target as well as puts on consolidating stages of CRM's potential growth.
Waiting for a clear reversal prior to entering
hope this helps someone


$CRM Long Trade ideaCRM is a stock with great fundamentals and I honestly believe every company would eventually move to a automated customer relations management system. The stock has been beaten down since last month with no changes in fundamentals and I think it might be time for a reversal after the 20% drop.
Trade Idea:
01/21 260C on break of 253 in a 30 mins chart
Target: 257,264,267,271
Stop: 249

Crm lost 250 support Headed back to trendline around 235. 250 was significant support, and new target should be around 235... I've said it before and I'll say it again, the bubble has popped on tech. How can a blue chip stock like CRM lose 25% in 1month with no end in sight? i think the final target will be 200$. if you step back you'll see a H&S on my chart. I'll give you a hint, 250 is the neck line😉

CRM dailyEverything is on the chart.
We tend to see a bounce when it comes to the 20 monthly MA for CRM. It is currently at 238, its also a demand zone. If we don't bounce this week, watch for that area for a potential long term buy.
Chart that goes with the December DD that include CRM !

Expecting Salesforce Price Rejections Below $240Expecting to see price rejections around 234 level as sell off continues on Salesforce. With the daily rejection on last week trading day, this might be a reversal signal...
N.B
- Let emotions and sentiments work for you
-ALWAYS Use Proper Risk Management In Your Trades
Rising Narrowing Wedge(s)CRM has fallen quite a ways from the latest narrowing rising wedge. Price can fall to a support level within the wedge, but then there is another rising wedge in the yearly chart and the bottom trendline may have been barely broken, but is questionable (orange question mark is on the candle that may be considered a break of the bottom trendline). Rising wedges are a long term pattern and not valid until the bottom trendline is broken. They are considered bearish. CRM broke upward from the first rising wedge in this chart and did a good job on trying to break upward from the second rising wedge (yellow arrow).
This can be a long slow process and the market is not friendly as of late. When price breaks on support level, I focus on the next one and set alerts a long the way.
Oversold on daily RSI, not on weekly and not even close to oversold status on monthly.
No recommendation.
Short interest is very low which is a positive thing in my opinion. Negative volume is dipping down a bit which could indicate waning interest.
The Negative Volume Index (NVI) is a cumulative indicator, developed by Paul Dysart in the 1930s, that uses the change in volume to decide when the smart money is active. The NVI assumes that smart money will produce moves in price that require less volume than the rest of the investment crowd.
NVI rises on days of positive price change on lower volume, NVI falls on days of negative price change on lower volume, and NVI is unchanged on days of higher volume no matter what the price action.
On-balance volume (OBV) is a momentum indicator that measures positive and negative volume flow. The theory being that when volume increases or decreases dramatically, without significant change in an issue's price, at some point the price "springs" upward or downward.

$CRM - Day Trading the Overhead Volume GapWhile $CRM was in freefall we left a small volume gap overhead.
Given that we break the upper trendline around 262-263, we should make a quick trip up to 266 as we fill the gap above, allowing us to capture an easy 1.5% move.
Options will be extremely cheap tomorrow since it's Friday, making this the perfect day trade candidate.

