$DIS Trade Idea still holding the 9EMA on the dayIf $DIS can break outside of this range
Calls over $109.82
Targets: $110.43, $110.71
Puts under $109
Target: $108.53
DIS trade ideas

$DIS Bear Flag Setup as #boycottdisney trendsDecent looking bear flag setting up here, looking for a retrace into the 38.2 level then a break to the downside. If the markets are weak tomorrow then it could drop nicely.

DIS Pre-Earnings RunDisney is in the retail news a lot these days but the chart has a pre-earnings run in anticipation that Year over Year financials will look a lot better than it did most of 2022. This stock has been as high as $200 a share so it has plenty of room to continue upward.
HOWEVER, it is over-speculated right now so profit-taking on the earnings release, good or bad, and probably a gap, are highly likely.
This is WHY earnings strategies for swing traders require that you prepare 2-4 weeks in advance so that you're already in the stock ahead of the earnings report. There are smaller funds and retail groups in the mix at this point.

Disney Happy hour starting soonGet ready to take a ride on the upcoming Bullish train in the world of disney as it forms a falling wedge.
Buy around 100-103 stop loss 95
Profit target 120 and beyond......

DIS ShortI am bearish on DIS.
Trade levels are as follows:
Entry: $110,69
Take profit: $97,28
Stop loss: $116,41
Risk/reward: 2.34

Trading Idea 027: Walt DisneyMarket Conditions:
- bullish trend
- possible false breakout / reversal
- bullish sentiment in the market
Key Level and Lines:
- $112.85 resistance
Trading Ideas:
- go short using a false breakout / reversal signal from the resistance
- go long if the price moves above the resistance and consolidates above for a few days.

DIS AnalysisPrice did not play according to my analysis last week. Price rallied higher into the main bearish POI at 109.88. Right now, I'm expecting price to give a confirmation on lower timeframe to go lower. Target for the down move is at least the bullish POI at 101.13. If not, price could potentially rally higher into the fair value gap at 115.27, following the order flow.

LONG-TERM/LEAPS OPPORTUNITY (DIS)With November coming to an end, DIS is currently ending the month off showing wick rejection on the monthly chart off of a key demand zone between $71.00 - $86.65, in confluence with the 200ma/200ema and 61.8% fib. From 2015 to 2020, Disney’s price has bounced from this area 5 times previously (including the initial breakout from this zone back in Jan/Feb 2015). As of today, Disney has once again returned to this zone for the 6th time. It has nearly wiped out 100% of the gains that began from the 2020 lows. Also note that price has consolidated between the prices of $92 and $112 for the past 6 months, showing that price is holding this level/area very strongly. Lastly, the previous six monthly candles are forming a possible double bottom pattern which is another bullish sign.
If you are looking for a great opportunity to start adding to your longterm portfolio, here is a great one to start with if you’ve been considering adding Disney as a longterm investment.
If you care for added confluence, Disney is also showing bullish divergence on the RSI while in the oversold region on the monthly chart, the MACD histogram on the monthly chart is beginning to curl up, and the stochastic oscillator on the monthly chart is also showing bullish divergence in the oversold region on the monthly chart.
Whether investing for long term reasons or investing for a long term swing, this area looks great for a watch candidate. If you considering this play, please remember to do your own due diligence and review any fundamental/economic factors to add to this technical breakdown of Disney's price chart.

DIS - Buy Above LineA double bottom , a very strong one in fact has formed on DIS
I am suggesting that DIS be bought once price rises and crosses the diagonal line
In the past this diagonal can be seen once broken leads to strong rises

DIS - Price Targets & Stop Loss📈 What’s up investors! 📉
Welcome back to another one of
💡“Mike’s Ideas”.💡
I post as I find signals… these signals are based on the personal rules I have built and follow in order to make up what I call the “SST Strategy”. Follow for more ideas in the future!!
I have 4 levels marked and colour coded on the Chart.
These levels are:
⚪ White = Entry Point
🔴 Red = Stop Loss
🟢 Green = 1.2:1 Risk Reward Ratio
🟡 Yellow = 1.5:1 Risk Reward Ratio
🔵 Blue = 2:1 Risk Reward Ratio
👀 So what are we looking at today…!!!
🚨( DIS ) The Walt Disney Company🚨
The Walt Disney Company, together with its subsidiaries, operates as an entertainment company worldwide. It operates through two segments, Disney Media and Entertainment Distribution; and Disney Parks, Experiences and Products. The company engages in the film and episodic television content production and distribution activities, as well as operates television networks under the ABC, Disney, ESPN, Freeform, FX, Fox, National Geographic, and Star brands; and studios that produces films under the Walt Disney Pictures, Twentieth Century Studios, Marvel, Lucasfilm, Pixar, and Searchlight Pictures banners. It also offers direct-to-consumer streaming services through Disney+, Disney+ Hotstar, ESPN+, Hulu, and Star+; sale/licensing of film and television content to third-party television and subscription video-on-demand services; theatrical, home entertainment, and music distribution services; staging and licensing of live entertainment events; and post-production services by Industrial Light & Magic and Skywalker Sound. In addition, the company operates theme parks and resorts, such as Walt Disney World Resort in Florida; Disneyland Resort in California; Disneyland Paris; Hong Kong Disneyland Resort; and Shanghai Disney Resort; Disney Cruise Line, Disney Vacation Club, National Geographic Expeditions, and Adventures by Disney, as well as Aulani, a Disney resort and spa in Hawaii. Further, it licenses its intellectual property to a third party for the operations of the Tokyo Disney Resort; provides consumer products, including licensing of trade names, characters, visual, literary, and other IP for use on merchandise, published materials, and games; operates a direct-to-home satellite distribution platform; sells branded merchandise through retail, online, and wholesale businesses; and develops and publishes books, comic books, and magazines. The Walt Disney Company was founded in 1923 and is based in Burbank, California.

Disney to find support at psychological support.Disney - 30d expiry - We look to Buy at 100.22 (stop at 96.86)
Previous resistance at 100 now becomes support.
Trading close to the psychological 100 level.
We look to buy dips.
Short term momentum is bullish.
We look for a temporary move lower.
Bespoke support is located at 100.
Support could prove difficult to breakdown.
Our profit targets will be 108.44 and 110.44
Resistance: 108.84 / 113.00 / 118.00
Support: 104.50 / 100.00 / 98.00
Please be advised that the information presented on TradingView is provided to Vantage (‘Vantage Global Limited’, ‘we’) by a third-party provider (‘Signal Centre’). Please be reminded that you are solely responsible for the trading decisions on your account. There is a very high degree of risk involved in trading. Any information and/or content is intended entirely for research, educational and informational purposes only and does not constitute investment or consultation advice or investment strategy. The information is not tailored to the investment needs of any specific person and therefore does not involve a consideration of any of the investment objectives, financial situation or needs of any viewer that may receive it. Kindly also note that past performance is not a reliable indicator of future results. Actual results may differ materially from those anticipated in forward-looking or past performance statements. We assume no liability as to the accuracy or completeness of any of the information and/or content provided herein and the Company cannot be held responsible for any omission, mistake nor for any loss or damage including without limitation to any loss of profit which may arise from reliance on any information supplied by Signal Centre.

DIS very close to enter an green territory. Upside 30%DIS price looks to break 200ma, potential upside 30% with SL around 13% from current level.

WALT DISNEY - Looking for entryThe stock is looking better and seems to have found support in the $95 zone.
Any pullbacks towards this zone could offer a decent entry to target $125-$130 initially.
A break below swing lows would be viewed as bearish.

$DIS Trade Idea Calls over $99.45
Targets: $101.13, $101.97, $106
Puts under $97.12
Targets: $96.33, $95.08

disney downside gap fillsgiven spx weakness and dollar strength. would like to see disney fill some gaps here.
bottom of our wave 2 box would fill the $87 gap we left behind and confirm a bottom.

Disney - Let The Fun Begin! 🎩Hello TradingView Family / Fellow Traders. This is Richard, as known as theSignalyst.
on MONTHLY: Left Chart
DIS is sitting around a strong support in green 85.0 - 95.0. For the bulls to take over long-term, we need a break above the blue resistance 120.0
Meanwhile, since we are around a support zone , we will be looking for buy setups on lower timeframes.
🏹 on DAILY: Right Chart
For the bulls to take over short-term, we need a break above the last high in gray.
Meanwhile, until the buy is activated, DIS can still trade lower inside the monthly support or even break it downward.
📚 Always follow your trading plan regarding entry, risk management, and trade management.
Good luck!
All Strategies Are Good; If Managed Properly!
~Rich

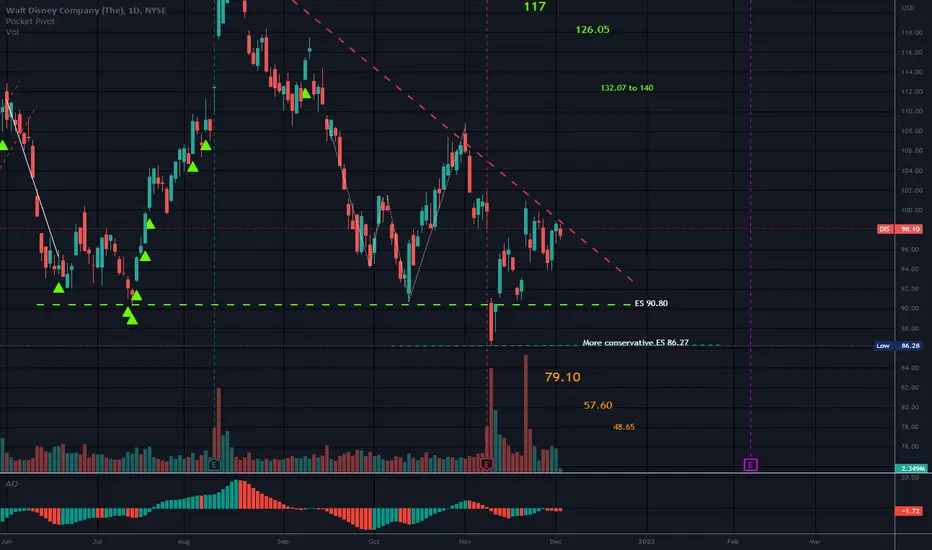
Descending TriangleThe momentum feels Down.
This is in a Descending triangle and this is a neutral pattern.
Price has not reached short entry level. I listed 2 entry levels as price has broken this triangle before and support kicked in.
No recommendation.
The awesome oscillator is a technical indicator that is used within the financial markets to confirm or disprove trends on price charts. These charts compare current data to historic data with the aim of predicting momentum in the markets. Like MACD, taller bars equal more momentum than smaller bars. This oscillator is based on moving averages.
Short when triangle fails and short entry level is met (ES)
DIS LongDaily RSI divergence
Support Line
Earning 11/08/2022 reported 0.3
Entry 92
Stop 86
Target 106, 125
Risk management is much more important than a good entry point.
I am not a PRO trader.
In my trading plan, the Max Risk of each short term trade should be less than 1% of an account.

DIS looking bearishDIS is standing on a long term resistance, it might visit $70 or the trend line in coming months.
NYSE:DIS

Dis tanking in after-hoursDisney, down big in after-hours, but it's just he start of this glorious decline. Long term this will work it's way to the low 50s (12 to 24 months out). Will She-hulk save them??? Let me know what you think!

DIS - Long term support heldA look at the monthly chart revealed that DIS has establised a strong support between 79 - 84 since 2015. This zone has been tested several times (2015, 2016, 2020) and the last time being just recently in the last week of Dec2022.
A bullish divergence is seen on it's monthly chart, increasing the odds of a bounce lasting a couple of (monthly) candles. (bullish divergence usually predicts a short term reversal that may last 2-3 candles and does not necessarily predict a longer term trend change).
It's probably a good opportunity for long term investors to accumulate at current levels or at any near term dips (as long as it does not breach $79). Bear in mind that it could remain volatile as it has yet to clear above its 200 day moving average.
In the unlikely even of the stock breaking below the long term support of 79, then all bullish bets will be off.
Disclaimer: Just my 2 cents and not a trade advice. Kindly do your own due diligence and trade according to your own risk tolerance and don't forget that money management is important! Take care and Good Luck!

DISNEY BEARISH REVERSALAvatar 2 has a much weaker-than-expected opening weekend and James Cameron implied that the movie will need to make around $2 bln to break even. NYSE:DIS is likely to suffer some short trend, nevertheless NYSE:DIS has always been one of the bluest in the blue chips and single movie fail won't sink a giant that easily.
Risk Disclosure: Trading Foreign Exchange (Forex) and Contracts of Difference (CFD's) carries a high level of risk. By registering and signing up, any client affirms their understanding of their own personal accountability for all transactions performed within their account and recognizes the risks associated with trading on such markets and on such sites. Furthermore, one understands that the company carries zero influence over transactions, markets, and trading signals, therefore, cannot be held liable nor guarantee any profits or losses.

DIS - Is the bottom in?It is hard to tell what is really going to happen to disney. The valuation on a fwd PE looks to be reasonably valued as well as a low price to sales ratio. The question really is, are they going to pay down their debt over the upcoming years and will they have the free cash flow to support paying down that debt.
From a purely technical standpoint, it is at the 61.8 retracement level from the 08 lows to the 2021 highs. With price going all the way back to 2014 and at two levels of big support, I think there is good risk/reward for the short term and potentially the long term if this is it's low. I think the big driver moving forward that has to become the dominant player in the space is it's streaming business.
A close below 87 and you can see volume drop off pretty heavily so this baby can fall fast. I will most likely look to short and pick up shares at $65 if that were to happen.
This is not financial advice! Good Luck!
