Bullish Gap Fill IdeaThis is a bet I'd be willing to take. It could very well come down a tad before it's next move up, but if holds in my view is a good bet to fill that gap. The market is performing well today with SPY & QQQ reaching new highs. GOOG didn't rip, but I think it just wasn't ready, and could be a strong move as soon as it is.
For full disclosure, this is is not a trade I took just yet, but like to share signals early to be ready for a "possible" move. This is in no way recommendation or advice. Merely an idea.
Happy Trading!
GOOG trade ideas

"Google Stock Approaches 2022 Highs"Google Stock Analysis: Testing Recent Highs and Channel Patterns for Trading Opportunities
In the dynamic world of stock trading, few companies command the attention and admiration quite like Google. With its innovative products, expansive ecosystem, and formidable market presence, Google has long been a favorite among investors seeking long-term growth opportunities. As we venture further into 2022, Google's stock is once again in the spotlight as it tests recent highs from January 1st, 2022, signaling potential opportunities for astute traders.
In recent trading sessions, Google's stock has been steadily climbing, inching closer to the levels it last reached at the beginning of the 2022. This upward momentum is notable, as it suggests renewed investor confidence and optimism in the company's prospects. Furthermore, technical analysis reveals that Google is currently stepping upward in a channel pattern, with the stock testing channel support along the way.
For traders eyeing potential opportunities in Google's stock, the current channel pattern provides valuable insights. If Google manages to maintain support within the channel, it could signal a continuation of the upward trend, presenting opportunities for long positions or holding existing positions. However, a break below channel support would warrant caution, potentially indicating a short-term reversal in momentum.
At the time of writing, one key level to watch is $143.85, which serves as a crucial point of interest within the channel. If Google's stock holds above this level, it could present an attractive entry point for traders looking to capitalize on a breakout towards the upside of the channel. A successful break through this resistance level could pave the way for further gains, with potential targets in the range of $165 to $170.
It's important to note that trading opportunities in Google's stock should be approached with caution and careful risk management. While the technical setup appears promising, market conditions can be unpredictable, and unforeseen developments could impact the stock's trajectory. Therefore, traders should consider setting stop-loss orders and closely monitoring price action to mitigate potential risks.
In conclusion, Google's stock is currently testing recent highs from the beginning of the year, with promising signs of upward momentum and a channel pattern indicating potential trading opportunities. By keeping a close eye on key support and resistance levels, traders can position themselves to capitalize on potential breakouts while managing risk effectively. As always, prudent decision-making and disciplined execution are essential for success in the dynamic world of stock trading.

$GOOGGoogle is currently breaking out of 3day accumulation and retested.
Bullish and possibly a new ATH next week
My view

Fundamental Value Levels via Technical Analysis: GOOG ExampleNASDAQ:GOOG had a mega gap down on earnings news. The stock was simply over-speculated.
The price of this stock was way above the true fundamental values. So the stock gapped down to its current fundamental value level.
See the chart attached. The green rectangle outlines the last range where there were Dark Pool Buy Zones. Indicators like Accumulation/Distribution help to confirm a consistent level of accumulation.

GOOGL 10% UP ? A popular stock + Above the average line 150 + UP trend line.
After (-7%) yesterday & good quarterly report, Gap down (a high percentage of the gaps will close) + 50% Fibonacci line + rising channel = Potential for a 10% increase?
Only an idea and not a recommendation for trading!

MBV-SP500-CLIMBER: GOOGIntroduction:
This trading idea is based on a Long-Only strategy that utilizes the Dynamic Movement Index (DMI), supplemented by the Average Directional Index (ADX) and an Average True Range (ATR)-based Trailing Stop-Loss.
Strategy Overview:
Main Indicators: DMI, ADX, ATR
Time Frame : Variable, based on the DMI length (Default: 14 days)
Objective: To take long-term positions in bullish market phases
Optional Trading Hours and Seasonality:
Yellow Background (Trading Days) : Positions are only opened on trading days highlighted with a yellow background on the chart.
Blue Background (S&P 500 Seasonality) : Positions are only opened during periods highlighted with a blue background on the chart.
Strategy Details:
ADX and DMI : A Long signal is generated, taking into account the optional trading hours and seasonality, when the ADX exceeds a defined threshold and the positive DMI is greater than the negative DMI. This indicates a strong upward movement.
ATR-based Trailing Stop-Loss : The Stop-Loss is dynamically set with a multiplier of the ATR value below the current price and updated to secure profits.
The strategy script is available for free on TradingView.
You can find it under the name: "MBV-SP500-CLIMBER"
Please share your optimizations with the TradingView community by leaving comments under the script.
Please provide feedback on the strategy, especially on the trading signals, in the comments.
---
Einleitung:
In dieser Handelsidee beruht auf einer Long-Only-Strategie, die auf dem Dynamic Movement Index (DMI) basiert, ergänzt durch den Average Directional Index (ADX) und einen Average True Range (ATR)-basierten Trailing Stop-Loss.
Strategie-Überblick:
Hauptindikatoren : DMI, ADX, ATR
Zeitfenster : Variable, basierend auf der DMI-Länge (Standard: 14 Tage)
Ziel : Langfristige Positionen in bullishen Marktphasen
Optionale Handelszeiten und Saisonalität:
Gelber Hintergrund (Handelstage): Positionen werden nur an den im Chart mit einem gelben Hintergrund hervorgehobenen Handelstagen eröffnet.
Blauer Hintergrund (S&P 500-Saisonalität): Positionen werden nur während der im Chart mit einem blauen Hintergrund hervorgehobenen Zeiträume eröffnet.
Strategie-Details:
ADX und DMI : Ein Long-Signal wird unter Berücksichtigung der optionalen Handelszeiten und Saisonalität generiert, wenn der ADX einen definierten Schwellenwert überschreitet und der positive DMI größer ist als der negative DMI. Dies signalisiert eine starke Aufwärtsbewegung.
ATR-basierter Trailing Stop-Loss : Der Stop-Loss wird dynamisch mit einem Multiplikator des ATR-Wertes unter dem aktuellen Preis gesetzt und aktualisiert, um Gewinne zu sichern.
Das Strategie-Skript ist auf TradingView kostenlos verfügbar .
Sie finden Sie unter dem Namen: "MBV-SP500-CLIMBER"
Bitte teilen Sie Ihre Optimierungen mit der TradingView-Community, indem Sie Kommentare unter dem Skript hinterlassen.
Bitte geben Sie Feedback zur Strategie, insbesondere zu den Handelssignalen, in den Kommentaren.

Alphabet - Wait For The RetestHello Traders, welcome to today's analysis of Alphabet.
--------
Explanation of my video analysis:
Back in 2012 Alphabet created a beautiful triangle formation and after we saw the breakout Alphabet pumped more than +750% towards the upside. At the moment Alphabet is creating a solid resistance area at the $150 level. If we get a retest of the bullish trendline which I mentioned in the analysis, I am looking for longs and eventually new all time highs.
--------
I will only take a trade if all the rules of my strategy are satisfied.
Let me know in the comment section below if you have any questions.
Keep your long term vision.

Alphabet's Ad Revenue Stumble
Alphabet Inc. ( NASDAQ:GOOG ), the parent company of tech giant Google, faced a tumultuous day in the stock market as shares slid 6%, erasing a staggering $110 billion off its market capitalization. The market's reaction came in the wake of Alphabet's ( NASDAQ:GOOG ) latest earnings report for the final quarter of 2023, where disappointing advertising revenues took center stage.
The Numbers Game:
While Alphabet ( NASDAQ:GOOG ) managed to exceed expectations in terms of profits ($1.64 per share) and overall revenue ($86.3 billion), it was the advertising segment that fell short. The $65.5 billion in ad revenue missed Wall Street's forecast of $66 billion, triggering a significant sell-off and sending shockwaves through the financial community.
CEO Sundar Pichai's Perspective:
In the midst of the market turbulence, Alphabet's CEO Sundar Pichai highlighted the company's ongoing commitment to artificial intelligence (AI). Pichai emphasized the launch of Gemini, a ChatGPT rival, and recent strategic shifts, including layoffs, aimed at reshaping the company's business model around technology.
Google Cloud Shines Amidst the Ad Revenue Dip:
Despite the disappointing ad revenue figures, there was a silver lining in the form of Google Cloud. The division saw a remarkable 26% year-on-year increase, surpassing expectations with $9.2 billion in revenue for the last quarter of 2023. Pichai expressed optimism about the future, especially as the company enters what he referred to as the "Gemini era."
Market Skepticism:
However, analysts and investors remain skeptical as advertising still constitutes a substantial 80% of Alphabet's ( NASDAQ:GOOG ) total income. Kathleen Brooks of online brokerage XTB noted in a statement, "Ad revenue was weaker than expected, and at heart, Google is considered an advertising company with ambitions to move into the AI space." This skepticism, coupled with the market's limited patience for earnings misses from major tech firms, led to the swift decline in Alphabet's ( NASDAQ:GOOG ) stock value.
The Aftermath and Future Outlook:
Alphabet's ( NASDAQ:GOOG ) stock, despite the recent setback, has still seen an impressive 50% surge over the past 12 months. The question now is whether the company can swiftly recover from this stumble and how its foray into AI, highlighted by Pichai, will play a role in reshaping its future. As Alphabet ( NASDAQ:GOOG ) navigates the challenges of balancing its traditional advertising stronghold with ambitious AI ventures, investors and industry observers will be closely watching to see how the tech giant manages to regain lost ground.
Conclusion:
The $110 billion wipe-off in Alphabet's valuation serves as a stark reminder of the market's sensitivity to advertising revenue, even for tech behemoths like Google. As Alphabet ( NASDAQ:GOOG ) charts its course into the Gemini era, the tech landscape awaits to witness whether the company's AI endeavors will provide the catalyst needed to reassure investors and propel the stock back to its previous heights.

$GOOGL A look at 5-year volatilityNASDAQ:GOOGL A look at 5-year volatility
A quick look at 5 year average volatility can show some great places to set alerts to get back into GOOGL

What's the future of Google search engine be like ? Read latest article here
When you are tasked to do a search online, you go to Google or say google something......Nobody says Bing something. That is the power of top of the mind branding . The first brand that comes to consumer mind constantly win. Fast food = Macdonald, Coffee = Starbucks, Credit card = Visa, Electric Vehicle = Tesla ,etc.
These boys have spent lots of money building their brands over the years so much so their products are more than its functional parts. An automotive vehicle like the Benz and Rolls have become a luxury status symbol, associated with the haves and have not.
Microsoft may be able to steal some market share from Google's search engine business but the major slice of the business still lies with Google. And I think it is way too early to conclude the findings at this juncture when we are witnessing the ChatGPT revolution now.......
Mergers and acquisitions may take place down the road for market shares to expand and territory to conquer.
This temporary drop in share price is viewed as an opportunity for me. What about you ?
GOOGLE Will it get sold after the Earnings?Alphabet Inc. (Google/ GOOG) is reporting Earnings today and the focus is whether or not they can keep fueling this strong multi-weak rally or cause a correction. Last time we looked into this stock (November 27 2023, see chart below), we gave a pull-back buy signal, which easily hit the 145.00 target:
The price is still on the latest Bullish Leg of the 1-year Channel Up pattern, but is getting very close to its top (Higher Highs trend-line). Having a vastly overbought RSI on the 1D time-frame, which in fact is about to reach 80.00, the level which formed the May 22 2023 RSI top, is starting to call for a medium-term sell.
What we are basically looking for is for a 1D RSI Bearish Divergence like the one in late May 2023. More specifically, if the RSI gets rejected now around 80.00, we will wait for it to form a Lower High and short it, if the price remains on Higher Highs, which was what happened on June 06 2023 and was a 1D RSI Bearish Divergence. Ideally we would prefer the price to be above the 1.786 Fibonacci extension level by then. The sell's Target will be $148.50, preferably marginally below the 1D MA50 (blue trend-line).
-------------------------------------------------------------------------------
** Please LIKE 👍, FOLLOW ✅, SHARE 🙌 and COMMENT ✍ if you enjoy this idea! Also share your ideas and charts in the comments section below! This is best way to keep it relevant, support us, keep the content here free and allow the idea to reach as many people as possible. **
-------------------------------------------------------------------------------
💸💸💸💸💸💸
👇 👇 👇 👇 👇 👇

Alphabet (GOOG) Take Profit +76% !January 2024
It's Google's turn (goog)
+76 %
I take home part of the profits on trade started at the end of 2022
Waiting for the Earnings...
The stock remains in the portfolio after the rebalancing.
Interesting levels for long entries:
Between $115 and $105 and surely, should it ever get there, to $86, where I entered a position on the bottom.
Happy trading
Lazy Bull

GooglPriced has rallied 9% in the last 2weeks from an ascending triangle
We closed friday at the top of a rising wedge here At All time high. Also google is pretty much over bought on everytime frame and weekly candle is outside its bbands.
Im looking for a pullback to 138 -140 minimum in early February.

$GOOG: LATERALISATION?I will enter for a swing around 141... waiting for a lateralisation and a touch of the bottom BB.
The past is history the future is a mystery

GOOGL Alphabet Options Ahead of EarningsIf you haven`t bought the dip on GOOGL here:
Then analyzing the options chain and the chart patterns of GOOGL Alphabet prior to the earnings report this week,
I would consider purchasing the 155usd strike price Calls with
an expiration date of 2025-1-17,
for a premium of approximately $18.55.
If these options prove to be profitable prior to the earnings release, I would sell at least half of them.


4 Accurate Predictions Made by AI for Alphabet (GOOG, GOOGL)In the dynamic world of stock trading, the integration of Artificial Intelligence (AI) has revolutionized market analysis and prediction accuracy. Alphabet Inc. ( NASDAQ:GOOG GOOG, NASDAQ:GOOGL GOOGL), a leading tech giant, has been at the forefront of showcasing how AI can be utilized to predict stock market trends with remarkable precision. This article delves into four specific instances where AI successfully predicted Alphabet's stock movements, providing traders with lucrative opportunities. These cases exemplify the growing influence and reliability of AI in financial markets, offering insights into both bearish and bullish patterns that have resulted in significant gains for informed traders.
Prediction #1. Downtrend Detected
AI detected bearish Stock Pattern: Broadening Wedge Ascending NASDAQ:GOOG GOOG on October 25, 2023, netting in a 10.61% gain over 2 weeks
On October 11, 2023, AI detected a Broadening Wedge Ascending Pattern (Bearish) for Alphabet (GOOG, $141.70). 14 days later, on October 25, 2023, A.I.dvisor confirmed the Bearish pattern, setting a target price of the stock. On October 25, 2023, the stock hit the target price of $128.11 – resulting in a +10.61% gain for traders who shorted the stock on the pattern detection date.
Prediction #2. Downtrend Detected
AI detected bearish Stock Pattern: Wedge Rising NASDAQ:GOOGL GOOGL on September 13, 2023, netting in a 6.10% gain over 2 weeks
On September 11, 2023, AI detected a Wedge Rising Pattern (Bearish) for Alphabet (GOOGL, $136.92). 2 days later, on September 13, 2023, A.I.dvisor confirmed the Bearish pattern, setting a target price of the stock. On September 26, 2023, the stock hit the target price of $127.46 – resulting in a +6.10% gain for traders who shorted the stock on the pattern detection date.
Prediction #3. Uptrend Detected
AI detected bullish Stock Pattern: Head-and-Shoulders Bottom NASDAQ:GOOG GOOG on August 29, 2023, netting in a 3.89% gain over 5 days
On August 24, 2023, AI detected a Head-and-Shoulders Bottom Pattern (Bullish) for Alphabet (GOOG, $130.42). On August 29, 2023, A.I.dvisor confirmed the Bullish pattern, setting a target price of $136.93. On August 29, 2023, GOOG reached the target price resulting in a +3.89% for traders who took a long position in the stock.
Prediction #4. Uptrend Detected
AI detected bullish Stock Pattern: Head-and-Shoulders Bottom NASDAQ:GOOGL GOOGL on August 29, 2023, netting in a 3.61% gain over 4 days
On August 25, 2023, AI detected a Head-and-Shoulders Bottom Pattern (Bullish) for Alphabet ( NASDAQ:GOOGL GOOGL, $129.88). On August 29, 2023, A.I.dvisor confirmed the Bullish pattern, setting a target price of $136.24. On August 29, 2023, GOOGL reached the target price resulting in a +3.61% for traders who took a long position in the stock.
These four accurate predictions made by AI for Alphabet's stocks (GOOG, GOOGL) underscore a new era in stock market analysis. The ability of AI to detect complex patterns like the Broadening Wedge Ascending and Head-and-Shoulders Bottom, and accurately predict market movements, is a testament to its growing significance in financial forecasting. These instances not only highlight the potential financial gains for traders leveraging AI insights but also mark a transformative shift in how market analysis and trading decisions are approached. As AI continues to evolve, its role in guiding investment strategies and shaping the future of stock trading becomes increasingly pivotal.
Finding Current Patterns with AI
If you're interested in staying updated with current trading patterns, particularly for cryptocurrencies like Origin Protocol, Tickeron is a valuable resource. This platform employs advanced artificial intelligence to detect and analyze market trends, offering insights that can guide traders in making informed decisions. Visit Tickeron to explore real-time data and trends in the dynamic world of cryptocurrency trading.

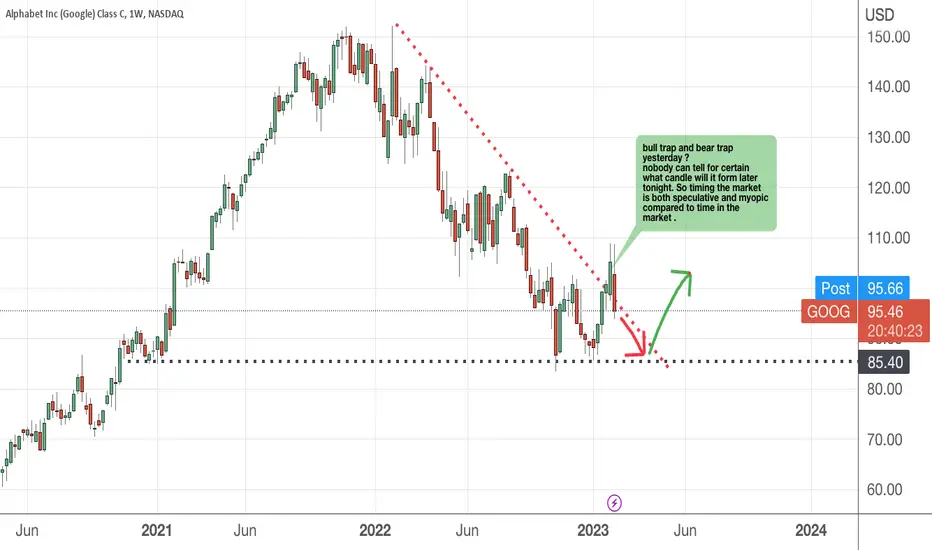
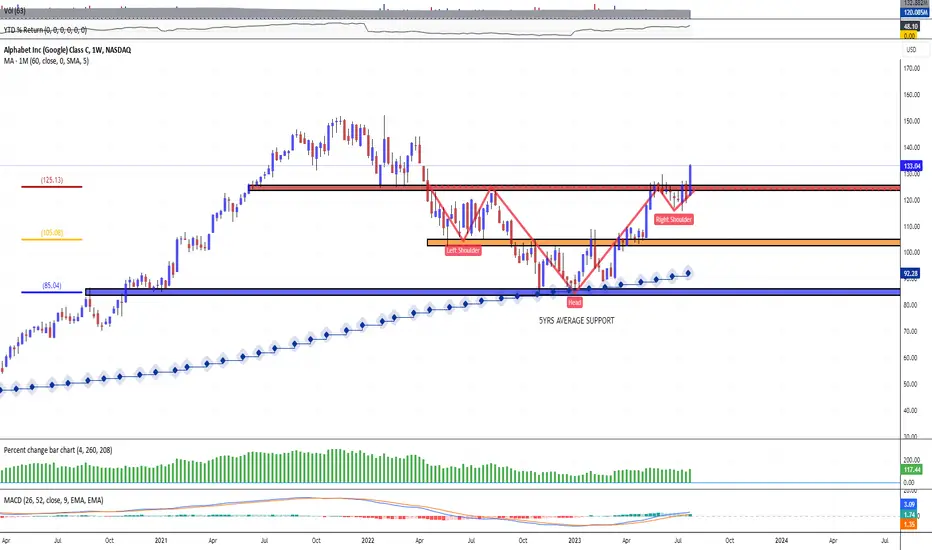
👋 Alphabet Inc (Google) — Bear Trap EscapeAmerican company Alphabet Inc. two days before has published a quartrely statement and announced an increase in net profit and revenue in the second quarter ended in June.
In addition, the company said its chief financial officer, Ruth Porat, will take over as president and chief investment officer of Alphabet and Google from September 1, 2023.
At the same time, Porat will temporarily remain as CFO of Alphabet and Google until her successor is found.
The company reported net income of $18.4 billion, or $1.44 per share, compared to $16 billion, or $1.21 per share, a year earlier.
Revenue, meanwhile, rose from $69.7 billion a year earlier to $74.6 billion, also above the market's forecast of $62.06 billion. Cloud revenue was up 28% year-over-year.
Comments by Sundar Pichai, CEO of Alphabet and Google:
“Our products and company performed well this quarter. Our continued leadership in artificial intelligence and our excellence in engineering and innovation are driving the next evolution of Search and improving all of our services.
With 15 products serving half a billion people each, and 6 of them serving more than two billion people, we have a lot of opportunities.”
Comments by Ruth Porat, Chief Financial Officer of Alphabet and Google:
“Our financial results reflect continued resilience in search with accelerating revenue growth in both search and YouTube, as well as momentum in the cloud.
We continue to invest for growth while prioritizing our efforts to long-term reorganize our company-wide cost base and build the capacity to deliver sustainable value over the long term.”
As announced on April 20, 2023, the Company has merged part of Google Research (the Brain team) and DeepMind to significantly accelerate advances in artificial intelligence (AI).
A group called Google DeepMind is reflected in Alphabet's unallocated corporate expenses starting in the second quarter of 2023.
Shares of Google rose more than 6 percent in premarket trading on Wednesday, with a lot of room for further gains.
Technical pictures indicates that major breakout of $125 resistance is happening right now, hitching the price above the neckline in reversed Head and Shoulders chart pattern structure.
GOOG Stock Poised for ATHs as Market ReboundsGoogle parent company Alphabet Inc.'s (GOOG) stock is poised to reach all-time highs (ATHs) as the broader market rebounds from recent sell-offs. The company's strong fundamentals, including its dominant position in the online advertising market, its growing cloud computing business, and its expanding hardware offerings, make it well-positioned for continued growth in the years to come.
In addition, GOOG's recent stock buyback program and its commitment to returning value to shareholders through dividends are also likely to support the stock price. With the market on the upswing, GOOG is a compelling buy-and-hold investment for long-term & short-term investors.
This is not an investment advice do your own DD.

Alphabet Inc. (symbol ‘GOOGL’), DailyShares of Alphabet Inc. (symbol ‘GOOGL’) rose by around 4% in the last quarter of the year. The company’s earnings report for the fiscal quarter ending December 2023 is expected to be released on Tuesday 30th of January, after market close. The consensus EPS is $1.60, against $1.05 of the same quarter last year.
‘ The company is involved in the AI frenzy with the introduction of Google Bard and Gemini as tools to combat OpenAI’s popular ChatGPT. More specifically on the date of the launch of Gemini (6 December) the share price experienced a bullish gap of around 6%. Apart from the launch of these new products by the tech giant, the financial image that it displays is also sound and solid. The total assets outweigh total liabilities at an astonishing ratio of 3:1 and the current ratio is at a staggering 204% indicating that the company has a pretty strong balance sheet to overcome any short term turbulence. ‘ said Antreas Themistokleous, trading specialist at Exness.
From the technical analysis perspective the price has been trading with relatively steady bullish momentum throughout the majority of the quarter making consistent gains on its share in the early days of 2024. Currently the price is trading above the moving averages and is on the move to reach its all time high of around $150 which was achieved back in November of 2021.
The 50 day moving average recently crossed above the 100 day moving average validating the bullish momentum but on the other hand the Stochastic oscillator is in the extreme overbought levels possibly suggesting that a correction to the downside before resuming the overall bullish rally might be possible in the near short term outlook.

GOOG Stock Strong Cash and Upcoming AI Signal GrowthGoogle's stock is currently in an exciting position with numerous factors aligning for potential growth. With a strong cash reserve of $118 billion, the tech giant has been making significant investments in Artificial Intelligence (AI). Google is set to unveil its latest AI technology in October, which shows promising potential to drive growth and innovation.
From a technical standpoint, GOOG's monthly chart appears to be mimicking patterns seen in Nvidia's (NVDA) stock chart before it reached all-time highs. I believe GOOG is set to replicate NVDA's success, with breakout levels signaling strong entry points for investors.
Key targets for the stock are marked by red lines on the chart, indicating potential risk and reward zones. These targets are at $148, $185, and $240. Each breakout level could subsequently become a new support zone, fortifying the stock's ascent.
Given the company's strong fundamentals and the upcoming AI release, Google presents an intriguing investment opportunity. However, as with any investment, please perform your own due diligence and consult with financial advisors.
Note: This is not financial advice. Investors should conduct their own research and consult professionals before making any investment decisions.
Good luck, and here's to potentially seeing Google reach new all-time highs!
(Note: Please make sure to attach your chart with the red lines indicating target and risk zones for a more comprehensive view. Finally This is not financial advice.)

Alphabet's Breakup with Appen Sends Shockwaves In a surprising move, Alphabet, Google's parent company ( NASDAQ:GOOG ), has severed all ties with Appen, the Australian artificial intelligence (AI) data firm that played a crucial role in training Google's chatbot Bard, refining Google Search results, and contributing to other AI products. The termination, set to take effect on March 19, was communicated to Appen over the weekend, following a strategic review process. Alphabet's decision, accounting for approximately one-third of Appen's revenue, is expected to impact at least two thousand subcontracted Alphabet workers.
Appen's Role and Struggles:
Appen, with a rich history spanning nearly 30 years, has faced challenges in recent times, including a loss of customers, executive departures, and declining financials. Despite boasting an impressive client list that includes Microsoft, Meta, Apple, Adobe, Google, and Amazon, the company has struggled to adapt to the evolving landscape of generative AI tools. Its revenue plummeted by 30% in 2023, following a 13% decline the previous year, which the company attributes to "challenging external operating and macro conditions."
Financial Impact:
Alphabet's decision to terminate its contract with Appen is a significant blow, as the tech giant contributed $82.8 million to Appen's $273 million in sales for the year 2023. With the stock trading at around 28 Australian cents, down more than 99% from its peak in August 2020, Appen faces a critical juncture in its future.
Labor Disputes:
The Alphabet-Appen relationship has not been without its challenges, including a historical dispute about wages. In 2019, Google ( NASDAQ:GOOG ) set a minimum wage requirement of $15 per hour for its contractors, a standard that Appen reportedly failed to meet. This led to conflicts and public letters from workers. Despite efforts to address labor concerns, Appen faced charges from the U.S. National Labor Relations Board in June for allegedly firing six freelancers who spoke out about workplace conditions. The workers were eventually reinstated.
Future Outlook:
In response to the termination of the Alphabet contract, Appen has announced a strategic shift, focusing on managing costs, turning the business around, and ensuring the provision of high-quality AI data to its remaining clients. The company plans to provide further details on its revised strategic priorities in its full-year results announcement on February 27, 2024.
Conclusion:
Alphabet's decision to sever ties with Appen has sent shockwaves through the AI industry, highlighting the challenges faced by even established players in the rapidly evolving technology landscape. As Appen grapples with financial difficulties and labor issues, the industry watches closely to see how the company will navigate this turning point and reshape its future in the competitive AI market.

GOOG Short: Ending diagonal completedI was too early in my previous call and was wrong (linked here), but this time it should be obvious that it has ended.
