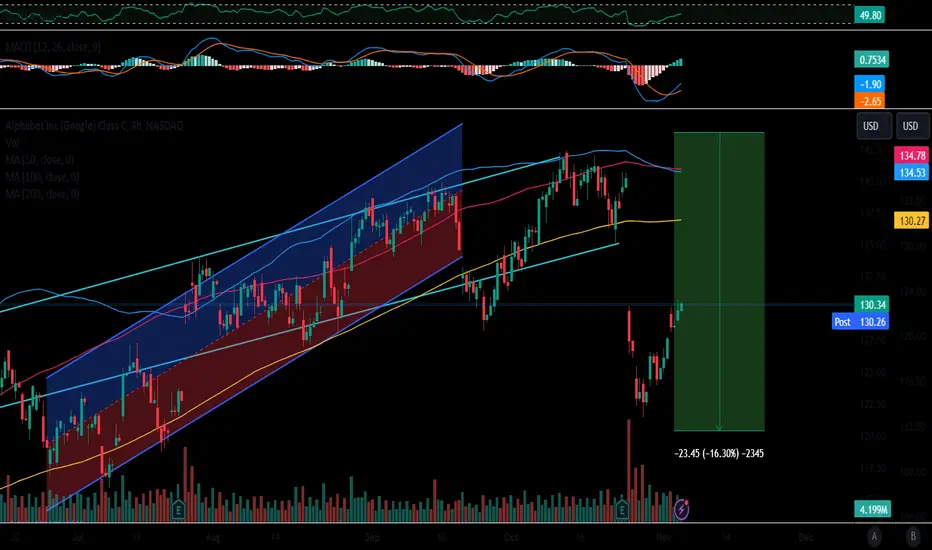
GOOG Window ClosedThe big window that had been opened October 25th has finally been close now and the upward pressure is dwindling. That's why I prefer the close of the 2nd November window now instead of the continued rise to close the 24th October upward window.
The risk is that the bears may be unable to close the window that had been opened yesterday with the spike up. I consider this as not so large as there may lay enough stop loss orders around it. When the first of them will be triggered then the price may plunge very fast towards the deeper window at about 128.
GOOG trade ideas

GOOGL in bullish uptrend.Google has been in an long term uptrend for over a decade.
If we can break $145-$150 we can see a move to the upside into the $190's range.

Google Approaching Short Zone SetupOn the weekly, Google has violated it's uptrend and is approaching a nice short zone for a decent risk/reward setup as pictured.

GOOG CUP AND HANDLE PATTERNGreetings, traders! Welcome to another analysis session where we're diving into a promising opportunity. Today, our focus is on a noteworthy asset that has broken above a significant level. Let's delve into the details:
- **Breakout:** 123.26
- **Stops:** ST at 119.69
- **Targets:**
- 62%:
- 147.8%:
- 154.59
Observing the chart, we can discern that the price is currently navigating a distinct phase, forming upper and lower boundaries that shape a rectangle pattern. For those who've been following my analysis, you'll recognize my successful strategies for trading within such rectangle patterns.
As you're here, why not pay a visit to my profile? Your support and engagement are greatly appreciated. Stay connected and don't miss out as we're gearing up to share an array of analyses spanning stocks, futures, and commodities.
Stay tuned for more insights and updates. Your journey with us continues!
Best regards,
TCPLTP

GOOGL ~ Snapshot TA (Daily / Nov 2023)NASDAQ:GOOGL chart mapping/analysis.
Multi-year consolidation/pennant pattern formation.
Bull target(s)
Overhead gap fill (~137.42)
Descending trend-line resistance (white dotted) - plus breakout? TBC
Previous ATH + upper range parallel channel (light blue) confluence resistance zone
Bear target(s)
23.6% Fib + gap fill (~126.49) confluence support zone
Ascending trend-line support (green dotted)
Underlying gap fill (~117.71)
38.2% Fib + gap fill (~112.94) confluence support zone
Ascending trend-line support (white dotted)
50% Fib
Golden Pocket Fib

Google $GOOG Island Gap 🏝️Google appears to be setting up an "Island Gap Reversal Pattern" 🏝️
Characteristics of an Island Gap:
1. A lengthy trend leading into the pattern. ✅
2. An initial price gap. ✅
3. A cluster of price periods that tend to trade within a definable range. ✅
4. A pattern of increased volume near the gaps and during the island. ✅
5. A final gap which establishes the island of prices isolated from the preceding trend. ✅
Target: 105-108 😱😱

Is the Right Shoulder on the works for $GOOGL?? Is the Right Shoulder on the works for NASDAQ:GOOGL ?? We will find out in weeks time...


Long on $googlNASDAQ:GOOGL has been inching up since early this week. Inside day & inside week with macd curling to the upside. Looks like it wants to fill the gap. We should test 134$ & then $140 range.

Resistance Overhead/Flags ad PennantsA structure is forming with both trendlines sloping up and narrowing at the apex. This is called a Rising Wedge and these are considered bearish.
However this one formed after a steep drop down, so one could add a pole and call this a pennant.
The targets for Pennants and Flags are calculated using the pole. The structure at the end of the pole can not go on and on or it becomes "too heavy" for the pole to support. Both come in bullish and bearish forms and they both slope against the prevailing trend but can be flat. A flag should, but not always, takes 3 weeks to form at a minimum and the lines slope parallel to each other. A bull Flag or Pennant often slopes down against the prevailing uptrend and a bear Pennant or Flag often slopes up against the prevailing downtrend. Both are neutral until broken and can break up or down.
There is no such thing as a Bullish Rising Wedge although they do break up sometimes as MSFT has done recently. The bottom line is eventually broken but these can be long term patterns and are not valid until the bottom line is broken. Rising Wedges cause an imbalance between supply and demand (too many buyers within the wedge) and can be caused by FOMO. When price breaks the bottom line there tends to be a sell off to balance supply and demand once again.
Rising wedges are just about impossible for me to establish a target for and they usually do fall but a level of support within the wedge can catch price and stop the fall even if temporarily.
Both Rising wedges and Bear Pennants have the possibility of breaking to the upside especially as of late in this market that feels a bit strange to me. We are all different.
Flags, pennants and rising wedges are neutral until a line is broken.
There is also a cup trying to form but price is a ways from EL for this pattern.
No recommendation.
The sharks usually swim away when the bleeding stops )o:

GOOGLE:BAT/BALCK SWAN/Wolfe WaveGOOGLE:BAT/BALCK SWAN/Wolfe Wave
Google/Alphabet is one of the “Magnificent Seven” and the performance of recent months is indisputable. However, even though the fundamentals are all green, there may be a "Black Swan" nestling within Mountainview society, this black swan might even have the face of the Department of Justice. Indeed, for several days, judges have been digging into the past to find out whether Google would not have abused and used financial manipulation to obtain this dominant position in search engines.
Whether we subscribe to this conspiracy theory or not, we cannot neglect the fact that the government will want to make an example and deprive Google of its current privileges - such as, for example, being the default search engine at Apple - this hypothesis could even justify the probability of a severe correction, even if, in the long term, it should not have too much impact either. Add to that the fact that the Magnificent Seven are tired after their 2023 rally and you have a "perfect storm" looming over Mountain View.

#Google versus #SilverJuniorMiners#Google versus #SilverJuniorMiners
Now, IF ever the price goes back in the wedge...
That would be a MASSIVE false breakout and enact a FAST MOVE in the opposite direction.

Post-event high PoP STRANGLE on my favorite techstockOf course! Here's a polished version for your blog post in English:
Post-Event Strangle with 51 Days to Expiration
IVR30
Probability of Profit (PoP): 69%
Max Profit: $260
Required Buying Power (Req.BP): $1627
Explanation to follow.

(NASDAQ: GOOGL) Is Alphabet Inc. a Buy?Thinking about the big picture
I always stress how important it is for long-term investors not to get caught up in any single quarter's performance. If you plan to own a stock for five or 10 years, what happens in any three-month period is hardly important in the grand scheme of things. This same approach should be applied to Alphabet.
Yes, the market reacted negatively to the tech giant's latest earnings. But a valid question to ask is: Is this company's long-term competitive position under threat? I think the answer to that question, based on the facts, is a resounding no.
Let's focus on Alphabet's bread-and-butter search business. According to statcounter.com, it still has a monopolistic position, with just under a 92% share of the global market.
Is OpenAI's ChatGPT integration really enough for consumers to ditch Google and start using Microsoft's Bing search engine? It's a stretch for someone to believe this to be true. To be fair, the market could shift radically in the next few years, but that is almost impossible to predict. And right now Google is still the leader in search, and as a result of that, digital advertising as well.
In order to position itself for the AI wars, Alphabet has just agreed to invest $2 billion in Anthropic, an AI start-up that has created a chatbot that is a direct competitor to ChatGPT. Maybe more importantly, Alphabet is planning to launch Gemini, its internally developed generative AI model, which could be more versatile and powerful than OpenAI's offerings. This could quiet the doubters who think this business is falling behind.
Additionally, investors have to ask if the growth of AI will really bring about entirely new use cases for consumers and businesses, or if this revolutionary technology will simply improve what already exists. As of right now, it looks like the latter will happen. And "with 15 products that each serve half a billion people, and six that serve over 2 billion each," according to CEO Sundar Pichai, Alphabet already owns some of the most popular, widely adopted internet properties on the face of the planet. This gives it a huge leg up to introduce AI innovations to an existing user base.
Calls googleI'm highly speculating here, looks like support is holding and next week could be a green week. Price is oversold and support holing, is a good combination. I think we might open with a gap up on Monday.

GOOGLE - The warning signs were thereWe did not trade this directly because:
- We were short on both the Nasdaq and the SPX500.
- Both the assets above had a better RR.
- Both have made us higher percentages than Google would've so far.
However, we deem it important to post google as it is exactly the type of trade set up that we preach about and showcases traditional Technical Analysis in its best light. It also drives the Index funds and so reflects how we've position ourselves lately.
Google broke down of its falling wedge and confirmed the breakdown. Before this it held a key level as resistance and was also showing extensive bearish divergence. Lastly, it was at a great value area for a short reaching just over the 0.786% retracement from the Low to ATH.
Please ask any questions you may have!

GOOG Rising Wedge Here is a simple rising wedge pattern on google with bear gap resistance above you dont want to get caught guessing the top because there is no way to tell exactly when price will reverse. Just react and catch the move when it presents itself. Expect to enter after either A) Gap Down, B) intraday Head and Shoulders or C) intraday bear flags.

Trade setup_20% wave in GOOGLEGoogle is all set to move up in wave V of 3 towards the 150$ mark.
On the way up watch out for levels 131.9 and 134. If the stock surpasses them with ease that would reduce the probability of this bounce being an "X" wave and the stock will make it to the 150 mark.
Note*- do your own study/research before taking up any financial positions.

An Interesting View of the Big 4Sometimes it helps to zoom out and look at these names from a distance.
we look at a view that's totally different from the daily or 30min charts we're staring at all day long, to just break away from the daily noise.
This is a view of my "big 4" - looking at
====================================
* weekly chart, Renko, $1 blocks
* 1 Year of data
* Most common moving averages (showing 10, 20 and 50)
* lower indicators: Relative Strength, Qtrly EPS and Qtrly Revenue (in that order top to bottom)
What do you see? Any observations stand out if you're trading these big 4 names? Feel free to capture comments and observations below.
What to look for in this broader view?
* Short, mid and long term price trends
* compare current price level to 1-year ago (or the peak before the bear market) level
* Revenue and EPS trends for the last 4 quarters
* breaking out (or below) the blue line (50MA)
* potential for price upside (psychologically - where is current price from 52wk highest & lowest levels)
* Which names are making new (13wk) RS highs or lows versus the market (these are shown by the blue/orange circles on the RS indicator)
* .... others?
My view? I'm looking at trading (and already have positions in) MSFT and GOOG - looking for an entry in AMZN, and putting AAPL on the side for now until it shows better fundamentals ..
Another point here, these charts may show all 4 names are over-extended... so when we trade them, we need to be careful with our stops.. there's always the possibility market moves back into bearish sentiment from these levels.. agree ?
Stay safe and green lines to you.

GOOGLE Stock Chart Fibonacci Analysis 103023 Trading Idea
1) Find a FIBO slingshot
2) Check FIBO 61.80% level
3) Entry Point > 125/61.80%
Chart time frame : B
A) 15 min(1W-3M)
B) 1 hr(3M-6M)
C) 4 hr(6M-1year)
D) 1 day(1-3years)
Stock progress : B
A) Keep rising over 61.80% resistance
B) 61.80% resistance
C) Hit the bottom
D) Hit the top
Stocks rise as they rise from support and fall from resistance. Our goal is to find a low support point and enter. It can be referred to as buying at the pullback point. The pullback point can be found with a Fibonacci extension of 61.80%. This is a step to find entry level. 1) Find a triangle (Fibonacci Speed Fan Line) that connects the high (resistance) and low (support) points of the stock in progress, where it is continuously expressed as a Slingshot, 2) and create a Fibonacci extension level for the first rising wave from the start point of slingshot pattern.
When the current price goes over 61.80% level , that can be a good entry point, especially if the SMA 100 and 200 curves are gathered together at 61.80%, it is a very good entry point.
As a great help, tradingview provide these Fibonacci speed fan lines and extension levels with ease. So if you use the Fibonacci fan line, the extension level, and the SMA 100/200 curve well, you can find an entry point for the stock market. At least you have to enter at this low point to avoid trading failure, and if you are skilled at entering this low point, with fibonacci6180 technique, your reading skill to chart will be greatly improved.
If you want to do day trading, please set the time frame to 5 minutes or 15 minutes, and you will see many of the low point of rising stocks.
If want to prefer long term range trading, you can set the time frame to 1 hr or 1 day.

Google Poised To Backs Anthropic With $2BWith a massive $2 billion reported investment from Google, Anthropic joins OpenAI in reaping the benefits of leadership in the artificial intelligence space, receiving immense sums from the tech giants that couldn't move fast enough themselves. A byword for the age: Those who can, build; those who can't, invest.
The funding deal, according to sources familiar cited by The Wall Street Journal, reportedly involves $500 million now and up to $1.5 billion later, though subject to what, if any, timing or conditions is unclear. I've asked Anthropic for comment on the matter.
It recalls — though it does not quite match — Microsoft's enormous investment in OpenAI early this year. But with Amazon committing to as much as $4 billion to Anthropic, the funding gap is probably more theoretical than practical.
The Google investment is just the latest in a developing proxy war between rival companies with a limited number of champions to back. Though all these companies are powerful and expert in many areas of technology, the simple fact is none of them would be able to stand up a credible competitor to either OpenAI or Anthropic in the area of large language models. And since everyone is also betting that LLMs are going to upend their business models and become crucial components of any future tech platform, they can't afford to not have at least partial ownership of the leaders in the space.
They have more than money, as well: It would be similarly difficult for the AI startups (though one may well question that title now) to stand up the infrastructure needed to build and deploy these AI models at the scales required to operate profitably. So the deals also involve things like compute credits and mutual aid.
Price Momentum
GOOGL is trading in the middle of its 52-week range and above its 200-day simple moving average. Investors are still evaluating the share price, but the stock still appears to have some upward momentum. This is a positive sign for the stock's future value.

GOOGL, SELL, 7.67% PROFITShort selling NASDAQ:GOOGL on 10/24/2023 at market close and closed the position on 10/25/2023 at market open. Net 7.67% profit.

Wave analysis of GoogI think we are currently on the C-wave (corrective wave) on the larger trend. I sold some shares of Goog at around 140usd and took profit at 121usd. That's because I am expecting a retracement to around 130 - 136usd from the current price of 120usd.
I may re-enter at this price range. Ultimately, I expect prices to fall below 80usd.
I will update you if my bias changes.
