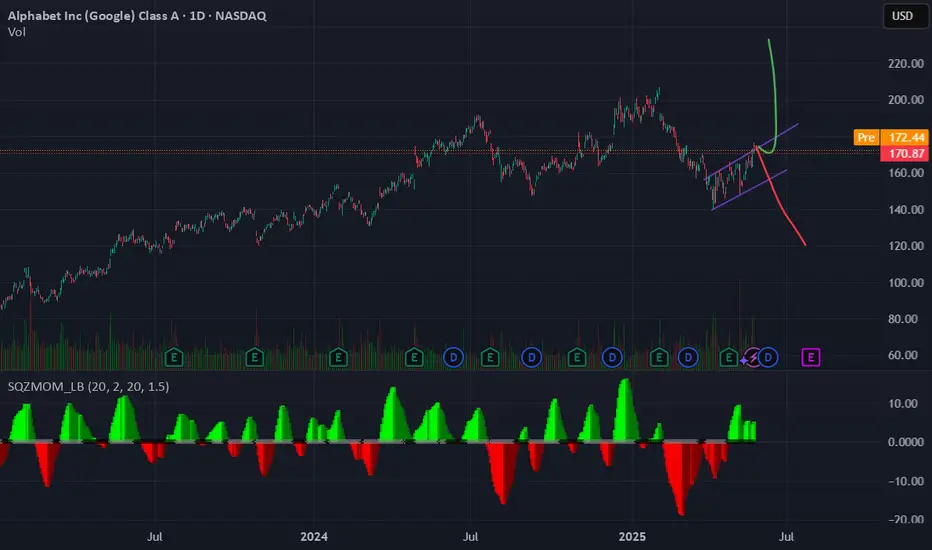
GOOG In Trouble!I first started warning about GOOG back on March 18, 2025
Since GOOG has formed this big bear flag outside the structure in the middle of nowhere.
This is an indication of more weakness to come!
GTF out is in order for bulls. It is better to be out of the market wishing you were in and then in the market wishing you were out!
I can only provide the setup. The rest is up to you.
Click like, follow, for more. Let's get to 5,000 followers.
GOOG trade ideas

Google LongsLong term trend line on Google showing has been broken during the entire market crash.
It seems to have re entered trend channel and may continue to 182.5-220 range in the short term future.
Bullish on this stock, as often the current court case with it will more than likely spark strong buyers and the price is now very cheap.
Best of luck;
Bullish on Google.

Bullish Entry at 167.5 "GOOG"After a run up from 150 to 178, GOOG has almost retraced to 0.382 Fib level. Seems like a good entry from short- and long-term perspective.

Go GOOGLE: Potential Fake Bearish H&S PatternTechnicals:
I have my own way of seeing the markets technically. Currently, on a weekly and daily chart, it appears that Google has a Bearish Head and Shoulders Pattern.
The last time that I checked, it was a fake weekly bearish Head and Shoulders Pattern.
Weekly:
This weekly bearish H&S pattern will fail! But if I am wrong, I am ready with an order at 136. It doesn't matter.
Daily chart:
Commentary:
There is a higher probability that the market for Google is set to pivot this month in June 2025 from the current 160 levels to all the way to 208.70. Google will make all-time highs above 208.70 by end of September 2025; three months from now.

$141 Stop, $207 Target — Bullish Setup on GOOGL with 1.4RMarket Context
Alphabet Inc. (GOOGL) is showing renewed bullish momentum on the 2-week chart. After a healthy correction earlier in the year, price action is now turning decisively upward, reclaiming its long-term trendline and bouncing off a major support level. This setup suggests a shift in market sentiment from consolidation to breakout mode, with significant upside potential.
Key Technical Levels
• Key Support – $151.90
This zone has acted as a major demand level and was tested multiple times. The recent bounce from here reaffirms its strength and underscores the market’s willingness to buy dips at this level.
• Stop Loss – $141.49
Positioned just below the Key Support, this stop loss accounts for volatility while protecting against a full breakdown. A close below this level would invalidate the bullish thesis.
• Resistance Level 1 (TP1) – $191.91
This price level marks a prior swing high and represents the first bullish target.
• Resistance Level 2 (TP2) – $207.32
A clear breakout beyond TP1 sets up the path toward this higher resistance, which also aligns with historical supply from mid-2021.
• Trendline Reclaim
The multi-year ascending trendline, breached temporarily, has now been reclaimed with conviction — a strong bullish signal on higher timeframes.
Trade Setup
• Entry Zone: $168.00 – $169.00
• Take Profit 1 (TP1): $191.91 (approx. 14% upside)
• Take Profit 2 (TP2): $207.32 (approx. 23% upside)
• Stop Loss: $141.49 (just below Key Support)
• Risk–Reward Ratio: Approximately 1.43
Price Action & Trend Confirmation
After establishing a series of higher lows, GOOGL has rebounded from the $151.90 zone with strength, forming a bullish engulfing candle on the 2W chart. This move brought the price back above the long-term trendline — a textbook bullish signal when viewed on a macro timescale. The structure now favors trend continuation, especially if the price holds above the $168–$170 zone in the short term.
Risk Management and Strategy
The stop loss below $151.90 is deliberately placed at $141.49 to avoid premature exit from minor volatility. This level is safely beneath the most recent swing low and gives the trade breathing room to develop. A partial exit at TP1 locks in gains while preserving capital for the extended move to TP2, where major resistance could trigger broader market attention.
Conclusion
GOOGL is setting up for a high-probability breakout from a clean technical base. With the price respecting long-term support, reclaiming the trendline, and establishing bullish momentum, the path of least resistance is upward. The trade offers a solid reward-to-risk profile and aligns with institutional-style setups often seen prior to extended rallies.
In short: GOOGL looks ready to move, and this is a setup bulls won’t want to ignore.

GOOGL Coiling Under Gamma Ceiling – Big Break or Fade Ahead?
🔍 GOOGL GEX Daily View (Options Sentiment Outlook)
Alphabet ( NASDAQ:GOOGL ) just closed around $171.14, slipping slightly from highs, and sitting in a tight wedge under major call walls at 172.5 → 175 → 180. The GEX structure shows bulls are pressing, but dealers are hedging hard into those gamma ceilings.
What GEX Tells Us:
* 🟢 Call-heavy structure above, with strong resistance at 172.5 → 175 → 180.
* 🔻 Slight GEX compression below with put wall at 162.5 and real support around 160 (–10.17% GEX zone).
* 🧊 IVR at 22.6, options are relatively cheap — perfect for low-cost directional trades.
💡 Option Trade Ideas (GEX Playbook):
* Bullish: If GOOGL breaks over 173, consider Jul 19 175c or 172.5/180 debit spread — targeting upside gamma momentum.
* Bearish: If it rejects 172.5 and loses 170, take Jul 19 167.5p or 170p/160p spread — dealers could accelerate downside below key levels.
Key Decision Zone: 170–173
Gamma resistance thick above, but IV is low enough to swing both sides with small risk.
🕵️♂️ 1H Chart Structure (Swing + Intraday Bias)
On the hourly, GOOGL broke structure briefly and swept liquidity under 167.6 BOS, then bounced hard into Friday close — forming a nice CHoCH to the upside with buyers stepping in.
Notables from the 1H chart:
* ✅ Early BOS + CHoCH combo = short-term bullish bias.
* 📦 Price sitting just below SMC supply zone at 172.5–173 — decision point here.
* 📉 Wedge forming with lower highs — needs a catalyst to pop.
📈 Swing Setup:
* Long on clean break + retest of 172.5, target 175 → 180. Stop under 170.
* Short if rejection confirms at 172.5 and we break back below 170.25, target 167.5 then 162.
📊 Intraday Plan:
* AM rejection near 172.5 = scalp short to 170.
* Bounce off 170–170.25 = scalp long into 172 area — just don’t chase middle.
Bias = cautiously bullish. This could pop if market supports, but still in a supply zone.
🧠 Final Thoughts
GOOGL is coiled just under gamma ceilings, with IV low and demand zones still holding. This is one of those setups where waiting for the breakout or clean rejection gives better RR than anticipating too early. Gamma compression means a breakout could be explosive — either direction.
⚠️ Disclaimer:
This is educational commentary only. Always do your own research and manage your risk appropriately before trading.

GOOGL JUN 2025 GOOGL Technical Analysis (May 31, 2025)
GOOGL remains in a bullish trend with key upside targets:
Main target: 185 (gap resistance)
Intermediate resistance: 180
Immediate support at 170 (distribution zone)
Critical support: 160 (stop-loss level)
If 160 breaks, next key supports are at 150, 140 (institutional buy zone 4B), and 130 (weekly support).
As long as price holds the ascending blue trendline, momentum favors the upside. A confirmed breakout above 180 could trigger a gap fill toward 200.

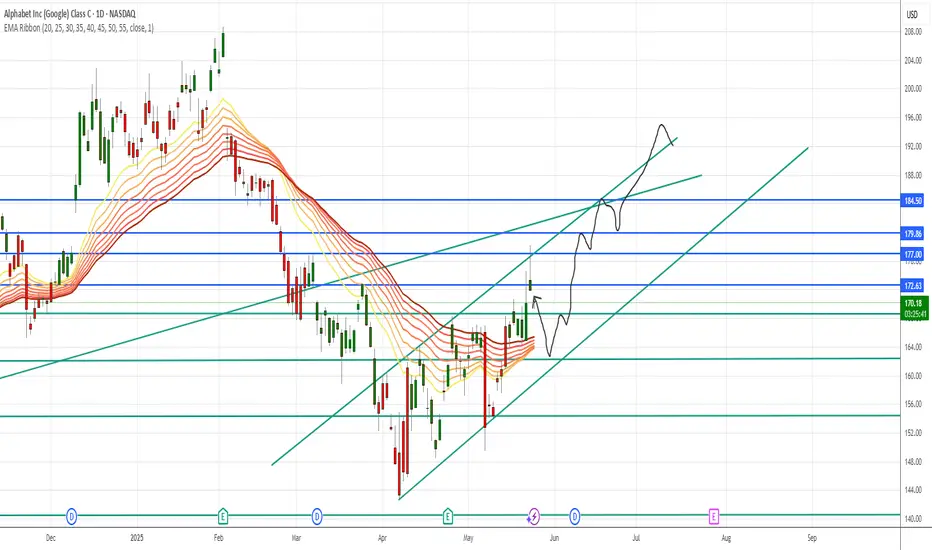
GOOGLE Repeating 2024 pattern and eyes $197.00Alphabet Inc. (GOOG) has established a Channel Up pattern since the (near) 1W MA200 (orange trend-line) rebound. With the 1D MA50 (blue trend-line) now acting as a Support, this pattern resembles the Channel Up formations that emerged in 2024.
Both in terms of 1W RSI and pure price action alike, we are in a similar consolidation level as November and April 2024. Both patterns peaked after similar rallies (+40.60% and +46.23% respectively), so the minimum Target we are expecting on the medium-term is $197.00.
-------------------------------------------------------------------------------
** Please LIKE 👍, FOLLOW ✅, SHARE 🙌 and COMMENT ✍ if you enjoy this idea! Also share your ideas and charts in the comments section below! This is best way to keep it relevant, support us, keep the content here free and allow the idea to reach as many people as possible. **
-------------------------------------------------------------------------------
💸💸💸💸💸💸
👇 👇 👇 👇 👇 👇

$GOOGL laggard long setupSimilar to my analysis on AAPL, I also think Google looks good for a long. I could see the possibility of a pullback down to support(s), but then that would setup a decent long up to $190+.
The structure looks like a bottom and many of the other Mag7 stocks have seen big runs, I think Google is likely a laggard and should move up to the resistances in the coming weeks.
A loss of the supports on the downside would invalidate the idea.

GOOG making moves to the upsideGOOG is back to trending up. by the time DOJ states no issues this will fly above 220
Google LongIt appears we are still in a buy phase on Google and it is ready to break above resistance, with targets of 182.50-210. This is based off the daily MACD still showing buy signal.

I think is green pathI know there is some bearflag as continuation in the overall tendency, but I think can try ATH again (green path) as Google is a AI gigant.
Fundamentas solid, chart is recovering nicely.
Let's see
GOOGL Long HereCouple setups to long here
Wider stop loss is safer while tighter stop loss give 1:5 risk to reward
Half % risk of trading account or less on tighter stop loss play is prudent

GOOG back under 150Been following for a couple days and potentially just got confirmation that w-3 of W-(C) is now under way with the big candle coming out. A new low will make that more probable.

$GOOGL the pattern is there, target $152, short setup.NASDAQ:GOOGL You tell me. This looks so ready to go back below $150. My target is $152. I am entering puts right now with a strike price of $150 for 6/20 starting at $1.33 entry. I will add some on a push towards $167-$168. I will give up if it pushes through or holds at $170. This just looks to good TECHNICALLY in my opinion. I will keep you updated. I am willing to watch this position go down 65% where I will consider selling; looking at price and time to expiration. We are not out of the weeds yet when it comes to political rhetoric regarding tariffs even though this name shouldn't be affected by such because it is software, nothing physical but when the idea of tariffs are spewed the market as a whole reacts in negatively.
WSL.

$GOOGL - $185 Calls - September 19, 2025Trend line strategy with entry after bounce and take profits at fib levels - 176, 192, 206

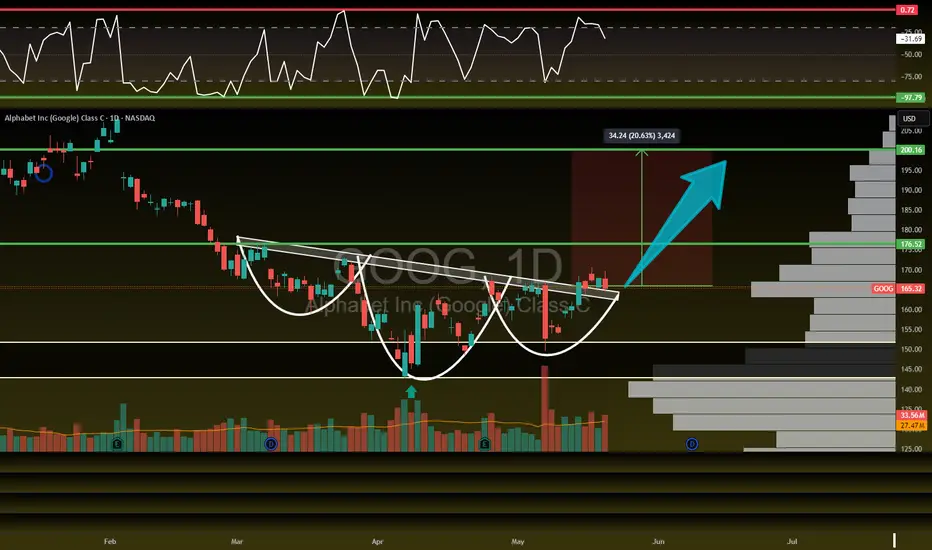
Google primed for a 20% move!NASDAQ:GOOG NASDAQ:GOOGL looks COILED! 🚀
Currently retesting Inverse H&S breakout and H5_S Indicator here.
Bounce will lead us too...🎯$176.52📏$200.16
- Volume shelf launch
- Bullish WR%
- Bullish weekly uptrend
- Severely undervalued
Alphabet Stock Maintains a Consistent Upward ChannelOver the past five trading sessions, Alphabet's (Google) stock has managed to sustain a moderate bullish bias, with a gain of over 4%, as the price has settled around the $170 level. So far, the stock has avoided significant pullbacks amid recent announcements of new integrations and advancements in artificial intelligence within the Google ecosystem.
On one hand, the company announced the integration of AI into its search engine, powered by its Gemini model, along with the introduction of a new “Agent Mode”—a feature that allows users to delegate complex tasks for the AI to handle autonomously. These announcements have been well received by the market, as they reinforce Alphabet’s commitment to innovation and maintaining a strong user base. If these new projects generate solid value, they could be crucial in sustaining buying pressure on the stock.
Bullish Channel Remains Intact
Since April 7, a consistent ascending channel has been forming in the stock’s price action. So far, recent bearish corrections have been insufficient to reverse the overall short-term trend. As long as the stock stays above the $170 level, the bullish bias is likely to remain intact, potentially extending the duration of the current upward structure.
ADX
The ADX line has shown a notable decline, approaching the neutral 20 level. This suggests that recent price movements are losing directional strength, possibly due to the price facing a nearby resistance zone.
RSI
The RSI remains above the neutral 50 level, indicating that buying momentum still dominates in the short term.
Key Levels:
$170: Current barrier, coinciding with a zone of indecision observed over the past several weeks. Sustained bullish moves above this level could reinforce buying sentiment and strengthen the current upward channel.
$175: Distant resistance aligned with the 100- and 200-period moving averages. A breakout above this area could lead to a steeper and stronger short-term uptrend.
$160: Nearby support, marking the lower boundary of the ascending channel. A break below this level could jeopardize the existing bullish formation.
Written by Julian Pineda, CFA – Market Analyst

Google is about to rise by atleast 10% in coming days!I expect Google share price to rise by atleast 10% within the next 2 weeks.
Reasons;
Monthly is massively bullish.
Weekly is also bullish.
Daily is also bullish.

GOOGLE WEEKLY BEARFLAG Looks like NASDAQ:GOOGL is the weakest ticker among the MAGs in the current bull run from the 4800s bottom. If this bearflag works out, 100-120 is the target.

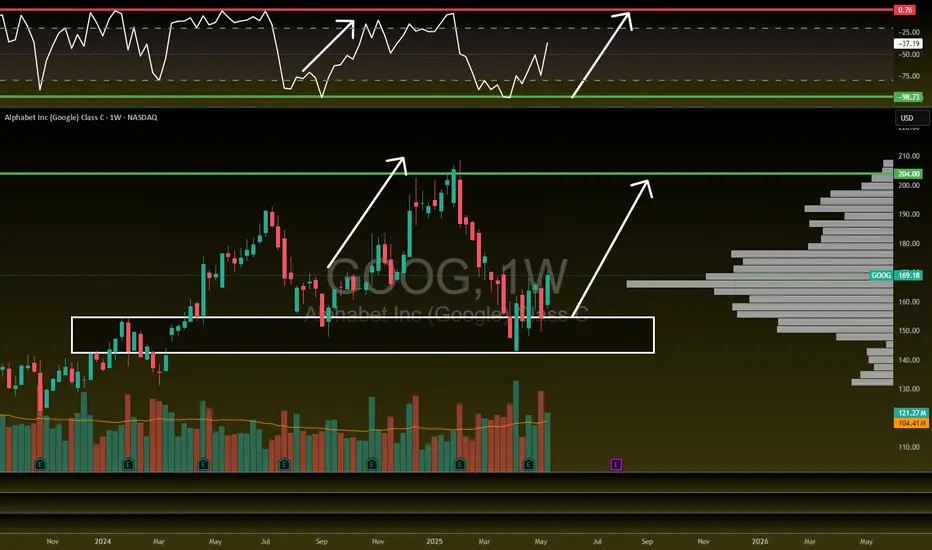
Google to $200!NASDAQ:GOOG NASDAQ:GOOGL
We are uptrending back to ATHs on Google here after they have lagged this whole rally and are the CHEAPEST MAG 7 STOCK!
- Volume shelf launch
- Rising Wr%
- Bouncing off key S/R zone
- H5 Indicator is about to flip to green and make a bullish cross
- Volume is climbing
- Bullish engulfing candle
- Daily looks great as well
Target is $200
Google LongFinancials look good
technical indicators show long signals
positional trade based on chart pattern

$GOOG Trade Alert! 20% Upside🚨 H5 Trade Alert: NASDAQ:GOOGL NASDAQ:GOOG
PT: $176.52 🎯
MM: $200 📏 by July 29th ⏲️
- Green H5 Indicator
- Inverse H&S Breakout
- Volume Shelf Launch
- Increasing Volume
- Lagging Rally
- Cheapest MAG7
- Weekly Trend Rising
Not financial advice
