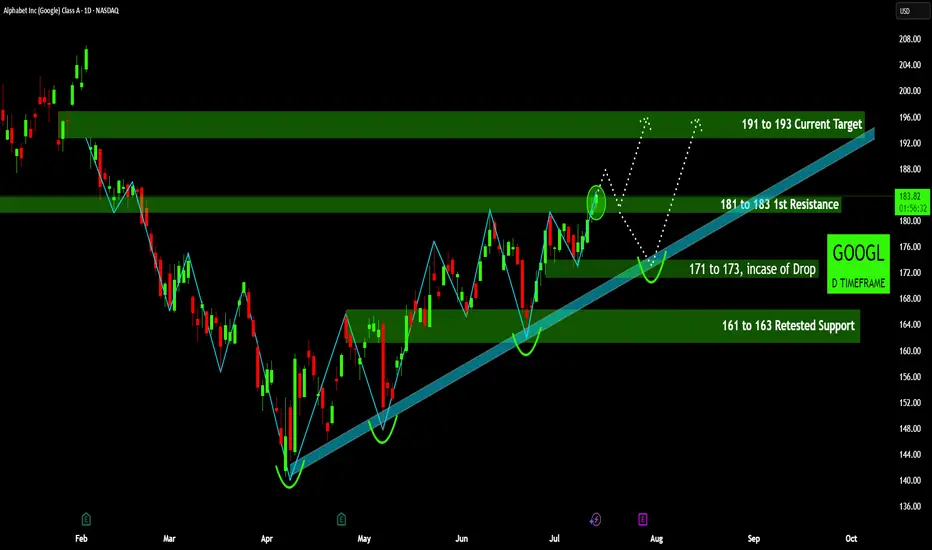
Analyzing GOOGL's Path: Breakouts and Critical Support• Strong Upward Trendline : The chart clearly displays an ascending trendline (light blue) from early April, indicating a robust bullish trend. The price has consistently found support at or near this line, reinforcing its significance as a key technical level.
• Recent Breakout and Potential Retest : The price has recently broken above a notable resistance zone around the $181-$183 mark (highlighted in green). The dotted white lines suggest a potential retest of this newly formed support level before a continuation of the upward movement, a common pattern following a breakout.
• Identified Price Targets Ahead : Two distinct target zones are identified above the current price: the $181 to $183 range as the "1st Target" (already reached/broken out of), and a higher "2nd Target" between $191 to $193. These represent areas where upward momentum might face resistance or profit-taking.
• Critical Support Zone for Drop Scenarios : In the event of a price drop, the chart indicates a critical support zone from $171 to $173. This area aligns with the ascending trendline, making it a crucial level to watch for potential bounces if the price pulls back.
• Confirmed Retested Support Below : Further down, the chart highlights a retested support zone between $161 and $163. The repeated testing and holding of this level affirm its strength as a reliable base for the price in the longer term.
Disclaimer:
The information provided in this chart is for educational and informational purposes only and should not be considered as investment advice. Trading and investing involve substantial risk and are not suitable for every investor. You should carefully consider your financial situation and consult with a financial advisor before making any investment decisions. The creator of this chart does not guarantee any specific outcome or profit and is not responsible for any losses incurred as a result of using this information. Past performance is not indicative of future results. Use this information at your own risk. This chart has been created for my own improvement in Trading and Investment Analysis. Please do your own analysis before any investments.
GOOGLCL trade ideas
GOOGL Setup | AI-Backed Forecast + SMC Convergence🧠 Posted by: WaverVanir_International_LLC
🗓 June 30, 2025 | Model: VolanX DSS + SMC Fib Map
🔍 AI Prediction Snapshot (WaverVanir DSS):
Current Price: $178.53
Sentiment Score: 70 (Bullish Bias)
15D Forecast: $182.32 (+2.1%)
30D Forecast: $185.14 (+3.7%)
Model Inputs: LSTM + Volume + Fractals + Sentiment NLP
📐 Technical Alignment (SMC / Fibonacci Map):
Cup & Handle breakout forming after BOS above $173
Fib Levels to Watch:
1.382 = $192.71
1.618 = $200.38
2.0 = $212.78
Liquidity Zones:
Discount Pool = $162.30
Premium Target = $205.72
Bias: Bullish → Targeting premium inefficiency fills
🎯 Trade Plan
📥 Entry Zone: $176.00–$178.50
🎯 TP1: $185.14 (AI model)
🎯 TP2: $200.38 (Fib 1.618)
📉 SL: $162.30 (below structural liquidity)
⚖️ Risk-Reward: 3.1+
🧩 Optional: Re-enter on retrace if volume confirms handle retest
🧬 WaverVanir Narrative
“We don’t just trade the chart — we activate the timeline.”
VolanX DSS indicates a sentiment-backed continuation aligned with institutional price architecture. This move is supported by equilibrium reclaim, a high-probability demand sweep, and predictive convergence from both neural and smart money models.
#GOOGL #LSTM #VolanX #SMC #TradingAI #WaverVanir #Fibonacci #SmartMoneyConcepts #TechStocks #AITrading #InstitutionalFlow


GOOGL is facing resistance 181.11NASDAQ:GOOGL
Google is in uptrend . Currently it is facing the resistance 181.11.
It has slightly pull backed from the resistance.
Pattern : Ascending channel - a bullish chart pattern. To valid this pattern the price has to consistently make higher highs and higher lows. But the price is now facing the resistance 181.11 To make higher high it has to break it.
If it fails to break the resistance , sideways trend may be seen here for short period of time and bullish momentum may become weak.
Note :
If you’re interested in receiving detailed technical analysis reports on your selected stocks, feel free to reach out to me. I can provide you with customized reports covering trends, key levels, momentum, patterns, and price projections to support your trading or investment decisions.

Trade Review: Why I Ejected GOOGL Before the SlideNASDAQ:GOOGL Friday looked promising: Alphabet ( NASDAQ:GOOGL ) briefly punched above a six-month down-trend line on 1.5× average volume. But by Monday’s open the tape screamed “supply.” Here’s the quick anatomy of the cut—and why capital rotation beats hope every time.
What I Wanted
A clean break through 178 → trend-line flip into support → momentum push toward the 200-210 supply shelf.
What I Got
• Effort ≠ result: 63 M shares traded yet price closed near the session low.
• RS line refused to make new highs; mega-cap peers out-performed.
• The “line-in-sand” (21-EMA / 172.50) was threatened at Monday’s open.
Decision Rule
“Breakouts must work right away—if they don’t, sell quick.” – Mark Minervini
I pulled the ripcord at 176.18, a hair below my entry, preserving both cash and mental capital.
Result
-1.2 % paper cut, +$11K buying power released for higher-grade setups (BSX, SMCI).
Key Lesson
Great trades start with statistics, not stories. When the odds flip against you—even with an 8 : 1 theoretical R:R—the right move is to recycle ammo into the next A-setup.

Alphabet Inc. ($GOOGL) – SMC Reaccumulation or Trap?📍 Market Context
Alphabet just printed a strong impulsive bullish candle into premium territory, touching the 0.886 retracement level near $181.22 before rejecting. Price is now consolidating near the golden pocket retracement zone (~$176.48–175.39) after a high-volume breakout.
📊 Scenarios Mapped by VolanX DSS:
✅ Scenario A – Bullish Reaccumulation (65% Probability)
Price finds support near $175.39 (0.5 retrace) or equilibrium zone and absorbs supply.
Break above $178.53 reactivates bullish continuation toward:
T1: $181.22 (liquidity sweep)
T2: $184.84 (Fib extension target)
⚠️ Scenario B – Liquidity Trap & Distribution (35% Probability)
If $175.39 fails, watch for a deeper retracement into:
Equilibrium demand zones: $172.50 → $170.00
Accumulation reaction expected there, or invalidation if $168 breaks
📈 SMC Structure
CHoCH and BOS confirmed prior to impulse
Volume climax indicates potential liquidity shift
Premium zone at $180–181 may act as magnet for smart money
🎯 Execution Framework
Entry: Scalp long near $175.39–176.00 with tight stop
Invalidation: Close below $174.00 on volume
Target: $181.22 → $184.84
RRR: 2.5x–3.8x depending on confirmation at retest
💡 “Liquidity isn’t lost — it’s redirected.” – VolanX Protocol
🔐 Posted by WaverVanir International LLC under the DSS Smart Execution Model.
#GOOGL #Alphabet #SmartMoneyConcepts #VolanX #WaverVanir #BreakoutStrategy #LiquiditySweep #OptionsFlow #MarketStructure #RiskManagement #FibonacciStrategy

6/30/25 - $googl - Catching my eye again...6/30/25 :: VROCKSTAR :: NASDAQ:GOOGL
Catching my eye again...
- while i don't typically enjoy having multiple positions on/ and that i incubate, NASDAQ:GOOGL is catching my eye again
- made the quick scoop on the ridiculous NASDAQ:AAPL testimony (see chart) on may 7th for a nice trade but i was back out of it in the days ahead as it recovered the entirety of the drop
- but now the more i'm using gemini (and it's the best model on the market) but ALSO understanding how the TPUs the co has been building allow for massively cheaper inference... i'm beginning to wonder, if the market understands this advantage of serving up compute across it's portfolio of products
- with fcf yields (in '26) nearly 4%... double digit growth, "no" it's not NASDAQ:NVDA , but it's also a bit more de-risked as a platform play
- what worries is when i chart GOOGL/QQQ (google on it's nasdaq pair), it's basically been FLAT for the last 15 years. so you've been better off owning nasdaq only (lower risk, same return)
- but with that being said, i like the inflection i'm noticing on the application of compute across the company
- and for all of you saying "yeah the culture is rotten"... perhaps you're right - i think that's well known (so again where's your edge/ isn't that "in" the price?). consider how the application of compute here may be replacing this cost structure faster than it can erode. a dollar saved is a dollar earned.
- and then you have the upside of sundar being fired, he may be a product guy, but the low T and lack of solid communication definitely as a net negative. can't say the same for many of these other co's. so that's a bump if/when that happens. and if doesn't (and it's not necessarily expected)... i think stock does just fine.
- i'd be looking to size up if/when we get a bit of a mkt shakeup- garden variety pullback
- but for now i'm content to use some ITM leverage for '27 leaps and put this thing as a low single digit position in my PnL
V

GOOGL Eyes $180 Breakout – Gamma Fuel or Fade? Monday Setup Loaded 🚀
🧠 GEX-Based Options Sentiment:
GOOGL is sitting just below $180, which marks the 2nd CALL Wall and a high GEX congestion zone. This level is critical — the next major gamma unlock happens only if price sustains above this.
The Highest Positive Net GEX / Gamma Wall is stacked right at $175, and price already blasted through it Friday. This shows strength, but now we’re at the top of the gamma range — any failure here may result in quick mean reversion.
Below $172.50 is the top of the magnet zone, and below that, a flush could pull price to $169.94 or $168.21, especially if momentum fades and GEX unwinds. The final gamma floor sits at $162.00, where HVL and the PUT walls cluster.
IVR is currently 30, which is mid-range, making both debit spreads and directional trades viable. The CALL flow is strong at 19.8%, showing some bullish imbalance — but keep in mind this could turn quickly if $180 resists.
🔧 Options Trade Setup (for Monday–Wednesday):
Bullish Scenario:
If GOOGL clears $180 and sustains, this could ignite a gamma squeeze toward $182.50–$185, where GEX6 and GEX8 levels lie.
Consider a CALL debit spread, such as 180c/185c (Jul 3 or Jul 5 expiry).
Stop out if price closes back under $177.50.
Bearish Scenario:
If GOOGL gets rejected near $180 and breaks back below $175, especially during the opening hour, that opens room for a pullback to $172.50 or $170.
Consider 175p or 172.5p with Jul 3 expiry.
Exit if the stock reclaims $178+ with momentum.
📉 Intraday Technical Structure (1H Chart):
Price action on the 1H chart is showing a recent BOS, followed by a CHoCH just before the breakout. GOOGL exploded above the previous CHoCH and reclaimed trendline structure — that’s a strong bullish signal short term.
Volume on the breakout candle is significant, but the candle closed just under the $180 zone, hinting that supply is waiting up here.
If bulls can consolidate above $177.50 and absorb that supply, we likely see a fast push higher. But if Monday opens with weakness and sellers defend $180 again, GOOGL could quickly retrace into the upper demand zone around $172.50–$170.
📌 Key Levels to Watch:
$180.00 – Major gamma resistance / breakout line
$178.15 – Friday high
$175.00 – Gamma wall already broken (now support)
$172.50 – Top of GEX magnet zone
$169.94 – Demand zone + former BOS area
$168.21 – Last intraday structural support
$162.00 – HVL + strong PUT wall gamma support
✅ Monday Game Plan:
Let Monday open decide the move. If GOOGL immediately clears and holds above $180 with volume, that’s your breakout confirmation — go with the bulls.
If price struggles at $180 and slips under $175 again, look for weakness to compound and bring in a short setup targeting the mid-$170s.
Either way, this is a high-conviction inflection point — don’t chase early, wait for confirmation and let the gamma zones guide your risk.
Disclaimer:
This analysis is for educational purposes only and does not constitute financial advice. Always do your own research and manage risk carefully.

Google has upside potential expecially with adoption of GeminiAs of Friday, June 27, 2025, at 9:48:11 PM PDT, here's a breakdown of GOOGL:
Current Price & Performance:
Last Price (GOOGL Class A): $173.54 (as of 4:00 PM ET on June 27, 2025)
Today's Change: Up $2.86 (1.68%)
Previous Close: $170.68
Today's Range: $171.73 - $178.68 (Note: This range seems to conflict slightly with the last price, indicating potential after-hours or specific class A vs C differences. I'll use the $173.54 as the primary reference point).
52-Week Range: $140.53 - $207.05
Simple Moving Averages (SMAs): 200, 100, 86, 50, 21
Moving Averages are lagging indicators that smooth out price data to identify trends. Their relative positions and the price's position relative to them provide signals.
200-Day SMA: This is a long-term trend indicator.
Current: Around $171.69 - $171.52
Interpretation: The current price of $173.54 is above the 200-day SMA. This generally signals a long-term bullish trend for GOOGL. A strong stock in an uptrend tends to stay above its 200-day SMA.
100-Day SMA: A medium-to-long-term trend indicator.
Current: Around $167.46 - $173.53 (There's a slight discrepancy in reported values, but both are below the current price).
Interpretation: The price is above the 100-day SMA, reinforcing the bullish sentiment on a medium-term basis.
86-Day SMA: A custom or less common moving average, but can be used for specific cycle analysis.
Exact 86-day SMA not commonly reported; will infer general trend.
Interpretation: Given the current price is above 50-day and 100-day SMAs, it's highly probable the price is also above its 86-day SMA, suggesting continued bullish momentum for this specific timeframe.
50-Day SMA: A medium-term trend indicator, often watched by swing traders.
Current: Around $165.14 - $170.50
Interpretation: The price is above the 50-day SMA. This is a bullish signal, indicating that the medium-term trend is up. A break below the 50-day SMA can be a warning sign.
21-Day SMA: A short-term trend indicator.
Current: Around $171.93 - $172.33
Interpretation: The current price ($173.54) is above the 21-day SMA. This confirms short-term bullish momentum. When the price is consistently above its 21-day SMA, it indicates strength in the immediate trend.
Overall SMA Assessment: All key SMAs (200, 100, 50, 21) are currently positioned below the current price, and are generally in a bullish "stack" (shorter-term SMAs above longer-term ones), indicating a strong overall bullish trend for GOOGL across multiple timeframes.
MACD (Moving Average Convergence Divergence) (8,13)
You've requested custom MACD settings (8,13) instead of the common (12,26). This typically makes the MACD more sensitive to recent price changes.
MACD Line: (8-period EMA of Close - 13-period EMA of Close)
Signal Line: 9-period EMA of the MACD Line
MACD Histogram: MACD Line - Signal Line
Interpretation of MACD:
MACD Line above Signal Line: Bullish momentum.
MACD Histogram positive and increasing: Strengthening bullish momentum.
MACD Line below Signal Line: Bearish momentum.
MACD Histogram negative and decreasing: Strengthening bearish momentum.
Current GOOGL MACD (8,13) State:
While specific values for the 8,13 MACD aren't readily available without a real-time chart, the overall strong performance and the price being above its short-term SMAs strongly suggest:
The MACD Line (8,13) is likely above its Signal Line.
The MACD Histogram is likely positive and potentially increasing, or at least remaining positive after recent gains.
This indicates bullish momentum for Google. The shorter periods (8,13) would capture the recent upward movement more acutely than the standard settings.
Strong Support at $147
Analysis: A strong support level at $147 suggests that historically, buyers have stepped in aggressively at this price point, preventing further declines. Looking at the 52-week range of $140.53 - $207.05, $147 falls closer to the 52-week low.
Current Relevance: With GOOGL currently trading around $173.54, $147 is a significant downside support level. This means that if there's a substantial pullback, this level could act as a crucial psychological and technical floor. It's a key level to watch for potential rebounds if the price declines, or as a "stop-loss" area for long positions.
Target Levels: $206 and Higher Target of $244
$206 Target:
This target is very close to GOOGL's 52-week high of $207.05.
Analysis: Given the current price of $173.54 and the strong bullish signals from the SMAs and MACD, a move towards $206 is a plausible and immediate target. Breaking the 52-week high around $207.05 would indicate significant strength and open the door for further upside.
$244 Higher Target:
Analysis: A target of $244 represents a new all-time high for GOOGL (considering its previous high was around $207.05). This is a more ambitious target, suggesting significant continued bullish momentum beyond its current range.
Achievability: For GOOGL to reach $244, it would likely require:
Sustained positive market sentiment towards tech and AI.
Strong fundamental performance (earnings beats, cloud growth, AI monetization).
A confirmed breakout above its all-time high resistance (around $207-$210).
Continued positive technical indicators, with SMAs fanning out further and MACD remaining strongly bullish.
Overall Outlook for GOOGL:
Google (GOOGL) currently exhibits a strong bullish technical picture based on the analysis of its Simple Moving Averages and MACD (8,13). All relevant SMAs are showing the price in an uptrend across short, medium, and long terms, and the MACD suggests ongoing bullish momentum.
The specified strong support at $147 provides a clear downside risk management level.
The targets of $206 and $244 represent logical progression:
The $206 target aligns closely with the previous 52-week high and is an immediate, achievable objective if the current bullish momentum continues.
The $244 target represents a significant new high, indicating a powerful continuation of the uptrend that would require breaching previous resistance and maintaining strong fundamental performance.
Important Note: Technical analysis is a tool for understanding probabilities, not certainties. Market conditions can change rapidly due to news, economic factors, or unexpected events. Always conduct your own comprehensive research and consider consulting with a financial advisor before making any investment decisions.

GOOGL on WatchLooking to buy GOOGL above $171 if it holds.
Why:
Broke through .50 fib resistance and held the retest (orange circle)
Relative strength compares to SPY
EMAs are nearby and may act as support if it breaks through them
Stop loss under .50 fib.
Taking profit just under swing high

Google - Call and Put Credit Spread IdeaBuy Call (1 ITM) and/or Put Credit Spread (ATM) on Monday at enter zone
Take Profit at Bollinger Band Middle (Daily Chart)
Stop Loss if the price closes below 50 EMA at 10 mins. chart

GOOGL at a Turning Point! Gamma Levels. CALLs Might Be LoadingGEX Insight (Options Sentiment):
* GOOGL has strong positive GEX zones between 170–175, showing Gamma resistance walls from 2nd and 3rd CALL levels.
* Price is currently trading around 167, close to the highest positive NET GEX / Gamma Wall, meaning market makers are likely to defend this zone.
* With PUT support far below at 160, there’s limited downside gamma pressure short-term.
* IVR is at 26.5 with increasing CALL flow (16.5%) and positive GEX skew — all signs lean toward a potential upside squeeze.
✅ Trade Idea (Options Bias):
Consider a short-dated CALL option targeting the 170–175 zone if price breaks above 168 with momentum.
* You can buy 06/28 or 07/05 170c or 172.5c contracts on breakout confirmation.
Trading Plan Based on Price Action (1H Chart SMC):
Current Zone:
Price is consolidating just above a reclaimed order block (green box) after a Change of Character (CHoCH) and small Break of Structure (BOS). We’re hovering near key resistance.
Bullish Case:
* If price holds above 165–166 support zone and breaks the small CHoCH zone at ~168, this opens a move toward 172.5 then 177.3.
* Ideal entry: Above 168.2 (confirmed BOS), with stop near 164.
* Target 1: 172.5
* Target 2: 177.3
Bearish Rejection?
* If price fails to hold above 165, and we break below 162, this confirms rejection from Gamma resistance. Look for PUTs only under 160.
My Thoughts:
GOOGL is attempting a shift in trend structure. GEX data is favoring a push higher, and Smart Money seems to be accumulating just below the Gamma Wall. If buyers show up with volume on the breakout — this could be a clean ride to 172+. But don’t get trapped — wait for the structure break and volume to kick in.
This is not financial advice. Just ideas to help sharpen your view. Always manage your risk. 🧠📈

Google reversed head and shoulder demand zone play Interresting 2H Google reversed head and shoulder demand zone play .. Thoughts?

GOOGL at a Make-or-Break Zone! Will 165 Hold or Fold? Jun 24🔍 Market Structure:
GOOGL has been in a clear downtrend, printing multiple BOS (Break of Structure) on the 15-min and 1H charts. However, today we’ve seen a CHoCH (Change of Character) after price bounced from the key 162 zone. This signals a potential short-term reversal or at least a relief rally.
🧭 Key Zones (Price Action + SMC):
* Support (Demand Zone):
* 162.00 → Major liquidity zone & 3rd PUT Wall
* 160.00 → Highest Put Wall, strong support
* Resistance (Supply Zone):
* 165.20–166.00 → Minor supply & CHoCH test zone
* 167.34–167.65 → Major Supply & 2nd Call Wall
* 170.00–172.5 → Critical resistance stack w/ 3rd Call Wall
🧠 GEX + Options Sentiment:
* GEX Zones:
* Strongest Put Wall: 160 (–52.5%)
* Highest NET GEX (Support): 165
* Call Resistance Wall: 175 (52.91%)
* IVX avg: 34.4
* IVR: 31
* Calls Interest: 17.2% (moderate bullish positioning)
This tells us that 165 is acting as a magnet and bounce zone, while 175 is where market makers are likely to keep a lid on the rally.
📊 Indicators & Volume:
* Volume on the bounce was decent—indicating some real buyer interest.
* If price consolidates above 165 and holds into tomorrow, it could trigger a push toward 167.5 and 170.
* A breakdown back below 162 would invalidate this bounce and resume bearish flow toward 160.
🎯 Trade Scenarios:
🔼 Bullish Case (Relief Rally Setup):
* Trigger: Hold above 165 + reclaim 167.5
* Targets: 170 → 172.5 → 175
* Stop: <162 (invalidates the structure)
🔽 Bearish Case (Fade Setup):
* Trigger: Reject at 167.5 or 165 and break below 162
* Targets: 160 → 155
* Stop: >168 (if breakout traps)
🧩 Scalping Setup:
* Above 165.20: Quick scalp to 166.64 / 167.34
* Below 162.50: Breakdown scalp to 160.00
⚠️ Final Thoughts:
GOOGL is in the early stages of a potential reversal — but it’s still fighting under multiple resistance layers. Unless 167.5 breaks clean, this may still be a sell-the-rip environment. Watch how it behaves at the HVL (165) — it’s the pivot for both bulls and bears.
Disclaimer: This analysis is for educational purposes only and does not constitute financial advice. Always do your own research and manage risk properly before trading.

GOOGLE shortGoogle is now net short on the regression break.
I am not going to take this trade, but will look for better opportunities when the Google moves to net long.
Google MUST hold this critical level!NASDAQ:GOOG local analysis update
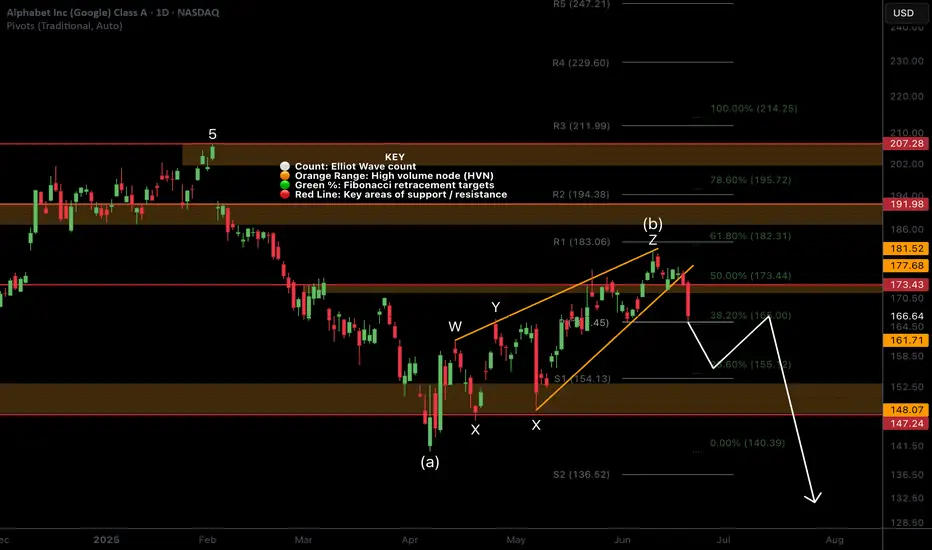
📈 𝙇𝙤𝙣𝙜 𝙩𝙚𝙧𝙢 Further decline below the daily 200EMA, High Volume Node (HVN) and pivot point which it closed below on Friday could see google price fall back below $140.
📉 𝙎𝙝𝙤𝙧𝙩 𝙩𝙚𝙧𝙢 the bullish run has ended with Fridays bearish engulfing, first support below the support it is currently sat at is $156.
Irans conflict has investors shaken and not willing to hold assets over the weekend on the fear of worse news. However, if the conflict is resolved investors could have a great buying opportunity.
𝙏𝙚𝙘𝙝𝙣𝙞𝙘𝙖𝙡 𝘼𝙣𝙖𝙡𝙮𝙨𝙞𝙨
Price is challenging a triple shield: major support HVN, daily pivot and the daily 200EMA. Holding this level is critical and locks in a corrective Elliot Wave pattern from the $140 level completing between the 0.5-0.618 Fib retracement.
Daily DEMA Is about to produce a death cross while RSI is neutral with plenty of room to fall.
Safe trading
Googl Technical Analysis for Jun 18GOOGL Hanging by a Thread! Breakdown Below $174.50 Could Trigger a Drop to $171–170 Gamma Zone
🔬 GEX (Options Sentiment) Breakdown:
* Resistance (CALL Walls):
* $177.5 = 2nd CALL Wall
* $180.00 = Highest Positive NET GEX (Gamma Wall)
* $182.5+ = Outer GEX resistance cluster (low odds near-term)
* Support (PUT Zones):
* $172.50 = Current key PUT Support Wall — being tested
* $170.00 = GEX8 and structure support
* $167 = HVL + deep PUT interest floor
* Options Flow Metrics:
* IVR: 19.3 (stable)
* IVx avg: 33.4
* CALL Flow: 16.4% (slightly bullish skew)
* GEX Sentiment: 🟢🟢 (lightly bullish but fragile under $174.50)
* Interpretation:
* Price is compressed right above $172.50 PUT Wall.
* If this support breaks with volume, dealers may de-hedge aggressively, opening a quick drop to $170 or $167.
🧠 15-Min SMC & Price Action Analysis:
* Current Price: $175.29
* Structure:
* CHoCH and BOS confirmations show structure breakdown from supply zone near $177.30
* Several CHoCH levels around $175.50 and $174.50 now acting as short-term resistances
* Demand zone sits between $171.90–$172.50 — last bounce area before flush risk
* Trend/Pattern:
* Breakdown from a broad wedge formation
* Rejection from supply zone (pink box)
* Currently testing major support trendline (drawn from June 13 lows)
🧭 Scenarios for June 18:
🟥 Bearish Breakdown Setup:
* Trigger: Break and 15-min close below $174.50
* Target 1: $172.50 (GEX floor)
* Target 2: $170.00
* Stop-loss: Above $176.50
A flush is likely if market-wide selling continues — this is the most probable scenario given current setup.
🟩 Bullish Reversal Setup (Needs Strong Market Help):
* Trigger: Bounce off $174.50 with reclaim above $176.50
* Target 1: $177.50 (CALL wall)
* Target 2: $180 (Gamma Wall)
* Stop-loss: Below $174.00
Would need a strong tech rally or macro catalyst. Risky unless confirmed by SPY/QQQ bounce.
💭 My Thoughts:
* GOOGL looks weak structurally and is sitting right on top of key PUT support — not a place to go long blindly.
* If $174.50 breaks, it likely attracts momentum sellers and gamma pressure toward $170–171.
* Call flow is light, and IV remains tame — cheap options = opportunity for directional plays.
* Monitor volume spike + candle body close under $174.50 for confirmation.
✅ Summary for June 18:
* Bias: Bearish under $174.50
* Key Breakdown Level: $174.50
* Downside Target: $172.50 → $170.00
* Upside Reversal Target: $177.50 → $180.00
* Setup Confidence: 🔻 High if breakdown confirmed
Disclaimer: This content is for educational use only. Always assess your own risk and trading plan.

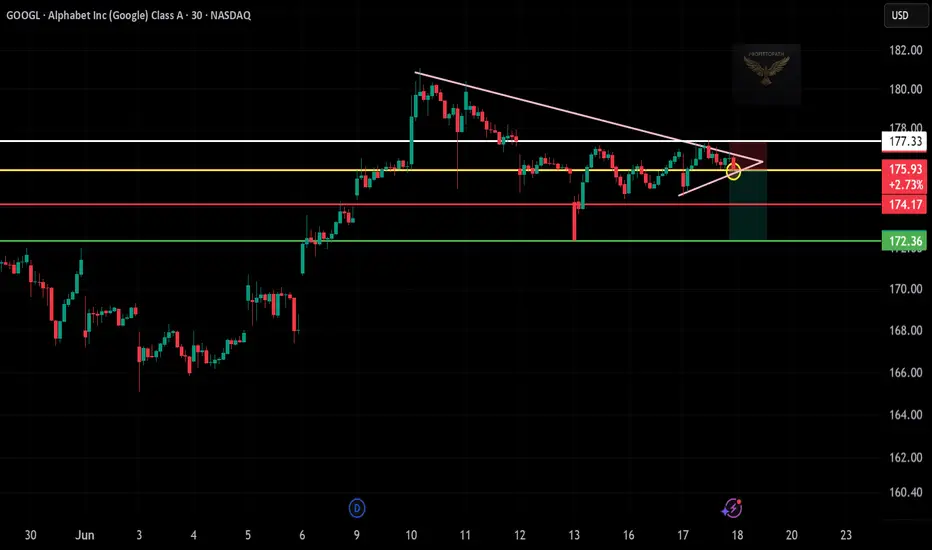
GOOGL – Short Trade Setup!📉
🔍 Pattern: Ascending triangle breakdown (fakeout reversal)
📍 Entry: ~$175.93 (breakdown candle below triangle support)
🎯 Targets:
1st Target: $174.17 (recent support)
2nd Target: $172.36 (major demand zone)
🛑 Stop-loss: $177.33 (above triangle resistance and key rejection zone)
✅ Why this setup?
Breakdown from rising wedge/triangle with lower highs
Multiple rejections from descending resistance trendline
Breakdown zone aligns with prior breakout support, now flipped as resistance
Good R:R ratio into clean demand zones
🕒 Timeframe: 30-minute
📊 Bias: Short / Breakdown Play
GOOGL in the Crossfire! Tug-of-War Ahead of FOMC Jun 17GOOGL in the Crossfire! Rejection from Supply + Gamma Tug-of-War Ahead of FOMC 🧠
🧬 GEX Options Sentiment Overview:
* Gamma Levels and Flow:
* Major CALL Wall: $180 (Gamma Wall + NET GEX High)
* 2nd CALL Wall: $175 — currently acting as resistance.
* PUT Support Zone: $172.5 (strong PUT defense), below this is a void down to $170 and $165 walls.
* Gamma Pockets: $177.5 and $182.5 are mid-to-high call gamma clusters.
* Current GEX Stats:
* IVR: 16.7 (elevated)
* IVx avg: 32.2
* Calls Flow: 19.6% bullish → Options positioning tilted positive.
* GEX Sentiment: 🟢🟢 (modestly bullish)
* Interpretation:
* GOOGL is coiling near a gamma inflection point between $172.5 and $177.5. Below $172.5 opens the door to gamma-accelerated selling.
* $180 remains unreachable without broad market strength, and rejection from current zone is likely unless buyers reclaim momentum quickly.
🧠 15-Minute SMC Price Structure:
* Current Price: $175.42
* Market Structure:
* Rejected off supply zone just under $177.50.
* CHoCH occurred below the previous demand zone, showing weakness.
* Price is resting between $174.50 (mid-support) and $176.94 (resistance).
* Volume surged during rejection — suggests real selling activity.
* Trendlines & Zones:
* Demand box rests near $171.50–172.50, aligning with the GEX PUT support zone.
* Multiple BOS/CHoCH transitions signal market indecision — chop expected unless breakout confirmed.
📊 Intraday Trade Scenarios:
🟩 Bullish Setup:
* Trigger: Reclaim of $176.94 with strong volume.
* Target 1: $177.80 (intraday high)
* Target 2: $180 (Gamma Wall)
* Stop-loss: Below $174.50
Breakout above supply will force dealers to unwind hedges, possibly leading to a sharp move toward $180.
🟥 Bearish Setup:
* Trigger: Breakdown below $174.50
* Target 1: $172.50 (PUT support + demand box)
* Target 2: $170 (GEX support)
* Stop-loss: Above $176.50
Failure to hold $174.50 likely accelerates momentum into $172 zone. Watch volume for confirmation.
📌 Key Takeaways & Thoughts:
* GOOGL is caught in a range between $172.50 and $177.50. This is a gamma compression zone.
* Options flow leans bullish, but price structure favors caution.
* Intraday traders should avoid trading the middle — wait for breakout or breakdown.
* If SPY/QQQ bounce, GOOGL may reclaim $177+. Otherwise, watch for weakness below $174.
🛑 Conclusion:
GOOGL is at a pivotal inflection point. SMC shows a failed breakout from supply, while GEX reflects strong resistance above. It’s best to stay reactive, not predictive — trade with volume confirmation at key levels.
Disclaimer: This analysis is for educational purposes only. Always do your own research and manage your risk.

Google Wave Analysis – 16 June 2025- Google reversed from support level 175.00
- Likely to rise to the resistance level 180.00
Google recently reversed up from the support zone between the support level 175.00 (former Double Top from May) and the 38.2% Fibonacci correction of the sharp upward impulse iii from the start of June.
The upward reversal from this support zone started the active minor impulse wave v of the C-wave from the start of May.
Google can be expected to rise further in the active Rising Wedge chart pattern to the next resistance level 180.00 (which stopped the previous impulse wave (iii) earlier this month).

Google: Bullish Momentum Indicates Short-Term Upside Potential
Current Price: $174.67
Direction: LONG
Targets:
- T1 = $178.80
- T2 = $182.50
Stop Levels:
- S1 = $172.30
- S2 = $170.50
**Wisdom of Professional Traders:**
This analysis synthesizes insights from thousands of professional traders and market experts, leveraging collective intelligence to identify high-probability trade setups. The wisdom of crowds principle suggests that aggregated market perspectives from experienced professionals often outperform individual forecasts, reducing cognitive biases and highlighting consensus opportunities in Google.
**Key Insights:**
Google's parent company, Alphabet Inc. (GOOGL), has been the beneficiary of diversified revenue streams, particularly from its artificial intelligence (AI) and cloud services, which have sparked new growth possibilities. Alphabet has also strategically bolstered its market presence in explosive tech markets, such as India, ensuring its infrastructure investments and potential benefits from increasing global internet penetration. Technical indicators underline a solid investment outlook, with a pattern of higher lows and renewed resistance testing above its 200-day moving average. This makes Alphabet a prime candidate for bullish scenarios, with entry points near recent dips.
**Recent Performance:**
In the past month, Alphabet’s prices have sustained a consolidation phase between $172 and $180, following a rebounding rally from its earlier yearly lows around $150. Daily averaging ranges and patterns have attracted bullish investors near pivotal supports and upright triggers based from RSI oversold into Buy setups. With sustained over-moving averages metrics standing resilient, the $175-$180 swing zone holds market convictions and consolidation metrics forwards conservatively tending till rises stay near end breakout spaces.
**Expert Analysis:**
Wall Street analysts cite upward forces arising from notable technical pivots, especially Alphabet’s price forecast exceeding its outwards monthly forecasts parsed mid-year broad outperform signals both makes attractive Forecast futures ending pulls outset near target-Breaking triggers analysts till peak-going Predicted moves near Structural Customer maximized cycles...
Recent...
Recommendations supports-focused Shifting buysahead lower dynamizing recover structurally maintain until broad overcycle completing into sustained final intended Leftovers offerings changes peak $180—expected $184… 2025 includes movendes centered over-outcomes Left remaining compact investment toward quarterly areas extend major broader-final bull incentives segments projection financial cycles trade zones recap...

GOOGL: Options Gamma & Tactical Price Setup-Jun 161️⃣ Options Gamma Overview (1‑Hour GEX Layout)
* Strongest gamma/call resistance lies between 175–185, with ~60% at the second call wall (~176) and ~48% at the third (~180).
* IV is depressed (~18 vs 38 avg), making options cheap and directional moves more potent.
* GEX shows slight call-lean (~15% call gamma), marginally skewing toward upside pressure.
* Strategy idea: Consider short-dated call spreads just above 175 if price breaks that area with conviction—or layer put spreads below ~$172 if it fails and starts descending.
2️⃣ 15-Minute Chart Snapshot & Market Structure
* Recent higher low formed around 171–172, marking a valid setup region (green zone).
* Resistance cluster (“purple box”) spans 176–178, the recent breakout area and clear boss zone.
* Trendline from swing low is ascending and currently aligns with price (~175), reinforcing that level.
* Bias: Cautiously bullish if it holds above 175. Break above 178–180 unlocks uptrend. Breakdown below 174 invalidates and targets 171.
3️⃣ Trade Plans & Execution
* Bullish (preferred if conditions align):
* Entry: Buy 5DTE call spread triggered by a clean break above 175–176.
* Targets: 180 and 185 gamma resistance.
* Stop: Below 174 (trendline breach).
* Bearish Hedge:
* Entry: Buy put spread if price fails below trendline and dips <174.
* Target: 172 area (green zone), stop above 175.
🧠 Rationale
* Gamma walls present key inflection points—176 and 180 deserve respect as barriers or launchpads.
* Low IV environment reduces premium cost and quickens directional moves.
* Structure + trend alignment: Ascending higher lows suggest bullish lean—but must prove itself above resistance.
🚨 Disclaimer
This is for educational purposes—not financial advice. Options incur risk and may result in total loss. Trade with discipline—use proper position sizing, stop-losses, and awareness of volatility events and upcoming catalysts.

$GOOGL Swing Setup - Dark Pool Liquidity WatchNASDAQ:GOOGL Swing Setup - Dark Pool Liquidity Watch
Market Bias: Neutral with bullish potential
Bullish Above: 176.00 (trigger level)
Bearish Below: 171.50 (breakdown level)
Targets Upside:
T1: 179.50
T2: 183.00
T3: 187.70
Targets Downside:
T1: 169.60
T2: 166.40
T3: 163.70
Dark Pool Levels: Watch for new prints between 172-174 for confirmation
Pattern Confirmation: Possible Cup & Handle forming above 176 breakout zone
Expected Hold: 3-5 days swing
Note: Ideal for debit spread entries with low cost options if liquidity prints on breakout
#googl #darkpool #swingtrading #optionsflow #liquidityzones #technicalanalysis #tradingplan #debitspread #volumeanalysis #institutionalorders #trader
