Mastercard Incorporated WCA - Rectangle PatternCompany: Mastercard Incorporated
Ticker: MA
Exchange: NYSE
Sector: Financials
Introduction:
Our focus today is on Mastercard Incorporated (MA), a heavyweight in the Financial sector, listed on the NYSE. The weekly chart is revealing a Rectangle pattern, which indicates a potential bullish continuation.
Rectangle Pattern:
The Rectangle pattern typically appears during periods of market consolidation and can suggest a continuation/reversal of the trend, bullish or bearish, depending on the breakout direction. It is defined by a trading range where the price oscillates between a clear support and resistance level.
Analysis:
Previously, Mastercard was clearly in an uptrend, which was interrupted by a consolidation phase forming a Rectangle. This pattern, lasting for 1092 days, is interpreted as a bullish continuation. There are five touch points on the rectangle's upper boundary and two on the lower one.
Currently, the price is above the 200 EMA, which supports our idea to look for bullish opportunities. The latest candle movement shows the price breaking above the rectangle's upper boundary, signaling a potential long entry point.
Assuming a valid breakout, the price target is set at 506.86, suggesting a potential gain of approximately 28.56%.
Conclusion:
Mastercard's weekly chart presents a promising setup with a bullish Rectangle breakout, indicating a potential continuation of the uptrend. This setup could offer an excellent long trading opportunity.
As always, this analysis should be used in conjunction with your overall market research and risk management strategy, and not as direct trading advice.
If you found this analysis helpful, please consider liking, sharing, and following for more insights. Wishing you profitable trading!
Best regards,
Karim Subhieh
Disclaimer: This analysis is not financial advice and is intended for educational purposes only. Always conduct your own research and consult with a financial advisor before making investment decisions.
MACL trade ideas

Credit put spread MAmacro: snp500 QQQ uptrend
News: inflation flattening
TA :rising triangle, and breakprevious high, entry when it break the recent swing high
STOP: rolling till worthless options
$NYSE:MA Swing trade planNYSE:MA Swing trade plan after the Ascending triangle breakout. Ride the trend using EMA9 and EMA21. If price goes below EMA21 sell.

MasterCard Long Trade is activatedMasterCard Stock held the support really well and it is about to go up.

MA is seems to be weak.MA is showing weakness on 1W chart.
There is a big sell zone near 382$ where buyers have tried to win sellers, but all 6 attempts (mentioned on chart) were losing.
I expect two signals of weakness that will give confirmation of closing long position/ opening short position.
First signal is closing 1W candle under ema50 (about 357$ at mom). (This signal will be very strong, because it will be multiplied it strength with closing 1D candle under ema200, that is a confirmation for closing long position).
Second signal is closing 1W under critical level 347$ - that will be confirmation of opening short position.
Main targets are shown on chart and now are
320$, 250$, 215$.
You need to be very patient and wait until confirmation of next bullish market on this stock, big bounce (about +20%) I expect on 215$ (-45% from high 2023). Big bullish trend will be later, when chart will build again a structure: Price>ema30>ema50>ema200.

$MA with a bullish outlook following its earnings #StocksThe PEAD projected a bullish outlook for NYSE:MA after a positive under reaction following its earnings release placing the stock in drift A with an expected accuracy of 40%.

MA are you rdy for short ?🧨🧨👌The master card company is the leader of the financial fraudsters
What we are seeing in the Mastercard trend is an upward trend, because when more money is printed and economies go towards destruction, at first glance, we can see that the shares of banking companies will grow, but let me listen to my friends. It has and should be prepared for the fact that MasterCard shares will fall badly. Although this company wants to resist, you cannot fight with numbers. This number you see is just a bubble that will burst soon.
The future targets of MasterCard shares are $341.31, the next target is $316.71, and the third target is $279.19, which should be seen and will be seen.

Mastercard: Master the Hurdle! 🚧Mastercard should activate more upwards momentum to make it above the resistance at $390 – a feat in which it has succeeded already, albeit temporarily. Once above this mark, the share should vault into the green zone between $429.57 and $453.90 to complete wave B in green before returning below $390 again. However, we must keep in mind our alternative scenario with a probability of 33%: Mastercard might drop below the support at $340.21 to develop a new low first before heading further upwards. We would then expect this new low in the form of wave alt.(X) in magenta in the magenta-colored zone between $319.74 and $289.16.

MA - Horizontal Trend Channel [MIDTERM]- MA is within an approximate horizontal trend channel in the medium long term, which indicates further development in the same direction.
- The stock has broken a resistance level in the short term and given a positive signal for the short-term trading range.
- The stock is approaching resistance at 380, which may give a negative reaction.
- However, a break upwards through 380 will be a positive signal.
RSI is above 70 after a good price increase the past weeks.
- However, particularly for big stocks, high RSI may be a sign that the stock is overbought and that there is a chance of a reaction downwards.
- The stock is overall assessed as technically neutral for the medium long term.
*EP: Enter Price, SL: Support, TP: Take Profit, CL: Cut Loss, TF: Time Frame, RST: Resistance, RTS: Resistance to be Support LT TP: Long Term Target Price
Chart Pattern:
- Double Top - DT
- Double Bottom - DB
- Head & Shoulder - HS
- Rectangle - REC
- inverse head & Shoulder - iHS
Verify it first and believe later.
WavePoint ❤️

MA - MASTERCARD (7M/3D)✨ LONG-TERM DOWNTREND ✨
SLO @ 383.30
SSO @ 346.50
TP1 @ 290.00 (shave 50%)
TP2 @ 227.10 (shave 50%)
TP3 @ 199.99 (shave 50%)
TP4 @ 130.00 (close trade)
BLO @ 100.00

MA 1H trend trade break under ice bar volumed testDay chart conditions:
Trend trade 1IBK
+ short balance
+ CREEK level
+ resistance level
+ 1/2 correction
Hourly chart:
Conservative trend trade 1IBK
+ short impulse
+ 1/2 correction
+ resistance level
+ BUI test
+ volumed 2Ut
+ better price level entry
Calculated affordable stop
1 to 4 target

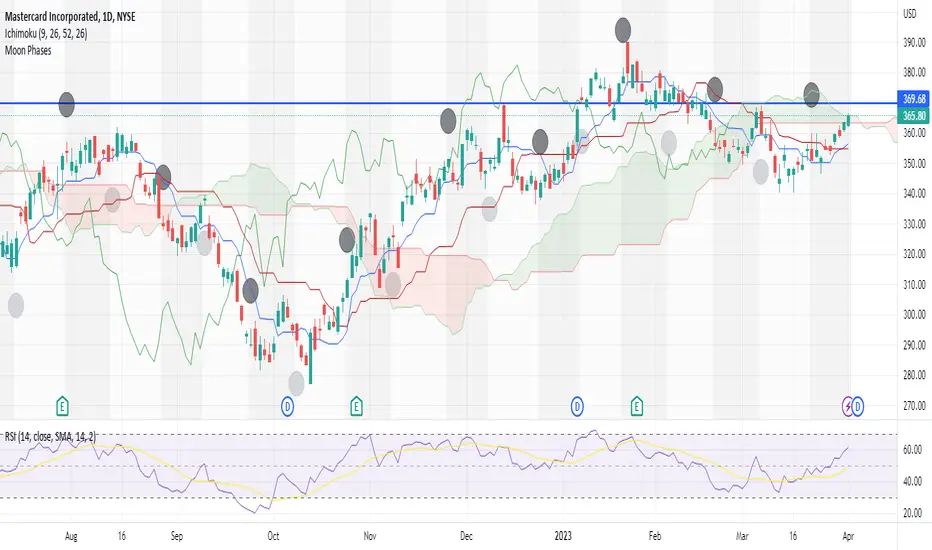
MA is a BUY +++MA just broke above the cloud, MA crossing up and new moon phase begins tomorrow or Wednesday suggests a bullish move impending much overhead resistance around $370 but it'll likely break through
MASTERCARD Stock Chart Fibonacci Analysis 040123 Trading Idea
1) Find a FIBO slingshot
2) Check FIBO 61.80% level
3) Entry Point > 360/61.80%

Weakness in Mastercard detected. MADivergence and a highly likely start of a new cycle on the daily appears to be on the cards here. Is this a new Wave A on its descent down?
We are not in the business of getting every prediction right, no one ever does and that is not the aim of the game. The Fibonacci targets are highlighted in purple with invalidation in red. Confirmation level, where relevant, is a pink dotted, finite line. Fibonacci goals, it is prudent to suggest, are nothing more than mere fractally evident and therefore statistically likely levels that the market will go to. Having said that, the market will always do what it wants and always has a mind of its own. Therefore, none of this is financial advice, so do your own research and rely only on your own analysis. Trading is a true one man sport. Good luck out there and stay safe.

$MA looks primedIf we see a break of the trend line, we could see a big move up for $MA.
If we do close at the top of this daily candle, then it would be engulfing and very bullish IMO.
Overall though a break and hold of that $356.27 is a great sign. Excited to see where she goes.

$MA at resistance It looks like $MA is approaching a resistance here.
If we break out it can really run, fundamentally she can go to $400.
For a quick swing we can be in the $360s pretty easily.
4H looks great as well. Weekly and 2H meh.
Good luck, wait for Powell.

MA H&S, awaiting confirmationClear Head and Shoulder, waiting for validation of breakdown below support(s).

$MA with a Bullish outlook following its earnings #Stocks The PEAD projected a Bullish outlook for $MA after a Positive Under reaction following its earnings release placing the stock in drift A with an expected accuracy of 54.55%.

Going long MABullish indicator
1--Dow Theory there is a Higher high and higher low form
2- Breakout the resistance of 369.30
3- Morning star formed

Mastercard continues to be mixed and volatile. Mastercard - 30d expiry - We look to Sell a break of 335.88 (stop at 345.02)
Trading has been mixed and volatile.
A break of the recent low at 336.02 should result in a further move lower.
Although the bulls are in control, the stalling positive momentum indicates a turnaround is possible. Short term bias has turned negative.
A higher correction is expected.
Our profit targets will be 314.04 and 310.04
Resistance: 350.00 / 360.00 / 369.26
Support: 336.00 / 330.00 / 320.00
Disclaimer – Saxo Bank Group.
Please be reminded – you alone are responsible for your trading – both gains and losses. There is a very high degree of risk involved in trading. The technical analysis , like any and all indicators, strategies, columns, articles and other features accessible on/though this site (including those from Signal Centre) are for informational purposes only and should not be construed as investment advice by you. Such technical analysis are believed to be obtained from sources believed to be reliable, but not warrant their respective completeness or accuracy, or warrant any results from the use of the information. Your use of the technical analysis , as would also your use of any and all mentioned indicators, strategies, columns, articles and all other features, is entirely at your own risk and it is your sole responsibility to evaluate the accuracy, completeness and usefulness (including suitability) of the information. You should assess the risk of any trade with your financial adviser and make your own independent decision(s) regarding any tradable products which may be the subject matter of the technical analysis or any of the said indicators, strategies, columns, articles and all other features.
Please also be reminded that if despite the above, any of the said technical analysis (or any of the said indicators, strategies, columns, articles and other features accessible on/through this site) is found to be advisory or a recommendation; and not merely informational in nature, the same is in any event provided with the intention of being for general circulation and availability only. As such it is not intended to and does not form part of any offer or recommendation directed at you specifically, or have any regard to the investment objectives, financial situation or needs of yourself or any other specific person. Before committing to a trade or investment therefore, please seek advice from a financial or other professional adviser regarding the suitability of the product for you and (where available) read the relevant product offer/description documents, including the risk disclosures. If you do not wish to seek such financial advice, please still exercise your mind and consider carefully whether the product is suitable for you because you alone remain responsible for your trading – both gains and losses.

MASTERCARD About to break into long-term bullish territoryMastercard Inc (MA) is rebounding again back towards the top of its +1 year Channel Down pattern after the December 02 rejection on the 262.000 Resistance, which happened to be also at the top (Lower Highs trend-line) of the Channel.
If the price breaks above, that alone would be a major bullish break-out signal for the long-term but ideally we would like to see a cross above the (red) Resistance Zone for confirmation. Beyond that, the upside targets are the 382.00 April 28 High and 400.00 February 02 High.
If on the other hand the 1D MA50 (blue trend-line) breaks first, we expect a pull-back to the (green) Support Zone (around 305.00) before the uptrend is resumed.
-------------------------------------------------------------------------------
** Please LIKE 👍, SUBSCRIBE ✅, SHARE 🙌 and COMMENT ✍ if you enjoy this idea! Also share your ideas and charts in the comments section below! This is best way to keep it relevant, support me, keep the content here free and allow the idea to reach as many people as possible. **
-------------------------------------------------------------------------------
You may also TELL ME 🙋♀️🙋♂️ in the comments section which symbol you want me to analyze next and on which time-frame. The one with the most posts will be published tomorrow! 👏🎁
-------------------------------------------------------------------------------
💸💸💸💸💸💸
👇 👇 👇 👇 👇 👇

short 314 targetshort 314 target ......................................................................................................................................

MastercardFalling Wedge Breakout
Formation of HH and HL
Aggressive Entry @ current Level (360.06)
Conservative Entry @ formation of HL, confluence with trendline support (355)
Trade with specified Stop Loss
TP levels are specified
Ride the trend with trailing stop Loss
