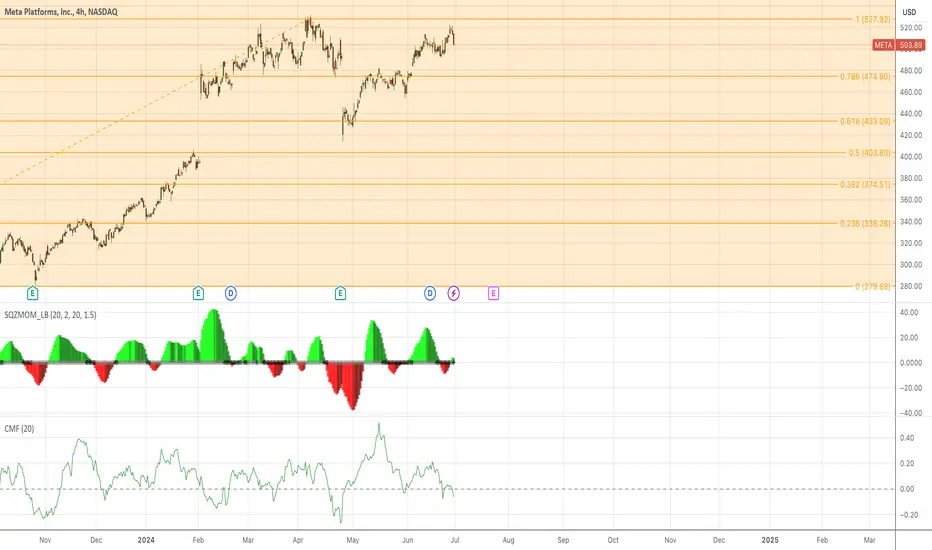
META - End of bull run?Meta is showing signs of exhaustion in its uptrend move. In my primary wave count, I´m considering that we will make a new all-time high for blue and black wave 5.
We also have an open gap at 406.36, which could be a target for a correction.
But let´s take it one step at a time... first step is to wait for the higher high and see if there is selling pressure.
META trade ideas

facebook - META Idea I
12M: Bullish Engulfing
→ Grey zone 453 – 509
→ 537, 553, 465 above , 390 below
3M: Could not break above high of prev. candle. But closes bullish
→ range of last quarter becomes important
→ grey area provides a possible reversal/ continuation zone.
→ Stochastic is turning down
Monthly: closing in bearish territory → bullish
→ could not close above highs
→ stochastic turning up = bullish setup above 509, bearish below
3D: Possible Double Top forming
→ could be an early sign of bears once validated. Bulls should show up soon
→ likelyhood of bullish progression is higher because of stochastic turning up

Quick dump : But ready to take offAs soon it takes a quick dump this is ready for a big pull back towards 550 in
After Earnings Pop past new high onlyMeta bullish optimism won’t be strong enough to surpass resistance. AI news will make it pop past it on earnings though.

The Zucks just announced paid subscriptions for FB and Instagram"Meta CEO Mark Zuckerberg announced a new paid subscription service for Facebook and Instagram on Sunday, granting users a hallowed blue check for a monthly fee. Meta Verified will cost $11.99 a month on web and $14.99 a month on iOS. It's launching in Australia and New Zealand this week ahead of a wider rollout. The subscription "lets you verify your account with a government ID, get a blue badge, get extra impersonation protection against accounts claiming to be you, and get direct access to customer support," Zuckerberg said."
Be interesting to see if this gives FB price a bit of a bump with the potential new revenue that could be generated by this.

META: DOUBLE TOPMETA still may run up to the 1.618 FIB extension of 526-527 before an assumed fall to PT1 of 492, then PT2 462

Meta Sneaks Toward Old HighsMeta Platforms has been grinding upward for the last two months, and some traders may see potential for a breakout.
The first pattern on today’s chart is the bearish gap on April 25 after guidance missed estimates. The social-media giant avoided making new lows after the drop and recovered, which may suggest that buyers were lurking.
Second is the pre-gap close of $493.50. META pushed above the level in early June and successfully retested it. That may erase any lingering negativity from the recent selloff.
Third, MACD is rising and the stock has held its rising 100-day simple moving average. Those patterns may reflect bullishness in the short- and longer terms.
Fourth, META is attempting to break a short-term trendline that formed over the last two weeks.
Finally, consider the broader megacap growth space. The sputtering price action in Nvidia has caused some anxiety, but other names like Amazon.com, Apple, Alphabet and Microsoft have remained at or near record highs. That may reflect confidence in the broader group, with the potential for sentiment to move away from chips toward other large Nasdaq stocks.
TradeStation has, for decades, advanced the trading industry, providing access to stocks, options and futures. See our Overview for more.
Past performance, whether actual or indicated by historical tests of strategies, is no guarantee of future performance or success. There is a possibility that you may sustain a loss equal to or greater than your entire investment regardless of which asset class you trade (equities, options or futures); therefore, you should not invest or risk money that you cannot afford to lose. Online trading is not suitable for all investors. View the document titled Characteristics and Risks of Standardized Options at www.TradeStation.com . Before trading any asset class, customers must read the relevant risk disclosure statements on www.TradeStation.com . System access and trade placement and execution may be delayed or fail due to market volatility and volume, quote delays, system and software errors, Internet traffic, outages and other factors.
Securities and futures trading is offered to self-directed customers by TradeStation Securities, Inc., a broker-dealer registered with the Securities and Exchange Commission and a futures commission merchant licensed with the Commodity Futures Trading Commission). TradeStation Securities is a member of the Financial Industry Regulatory Authority, the National Futures Association, and a number of exchanges.
TradeStation Securities, Inc. and TradeStation Technologies, Inc. are each wholly owned subsidiaries of TradeStation Group, Inc., both operating, and providing products and services, under the TradeStation brand and trademark. When applying for, or purchasing, accounts, subscriptions, products and services, it is important that you know which company you will be dealing with. Visit www.TradeStation.com for further important information explaining what this means.

$METANASDAQ:META looking really good on the daily. just NASDAQ:ARM , NASDAQ:PANW are showing same cup n handle and I expect a breakout this week, or next week latest from all three of these stocks from these cup n handles

How we utilize our META algorithms for trade entriesAnother back-testing-like video which dives a bit deeper into the algorithms.
I know my analysis is not for everyone but I appreciate anyone who finds these videos helpful!
Happy Trading :)

META: Week of June 24thJust my thoughts on META for next week.
As always, leave your questions below and safe trades!

480 imminent from the theory based behind the trend lineEverything is seemingly headed in a direction of support, and retest key areas on the trendline, and with a lot of room above and below, there may be a few tests around this region again before it shows a solid upside movement.


Live Trading/Scalping METAHere I put the HTF analysis and algorithms that I posted in my video this morning to action.
This was a lot of fun for me to do and I will start to "live trade" more often for you all if you find it helpful. I would think it gives a deeper insight into how I actually utilize my strategy in the markets by utilizing the higher time frame analysis that I give in my other videos.
Please let me know if you enjoy this type of content and what you'd like to see next!
(Price ended up dumping down to 497 minutes later!)
Happy Trading :)

Would you still increase your holdings at this point?The the stock of social media company has risen by 8.06% in the past month, lagging the Computer and Technology sector's gain of 8.7% and overreaching the S&P 500's gain of 3.34%.
The stock is at an all-time high, but positions are not larger than ever, and traders are cautious and not rushing into the market.

META - Short term analysis and trade ideasWe will be adaptive for this position. We have our HTF target above and we are now preparing to enter a short term position on a LTF.
Our LTF is attempting to prove our green and white controlled-selling taper which is what we look to see for HTF breakouts.
Happy Trading :)

486 could it be possibleTwo things in mind, from channeling sideways between upper 400 and 515 until a breakaway to a higher high, or BB central mid 480s, and a quick bounce back up, is my story of what could be an event. Enjoy!

3 Reasons Why Meta Is A Good Buy Right NowIts been a challenge to trade of late but dont lose hope you can always find a way
as long you have a will... Now yesterday i introduced you to the rocket booster strategy and on top of that i
showed you the #1 indicator that i use to know wether a trend is strong enough for you to buy or sell check the references below to learn more
Right now meta is performing very well and looks like it will be one the best stocks in 2024, there is a race going on in the tech stocks that you should really take note of
this bull market run in the tech stocks is something that happens during market down turns because investors are looking to park their money in businesses that have proof of concept and consumer market value.
3 Reasons Why Meta Is A Good Buy Right Now
-1- The price is above the 50 day moving average
-2- The price is above the 200 day moving average
-3- The trend is very strong
**BONUS TIPS***
-4- Look at the ADX what color is above the red line and the blue line?
-5- If the green line is above the red line what does this mean? in terms of trend strength?
Rocket boost this content to learn more.
Disclaimer:Its not as hard as it seems but remember that trading is risky and you will lose money so learn risk management

Elliott Wave Expects META to Extend Impulsive RallyShort Term Elliott Wave in META suggests the stock rallies in impulsive structure from 4.25.2024 low. Up from there, wave (1) ended at 482.5 and pullback in wave (2) ended at 454.46. The stock has resumed higher in wave (3) with internal subdivision as an impulse Elliott Wave structure in lesser degree. Up from wave (2), wave ((i)) ended at 460.23 and pullback in wave ((ii)) ended at 458.3. The stock resumed higher in wave ((iii)) towards 496.65 and pullback in wave ((iv)) ended at 491.92. Final leg wave ((v)) ended at 502.82 which completed wave 1.
Pullback in wave 2 unfolded as a zigzag structure. Down from wave 1, wave ((a)) ended at 490.89 and wave ((b)) ended at 496. Wave ((c)) lower ended at 490.19 which completed wave 2 in higher degree. The stock has resumed higher in wave 3. Up from wave 2, wave (i) ended at 505.33 and wave (ii) ended at 498.67. Rally in wave (iii) ended at 509, and dips in wave (iv) ended at 507.3. Final wave (v) ended at 516.88 which completed wave ((i)) in higher degree. Wave ((ii)) pullback is in progress to correct cycle from 6.7.2024 low before it resumes higher. Near term, as far as pivot at 490.19 low stays intact, expect dips to find support in 3, 7, or 11 swing for further upside.

Using the Second Charts on TradingviewThis tutorial goes over the uses of the very low timeframe features that Tradingview offers, namely the 1 second through to the 30 second charts.
The main advantage to these timeframes is that they permit you to clearly see whether your support and/or resistance levels are being held or are being rejected. This allows you to make a determination much quicker than if you are using higher timeframes. This can make or break your profit and setup and is quite an advantageous tool to utilize if you have access to these timeframe periods.
In addition to visualizing support and resistance breaks/holds, the use of these smaller timeframe charts also allows you to apply methods such as the Heikin Ashi strategy much more effectively and quickly. If you are a scalper, it does add an insurmountable amount of value to your analysis.
Thanks for watching and leave your questions and comments below!
Safe trades everyone!

Meta Platforms META - Expect lots of price actionBased on after-market price action META has already dropped from about $493 into the gap at about $420. There is room to fall further to the 200 day EMA that coincides with the previous all-time high. We would definitely expect some reaction at that point. There should be a lot of price action at this point since the gap is so large. This is a wait and see situation.

Buy MetaInvesting differs from trading as it focuses on long-term growth and sustainability of assets rather than quick gains. An investment idea involves committing money to ventures, projects, or assets expected to grow in value over time, such as stocks, bonds, or real estate.
Investing requires understanding the fundamental factors that drive growth and stability. It involves detailed analysis of opportunities, like evaluating a company's financial health and potential for innovation, to minimize risk and maximize long-term gains.
META - Short OpportunityVideo says it all! Meta has someroom for a liquidity build after filling the large downside gap.
Happy Trading :)

Prep and Lean 6.6.24ES
Overall conditions quite bullish. It is difficult to be bearish given the VAH is also the HOD, meaning volume & value are backing this move.
No bullish close but a value shift higher, so I can’t really be bearish until acceptance back below the VAL 5326 is found.
Depending on where we open, our best reference would be 5360-5362, the VPOC & spike base.
Open / bid above 5360-5362 targets 5382 / 5391. Take out 5391 targets 5408.
Open / offer below 5360-5362 targets 5336. Take out 5336 targets 5326 / 5317.
NQ
Overall conditions quite bullish.
No bullish close but a value shift higher, so I can’t really be bearish until acceptance back below the VAL 18902 is found.
Depending on where we open, our best reference would be 19049, the spike base.
Open / bid above 19049 targets 19123-19148. Take out 19123-19148 targets 19180.
Open / offer below 19049 targets 18923-18950. Take out 18923-18950 targets 18902.
Stay Frosty!
