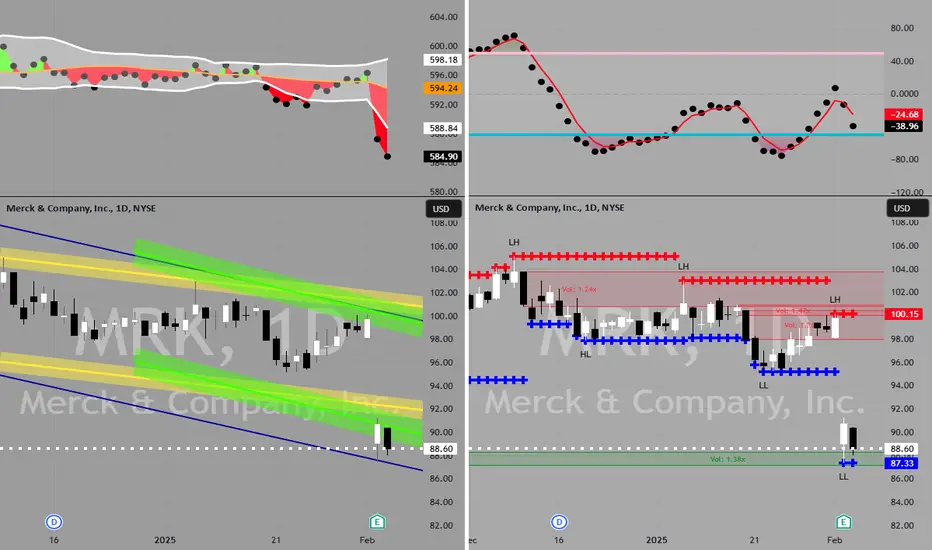
MRK to $98My trading plan is very simple.
I buy or sell when price tags the top or bottom of parallel channels.
I confirm when price hits Fibonacci levels.
So...
Here's why I'm picking this symbol to do the thing.
Price in channel zones at bottom of channels (period 100 52 & 26)
Stochastic Momentum Index (SMI) near oversold level
VBSM is spiked negative and under bottom of Bollinger Band
Entry at $88.61
Target is $98 or channel top
MRK trade ideas
Bounce Off the Bottom for Merck. MRKWe believe a downward impulse (Elliott) is finished and this is somewhat evident by the two candlestick price action. A change in the tone and flavor of candle sticks in momental OBOS area, overstretched VZO/StochRSI combo can be suggestive of a pivot and we believe this to be happening here. If the outlook is wrong then the obvious and tight stop will prevent large losses. Interstingly Ehlers StochRSI already produced a signal and momentum RSX "tipped."

MRK reboundNYSE:MRK NYSE:MRK MRK reversed yesterday on relatively high daily volume and is poised to fill the gap between 90 and 95. From 85 to 88 there is an accumulation zone which might be hard to get through but one that is cleared the way is open to 90 and subsequently 95.

MRK Rebound in sight MRK, along with many othe rpharma stocks has taken some serious beating.
But we like fear - as an opportunity- and it’s here( I dare say it) based on the bottom most will rejection, aka a shooting star.
So here are my forecasts in my crystal ball::
1. Overall Trend and Structure
• Longer-Term Trend: MRK peaked near the $115–$120 region in late 2022/early 2023 and has since been making lower highs and lower lows on the weekly timeframe. This suggests a downward bias over the past 12+ months.
• Recent Price Action: Price is hovering around the mid-$80s, testing support in the $80–$83 zone. This area held as support a few times in 2021–2022 and is now being revisited.
• Break of Structure (BOS) & Change of Character (CHoCH) Markers:
• The chart indicators label potential break-of-structure levels where bulls and bears exchanged control.
• Since late 2022, these BOS levels have mostly favored the bears, confirming the downtrend.
• A bullish CHoCH would require a strong close and sustained trading above the most recent swing high (somewhere in the $90–$92 zone on the weekly).
2. Key Technical Indicators
1. Stochastic Oscillator (Lower Panel)
• Appears oversold or near the lower region. On a weekly timeframe, this sometimes suggests that bearish momentum could be losing steam. A bullish crossover from oversold levels often points to a short-term rebound.
2. Momentum Oscillators (e.g., RSI/MACD, if present)
• While not explicitly shown, the lower indicator panel with wave-like patterns suggests momentum has been negative but may be stabilising.
3. Support & Resistance Levels
• Immediate Support: $80–$83 zone. A weekly close below $80 could open the door to the mid-$70s or even $70.
• Initial Resistance: $90–$92 (recent swing highs). Price needs to reclaim this region to confirm a potential bullish reversal on the weekly timeframe.
• Secondary Resistance: $95–$100. If the price clears $92, this would be the next zone of overhead supply from prior consolidation.
3. Possible Scenarios & Probability Estimates
Below are hypothetical scenarios with rough probability estimates, assuming no major market-wide shocks and stable macro conditions.
Bullish Reversal Scenario (Est. 55–60% probability)
1. Hold Support around $80–$83:
• If MRK holds above this region on a weekly closing basis, buyers may attempt a short-term bounce.
• Timeframe: Could take 2–5 weeks for a solid weekly close confirming support.
2. Upside Targets:
• First Target: $90–$92 (key swing high + psychological level).
• Second Target: $95–$100 if price breaks and holds above $92 on strong volume.
3. Catalysts to Watch:
• A weekly close above $92 would be a “change of character” from lower highs to a potential new uptrend on the weekly.
• Bullish crossover in the Stochastics or MACD on the weekly.
Continued Downtrend Scenario (Est. 40–45% probability)
1. Failure at $80 Support:
• If the stock breaks below $80 on a weekly close, the downtrend likely continues.
• Timeframe: A decisive break can happen within 1–3 weeks if sellers remain strong.
2. Downside Targets:
• First Target: $75 region, near previous support levels.
• Second Target: $70 if selling pressure accelerates and overall market sentiment remains weak.
3. Catalysts to Watch :
• Weak earnings, lowered guidance, or broader market declines.
• Stochastics remaining in oversold territory without crossing back up, indicating persistent downward momentum.
4. Trade Direction & Time Estimates
• Short-Term (1–4 weeks):
• Expect choppy price action around $80–$83. A near-term bounce is possible if momentum indicators turn bullish.
• If a bounce materialises, watch $90–$92 as a critical resistance.
• Medium-Term (2–3 months):
• If bulls successfully defend $80 and break $92, a run to $95–$100 could happen by mid-spring to early summer.
• Conversely, if $80 fails, the downtrend may persist into the $70s in a similar timeframe.
5. Risk Management Considerations
1. Confirm Volume & Momentum:
• Wait for a weekly close above (or below) key levels ($80 support or $92 resistance) to confirm the trend direction.
2. Position Sizing:
• If going long near $80 support, consider a stop-loss just below $80 (e.g., $78–$79) to limit risk.
• If anticipating a breakdown, watch for confirmation (weekly close below $80) before entering short positions.
3. News & Fundamentals:
• MRK is a large pharmaceutical company sensitive to drug approvals, patent news, and broader healthcare developments. Technicals alone might not capture sudden catalyst-driven moves.
Final Thoughts
• Most Likely Near-Term Path: A technical rebound attempt from $80–$83, but the stock must decisively clear $90–$92 to signal a genuine bullish reversal on the weekly chart.
• Overall Bias: The multi-month trend is still down, so the burden of proof is on bulls to show a structural change in character.
Again, these are probabilistic views.
Good luck out there

MerkOk this looks oversold.
In fact,
Oversold on multiple timeframe
So here’s a technical analysis with potential price targets and trade direction:
Current Market Conditions & Observations
1. Trend Direction: Bearish
• The stock is in a clear downtrend, breaking multiple levels of support.
• Break of Structure (BOS) labels indicate lower lows forming consistently.
• A recent breakdown below support at ~$94.23 suggests further downside pressure.
2. Support & Resistance Zones:
• Current support: ~$85.50 (testing support level)
• Next major support: ~$80.00 (potential downside target)
• Major resistance: $94.00 (previous support turned resistance)
• Further resistance zones: $100 - $105 (if a reversal happens)
3. Indicators:
• Stochastic RSI: Oversold territory (possible short-term relief bounce)
• Volume: Elevated selling pressure, confirming the downward move.
• Liquidity zones & Order Blocks: Price has entered a demand zone near $85.
Trade Outlook & Price Targets
• Short-Term Bearish Bias: The breakdown suggests continued downward momentum. If $85.50 breaks, next downside target is $80.00.
• Possible Relief Rally: A short-term bounce could occur if buyers defend $85.50, but upside is capped at $94.00 unless strong momentum builds.
• Long-Term Reversal: Would require a break back above $100-$105 to shift into a bullish structure.
Trade Strategy Ideas
1. Bearish Scenario (Short Trade)
• Entry: Rejection near $90-$94 zone.
• Target 1: $85.50 (current support).
• Target 2: $80.00 (major demand zone).
• Stop-loss: Above $96.00 (invalidate bearish setup).
2. Bullish Scenario (Reversal Play)
• Entry: If price holds $85.50 with strong volume.
• Target 1: $94.00 (resistance).
• Target 2: $100 (trend change confirmation).
• Stop-loss: Below $83.00 (breaks structure).
Final Outlook
• Bias: Bearish unless $85.50 holds.
• Short-term: Expect further downside pressure.
• Medium-term: A break below $85.50 could lead to $80.00.
• Long-term: Needs a reclaim above $100 to flip bullish.

Trade Plan: Long Opportunity in Q2-Q3 2025Optimal Entry Zone
$90-$95: A strategic accumulation zone for long-term positions. Monitor for reversal patterns (double bottom, bullish engulfing candlesticks).
Targets
$110: First resistance zone (aligned with the 200-day SMA and Ichimoku Base Line).
$124.65: Analyst average price target and major resistance. Represents a potential 27% upside from the current price.
$140+: Long-term stretch target if bullish fundamentals align.
Stop Loss
Below $84, as a breakdown of this level could indicate extended bearish momentum.
Patience is critical for this setup. Allow the stock to establish a firm bottom around $90-$95 and wait for confirmation of reversal via technical indicators or bullish news catalysts. If the sector strengthens or macroeconomic conditions favor defensive stocks, Merck could provide a solid long-term opportunity in 2025.

MRK - Merck Co. Buy the dip for 35% potentialMRK reached down to liqudity zone.
<95.50 levels are good zone to buy.
TP levels marked in the graph with green lines. 35% upside potential for medium/long -term.
The price is under performance compared to Dow Jones. Let's watch!

Merck & Co Inc - USD (Extended Hours) | Chart & Forecast SummaryKey Indicators On Trade Set Up In General
1. Push Set Up
2. Range Set up
3. Break & Retest Set Up
Notes On Session
# Merck & Co Inc - USD (Extended Hours)
- Double Formation
* 121.00 USD | Area Of value | Subdivision 1
* A+ Set Up)) | Completed Survey & Entry Bias | Subdivision 2
- Triple Formation
* Not Numbered Retracment | Downtrend Continuation
* ((Triangle Structure)) | Subdivision 3
* Daily Time Frame | Trend Settings Condition
Active Sessions On Relevant Range & Elemented Probabilities;
European Session(Upwards) - US-Session(Downwards) - Asian Session(Ranging)
Conclusion | Trade Plan Execution & Risk Management On Demand;
Overall Consensus | Sell

Prescribing ProfitsMerck & Co. (MRK) is exhibiting strong bullish momentum, with a gap forming around the $95.00 level. A breakout above the $106.07 daily resistance would confirm continued strength, positioning the stock to target $120.30. This setup offers an excellent risk-to-reward ratio, with a stop-loss set at $92.74 to manage downside risk.
As a leader in the pharmaceutical industry, Merck is poised for growth driven by its innovative pipeline, strong demand for its key products like Keytruda, and strategic advancements in oncology and vaccines. With consistent revenue growth and a global footprint, MRK remains a cornerstone in the healthcare sector.
For a deeper dive into this setup, check out my YouTube breakdown, where I analyze the technical setup and discuss the fundamentals supporting this trade.
With a combination of technical momentum and robust market fundamentals, MRK presents a compelling opportunity for traders and investors aiming for $120.30.
NYSE:MRK

MRK LongAt weekly support line. Price range between 95 and 120.
Long 96.5
Stop 84
Target 120
Risk management is much more important than a good entry point.
I am not a PRO trader.
In my trading plan, the Max Risk of each short term trade should be less than 1% of an account.

MERCK_1W_BuyMerck & Company stock analysis on weekly and long-term time frames The market is in an upward trend and in an upward channel, and currently the price is at the bottom of the upward channel, and also the static number 100.00 is important, and as long as it can maintain this number as support, the trend is still upward. It can move towards the number 150.00. The growth percentage of this stock is 50%.

Looking for a break of a trendline on MRK! Looking for a retest of support and then a break of the upper resistance line with valid volume! We have a major gap to fill above us on MRK, and the fundamentals are also looking very nice on MRK.

Positive Divergence with Support areawe have the following reason to believe MRK should go Bulish :
1 - Support in Daily Chart
2- Divergence withing 4 indicators
3- Big diffinters on Gamma Distrubtion seen on 95 for 29 Nov Option expiray date
4- 2 Doji candles for the previous 2 days

Merck Could Be SicklyMerck has struggled for most of the year, and now some traders may look for another push to the downside.
The first pattern on today’s chart is the series of higher lows from mid-November through early last week. MRK has dropped below that line, which may be viewed as a bear-flag breakdown.
Second, prices tested the 50-day simple moving average and stayed below it. That may suggest its intermediate-term trend is headed lower.
Next, compare this price action with similar patterns in September. Also note that Wilder’s Relative Strength Index (RSI) slipped below its 14-day average both times. (See white arrows.)
Finally, MRK is pushing against the $99.14 level where it bottomed in 2023. Are double digits the new normal for the pharmaceutical giant?
TradeStation has, for decades, advanced the trading industry, providing access to stocks, options and futures. If you're born to trade, we could be for you. See our Overview for more.
Past performance, whether actual or indicated by historical tests of strategies, is no guarantee of future performance or success. There is a possibility that you may sustain a loss equal to or greater than your entire investment regardless of which asset class you trade (equities, options or futures); therefore, you should not invest or risk money that you cannot afford to lose. Online trading is not suitable for all investors. View the document titled Characteristics and Risks of Standardized Options at www.TradeStation.com . Before trading any asset class, customers must read the relevant risk disclosure statements on www.TradeStation.com . System access and trade placement and execution may be delayed or fail due to market volatility and volume, quote delays, system and software errors, Internet traffic, outages and other factors.
Securities and futures trading is offered to self-directed customers by TradeStation Securities, Inc., a broker-dealer registered with the Securities and Exchange Commission and a futures commission merchant licensed with the Commodity Futures Trading Commission). TradeStation Securities is a member of the Financial Industry Regulatory Authority, the National Futures Association, and a number of exchanges.
TradeStation Securities, Inc. and TradeStation Technologies, Inc. are each wholly owned subsidiaries of TradeStation Group, Inc., both operating, and providing products and services, under the TradeStation brand and trademark. When applying for, or purchasing, accounts, subscriptions, products and services, it is important that you know which company you will be dealing with. Visit www.TradeStation.com for further important information explaining what this means.

Long Again9 times tested the bottom now. This looks like a bottom building. After a 2 month's decline we ave reached the October low again.
If there won't be another low today we may see a rebound.

$MRK Long-Term BuyHealthcare could possibly be the next rotation coming out of this tech bull run. Using the Trade Jeanie (Jeanius Screener/Indicator), I was able to see the current technical buy signals happening on NYSE:MRK :
Inside a HTF fair value gap (12M timeframe)
Testing a HTF uptrend line (3M timeframe)
Larkuidity (Liquidity) Sweep
The Jeanius Indicator shows green 'Combo' labels every time this same combination of signals happened
The Jeanius Screener lets me filter my favorite tickers to see which ones are currently sweeping liquidity

Merck & CO Inc: MRK oversoldIt's a cypher like bullish pattern with measurements close to an ideal cypher i.e. 1.5 per cent discrepancy, but I am looking at a broad timeframe over last couple of years. assuming it is bottoming these days around 95 it should bounce back to around 120 i.e. fibo .618 of the cd leg. - at least!
main oscillators i track indicate oversold on day, week, month TF

Engulfing BottomThe last 3 days we are not getting a new low. Instead the candles are very small and remain withing the seize of the body of the last big red candle.I see this a a strog sign of a bottom.

Merck & Co., Inc. | Chart & Forecast SummaryKey Indicators on Trade Set Up in General
1. Push Set Up
2. Range Set up
3. Break & Retest Set Up
Active Sessions on Relevant Range & Elemented Probabilities;
London(Upwards) - NYC(Downwards)
Conclusion | Trade Plan Execution & Risk Management on Demand;
Overall Consensus | Sell

Looking for a leap on MRK.🔉Sound on!🔉
Thank you as always for watching my videos. I hope that you learned something very educational! Please feel free to like, share, and comment on this post. Remember only risk what you are willing to lose. Trading is very risky but it can change your life!

Merck & Co., Inc. (NYSE: MRK)1. Financial Performance
Q3 2024 Results: Merck reported strong Q3 earnings with worldwide sales of $16.7 billion, reflecting a 4% year-over-year increase. This performance was driven by growth in its oncology and vaccines divisions, particularly from products like Keytruda and Gardasil. The company remains optimistic about its pipeline expansion, projecting 2024 full-year sales between $63.6 billion and $64.1 billion, supported by demand in both human and animal health sectors.
Profitability Metrics: Merck’s operating margin is approximately 24%, with a profit margin around 19%, indicating strong profitability within the sector.
2. Pipeline and Strategic Developments
Product Innovations and Pipeline Expansion: Merck has a robust pipeline with several late-stage drugs in areas like oncology and infectious diseases. Recently, Merck completed the acquisition of Curon Biopharmaceutical’s CN201, expanding its capabilities in precision oncology. The company also gained FDA approval for sotatercept, a drug for rare lung diseases, signaling potential future revenue from rare disease treatments.
Oncology and Vaccine Market: Keytruda, Merck's flagship immunotherapy, continues to lead in oncology sales, especially for lung cancer treatments. Gardasil, a vaccine against HPV, also achieved strong growth, with international demand contributing significantly to Merck’s revenue.
3. Stock Performance and Analyst Sentiment
Current Price and Target: MRK’s stock currently trades near $102.92, with analysts forecasting a 12-month target average of $130.86, representing potential upside of 27%. Analyst sentiment is broadly positive, with the consensus rating as “Buy.” Analysts remain optimistic about Merck’s growth trajectory, despite some recent stock price fluctuations due to macroeconomic factors.
Recent Volatility: MRK shares have shown some volatility, influenced by sector-wide trends. The stock remains 24% below its 52-week high, providing potential for growth if Merck continues its revenue trajectory and pipeline progress.
4. Outlook and Risks
Growth Prospects: Merck’s growth strategy focuses on oncology, vaccines, and emerging markets, with projected revenue increases of around 7.8% in 2024 and 6.3% in 2025. Keytruda and Gardasil are expected to drive these gains, along with new products from recent acquisitions.
Challenges: Risks include competitive pressures in the pharmaceutical sector and regulatory challenges that could impact new drug approvals. Operational costs, such as R&D expenditures, are substantial as Merck invests in expanding its drug portfolio and new therapies.
Overall, Merck’s current financial health and strategic growth efforts position it well within the pharmaceutical industry. The company's diversified pipeline and strong product portfolio provide it with resilience against market fluctuations, though future success depends on continued innovation and successful product launches.

MerkThe stock Mark presents an excellent opportunity for traders with a favorable risk-benefit ratio. It is currently at a strong demand zone, and there is a bullish shark harmonic pattern that aligns with this demand area, along with the 200-day moving average. This is a strong entry point near 100$, with a stop-loss below 97$. The target price is between $116 and 120$.

MRK-NYSE longterm view"Merck reported a mixed third quarter update on Thursday, cutting guidance even as earnings topped market expectations." according to barron^s.
However, the balance sheet is still solid and MRK entered an area where it presents a good Buy opportunity especially for Dividend portfolio's that want a good Av_Px.
the second quarter report still cast a shadow though. some good news from China market will boost the stock to higher ground with 99.27 to be the crusial point for a major turn to bearish mode.
