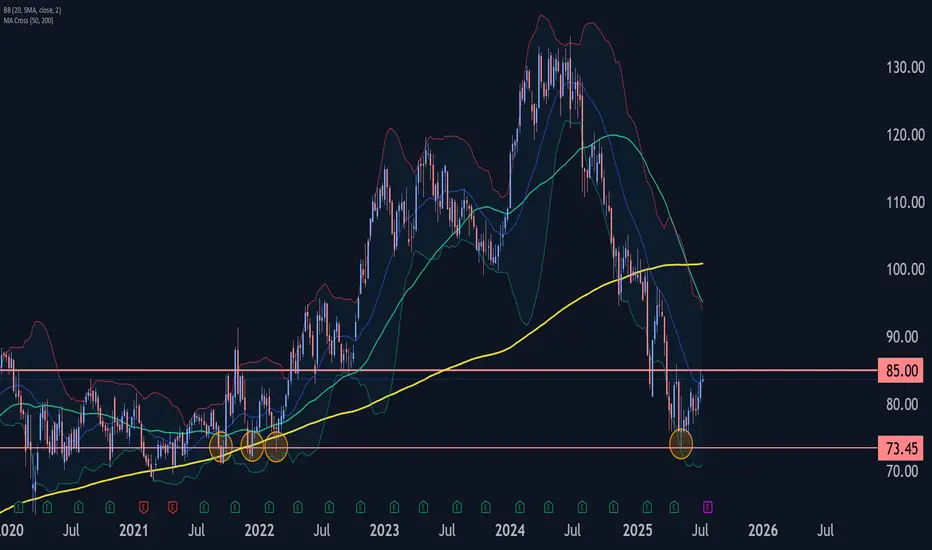
MRK eyes on $80.36/74: Double Golden zone break to end DownTrendMRK and all pharma has been dropping forever.
Just pierced the Double Golden zone yet again.
Break and Hold of this zone will say "bottom".
.
MRKCL trade ideas

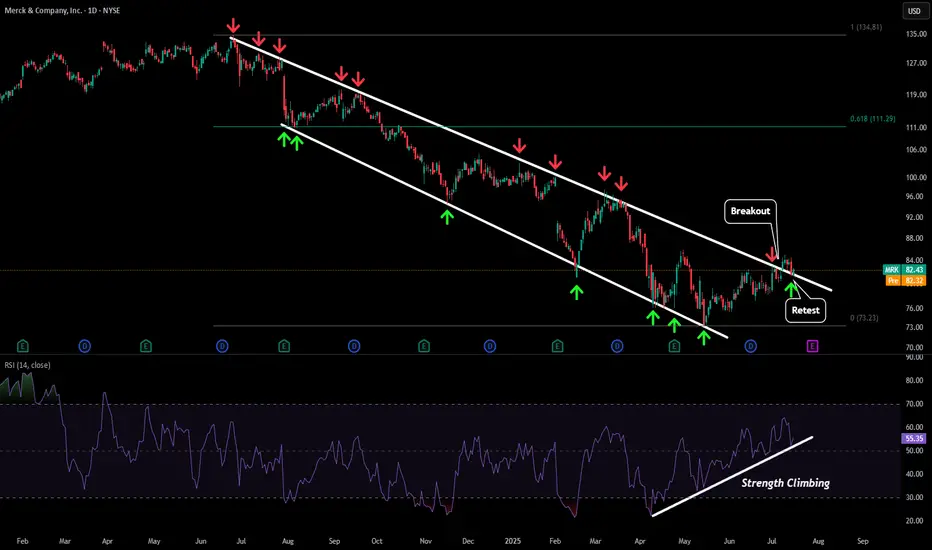
MRK - Retesting BreakoutAfter being in a downtrend for almost a year things finally look like they are starting to turn around for MRK.
Recently price broke the downwards sloping resistance and has retested that level as a new support level. We have also seen strength increasing on our daily RSI bringing some life back into this stock.
Our first price target to the upside would be out LTF target around $88 followed by our 0.618 target around $111.
If we see some serious strength and price climb above our previous ATH we could even see a move towards the $172 level.
MRK Buying Opportunity!MRK is currently undervalued. The stock price dropped approximately 45% from June 25th of last year to May 15th of this year. At present, the price has bounced off a long-term weekly trendline that has been respected since 2009, indicating a strong rejection zone.
Additionally, on the daily timeframe, the long-standing bearish channel was broken on July 8th. This breakout suggests a likely continuation to the upside. A conservative and highly probable price gain of around 30% is expected from here.

MRK Wave Analysis – 14 July 2025- MRK reversed from the support zone
- Likely to rise to resistance level 85.00
MRK recently reversed up from the support zone surrounding the long-term support level 73.45 (which has been reversing the price from the start of 2020, as can be seen from the weekly MRK chart below).
The upward reversal from the support level 73.45 started the active long-term impulse wave III.
MRK can be expected to rise to the next resistance level 85.00 (former top of wave (4) from May) – from where the price is likely to correct down.
Long $MRK- NYSE:MRK is a quality compounder selling at a discount.
Year | 2025 | 2026 | 2027 | 2028
EPS | 8.90 | 9.72 | 10.65 | 10.38
EPS% | 18.36% | 9.21% | 9.54% | -2.52%
Conservative forward p/e should be 10
Fair Stock value:
EPS | 8.90 | 9.72 | 10.65 | 10.38
Price | 89 | 97 | 106 | 103
Positive Suprises or rotation into healthcare by fund manager would leead to forward p/e of 15
EPS | 8.90 | 9.72 | 10.65 | 10.38
Stock price | 133 | 145 | 159 | 155

MRKEntry Zone: $81.50 to $80.00 (Potential accumulation area for buyers).
Key levels within this zone: $81.51, $81.53, $80.57.
Immediate Resistance: $83.07 (today’s high).
Higher Targets:
$92.63 - $93.26 (First target zone).
$97.36 - $98.25 (Second target zone).
$100.55 - $101.73 (Major resistance zone).
Stop loss 72.00

AAA - Setup from the bottomInverse head and shoulders pattern on the daily timeframe and if you were to break it down further to 12hr it should be also clear.
Monthly rsi sharply bounced back below an RSI of 30, weekly rsi has been below 30 rsi for multile touches
rsi line and rsi moving average crossover indicating change in direction of trend"
increased volume will support this
macd and signal line crossover
macds histogram shows sign of bullish momentum that could grow.


$MRK, Long, TP>15-25%NYSE:MRK , Long, TP>15-25%
Fundamentally the stock is good.
Choose an entry point and do not forget about a protective order if you are trading with leverage.
Don't risk it if you're not sure.
Good luck to everyone.

Merck Wave Analysis – 19 May 2025
- Merck reversed from support area
- Likely to rise to resistance level 80.00
Merck recently reversed up from the support area between the long-term support level 73.35 (which has been reversing the price from the middle of 2020) and the lower weekly Bollinger Band.
The upward reversal from this support area created the weekly Japanese candlesticks reversal pattern Long-legged Doji.
Given the strength of the support level 73.35 and the oversold weekly Stochastic, Merck can be expected to rise to the next round resistance level 80.00.

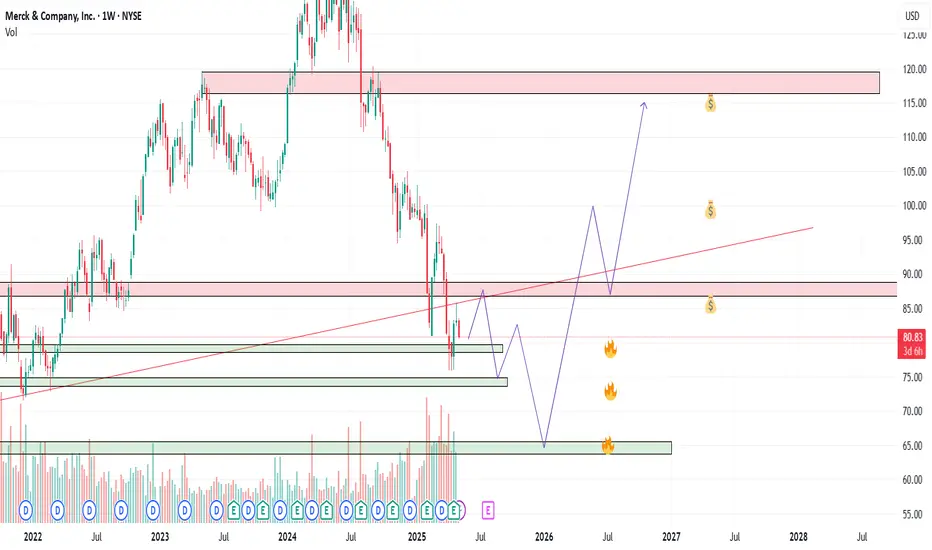
Merck & Company Potential Post Tariff Resolution Bullish RallyWith potential developments towards the resolution of global tariffs and pharma being defensive in general, MRK price action seems to exhibit signs of a potential Bullish reversal breakout as the price action may form a prominent Higher High with multiple confluences through key Fibonacci and Support levels which presents us with a potential Non-Leverage hold opportunity.
Entry: (Buy 1 CMP 76.2 & Buy 2 87.6)
Stop Loss: 45 or 0 (depends on trading style as Non-Leverage Buy & Hold is recommended)
Potential Range for Targets: 130 - 170

Buy MRK Merck being a Pharma company which belongs to a defensive sector is a good buy around 69$ levels. Has a P/E of less 10 and dividend of 4% at current price can be a good long term hold who targets passive income with dividend.
For swing trade , buying at 69-70 levels and target 20% to sell at 85 levels

Is MRK Setting Up for a Major Comeback? 🧬Merck & Co. (MRK) is trading around $81.00 down significantly from its 52-week high of $134.63 but this pullback could be your window of opportunity. With a solid forward P/E of 9.02, a 3.9% dividend yield, and a pipeline packed with over 20 potential blockbuster drugs, the fundamentals remain strong despite recent pressure from Gardasil sales in China and looming Keytruda patent concerns.
🎯 Entry Zones:
1) Market price
2) $72.50 (strong historical support)
3) $66 (major accumulation zone)
📈 Profit Targets:
TP1: $87
TP2: $99
TP3: $115+
Technically, MRK is still below its 50- and 200-day SMAs, but the PEG ratio of 0.74 suggests it's deeply undervalued relative to its growth potential. A bounce from current levels or deeper supports could kickstart a strong swing toward triple-digit territory — especially if bullish sentiment returns to the healthcare sector.
🔍 Watch for confirmation around support and volume spikes — this setup could become one of the stealth recovery trades of the year.
🛑 Disclaimer: This is not financial advice. Always do your own research or consult a financial advisor before investing.
MERCK Stock Chart Fibonacci Analysis 042525Trading Idea
1) Find a FIBO slingshot
2) Check FIBO 61.80% level
3) Entry Point > 82/61.80%
Chart time frame: D
A) 15 min(1W-3M)
B) 1 hr(3M-6M)
C) 4 hr(6M-1year)
D) 1 day(1-3years)
Stock progress: A
A) Keep rising over 61.80% resistance
B) 61.80% resistance
C) 61.80% support
D) Hit the bottom
E) Hit the top
Stocks rise as they rise from support and fall from resistance. Our goal is to find a low support point and enter. It can be referred to as buying at the pullback point. The pullback point can be found with a Fibonacci extension of 61.80%. This is a step to find entry level. 1) Find a triangle (Fibonacci Speed Fan Line) that connects the high (resistance) and low (support) points of the stock in progress, where it is continuously expressed as a Slingshot, 2) and create a Fibonacci extension level for the first rising wave from the start point of slingshot pattern.
When the current price goes over 61.80% level , that can be a good entry point, especially if the SMA 100 and 200 curves are gathered together at 61.80%, it is a very good entry point.
As a great help, tradingview provides these Fibonacci speed fan lines and extension levels with ease. So if you use the Fibonacci fan line, the extension level, and the SMA 100/200 curve well, you can find an entry point for the stock market. At least you have to enter at this low point to avoid trading failure, and if you are skilled at entering this low point, with fibonacci6180 technique, your reading skill to chart will be greatly improved.
If you want to do day trading, please set the time frame to 5 minutes or 15 minutes, and you will see many of the low point of rising stocks.
If want to prefer long term range trading, you can set the time frame to 1 hr or 1 day.

MRK Merck Options Ahead of EarningsAnalyzing the options chain and the chart patterns of MRK Merck prior to the earnings report this week,
I would consider purchasing the 80usd strike price Calls with
an expiration date of 2026-1-16,
for a premium of approximately $8.50.
If these options prove to be profitable prior to the earnings release, I would sell at least half of them.

Undervalued, Oversold, Overlooked: MRK Hits The Key Zone!Hi all,
Merck & Co. (MRK) is a global pharmaceutical titan and is currently trading near its 52-week low of ~$79. Anchored by Keytruda’s 7% YoY revenue growth, a stable ~4% dividend yield, and an average fair value estimate of $156.59 (98% upside), MRK appears significantly undervalued.
Analysts forecast a 12-month price target of $118.05, implying 49% upside, supported by a strong pipeline and solid financials. While tariff concerns and Keytruda’s 2028 patent expiration pose risks.
Technically speaking, MRK has fallen 43% from its all-time high and has reached the strongest area on the chart—a key support zone offering a compelling opportunity to build mid- or long-term positions. This critical area is defined by multiple technical factors, creating a high-probability setup for a potential reversal:
Role Reversal Support: A broad, well-established resistance zone, aged like fine wine, has now flipped to act as support. This classic role reversal provides significant confluence to the setup.
Textbook Trendline: A perfectly respected trendline, straight out of technical analysis textbooks, has consistently held. The price has approached this trendline from higher highs, underscoring its strength as a key support level.
50% Retracement Level: A critical level often watched for potential reversals.
Monthly EMA200 Confluence: The 200-period exponential moving average on the monthly chart adds further strength to this area, reinforcing its technical significance.
Strategic Guidance:
This setup requires strong conviction. If you’re not prepared to buy in the lower gray areas of this support zone (marked on the chart), do not initiate a position.
In today’s market sentiment, your fundamental research must be robust, and technical analysis allows you to get that much confidence to make it happen!
Ask yourself: If the price falls further into the gray zones, am I willing to buy more? If your answer is yes, the current price presents a strong entry point for mid- to long-term positions.
If the answer is no—if you’re unsure about buying at lower levels or find yourself questioning what to do if prices drop further—refrain from starting a position. In volatile markets, clarity and discipline are essential. Only enter if your strategy is clear and your conviction matches the opportunity!
Good luck,
Vaido

Merck Wave Analysis – 8 April 2025- Merck broke strong support level 81.30
- Likely to fall to support level 75.00
Merck is under bearish pressure after breaking the strong support level 81.30 (the former monthly low from February, which stopped the earlier impulse wave 1).
The breakout of the support level 81.30 should accelerate the active downward impulse wave v, which belongs to wave 2 of the higher order impulse wave (3) from December.
Given the overriding daily downtrend, Merck can be expected to fall to the next support level 75.00, the target price for the completion of the active impulse wave v, coinciding with the daily down channel from December.

Merck & Co. (NYSE: $MRK) Sets Up Q125 Earnings Call for April 24Merck & Co. (NYSE: NYSE:MRK ) will hold its Q1 2025 earnings call on April 24 at 9:00 a.m. ET. Company executives will present financial results and performance updates during the call.
As of April 4th, 2025, MRK closed at $81.47, down $4.92 (5.70%). The stock has declined steadily since peaking at $134 in June 2024.
In Q4 2024, Merck posted global sales of $15.6 billion, a 7% increase from the previous year. Sales growth stood at 9% when excluding foreign exchange effects. Full-year 2024 revenue reached $64.2 billion, a 7% increase over 2023. Human health sales grew 8%, driven mainly by oncology treatments.
KEYTRUDA remained the company’s top product with sales of $7.8 billion in Q4, rising 21%. WINREVAIR generated $200 million in sales, while new vaccine CAPVAXIVE added $50 million. The Animal Health division showed strong momentum, growing 13% year-over-year. Merck’s global reach extended to nearly 500 million people in 2024.
However, GARDASIL vaccine sales dropped 18% in Q4 due to lower demand in China. This led Merck to pause GARDASIL shipments to the region temporarily. Operating expenses for the quarter totaled $7.4 billion. The company reported a gross margin of 80.8%, up by 3.6 percentage points. Earnings per share came in at $1.72.
For 2025, Merck expects revenue between $64.1 billion and $65.6 billion. EPS guidance is set at $8.88 to $9.03, excluding foreign exchange impact. The Medicare Part D redesign could reduce revenue by about $400 million in 2025. This would affect WINREVAIR and other small molecule oncology drugs.
Technical Analysis
MRK stock is currently testing a major support level at $81.A confirmed breakdown at this critical level could push the stock lower. Price momentum and volume suggest a likely continuation of the bearish trend unless support holds. With the bearish pressure in place, the next support level lies at $70.
The weekly chart shows consistent lower highs and lower lows since June 2024. MRK has fallen nearly 65% from its peak of $134.
If the $81 current support holds, a short-term rebound is possible, with an immediate resistance target around $95. Reclaiming this level may signal early signs of a trend reversal. If a strong break at the $81 level is witnessed, the next target remains the $70 support.
The current trend favors sellers. One thing to watch closely is the April 24th, 2025, earnings call as performance updates may provide clarity on near-term price direction.

MRK BEARISH BACK DOWN TO 87Full-time frame continuity across several higher timeframes, and a possible reversal happening on the 4h chart. Has a risk/reward ratio of 2:1.

How and When to switch from Selling Short to Buying Long Often times when the market is in a panic selling mode or trending down in a correction, stocks fall below their fundamental values. When that happens traders need to quickly close their sell short positions with buy to cover orders and prepare to start swing trading the velocity or momentum runs that will move price up quickly over a 3-6 day average run up to net profits as the stock rebounds back into or near its previous fundamental Level.
Being able to shift from selling short to buying long takes practice and experience. It also requires more Spatial Pattern recognition Skills to enable traders to react quickly and switch trading direction. Using center line oscillators helps with this trading activity.

Swing Long on Merck & CoI'm going long here on this healthcare company. Looking good for a rebound soon.

MRK 5M Long Investment Aggressive CounterTrend TradeAggressive CounterTrend Trade
- short impulse
+ exhaustion volume
+ volumed T1
+ volumed 2Sp-
+ weak test
+ first bullish bar closed entry
Calculated affordable stop limit
1/2 1M take profit
Hourly CounterTrend
"- short impulse
+ 1D SOS level"
Daily Trend
"+ long impulse
+ SOS level
- before 1/2 correction"
Monthly CounterTrend
"- short impulse
+ 1/2 correction
+ exhaustion volume?"
Yearly Trend
"+ long impulse
+ 1/2 correction
+ exhaustion volume?"

