MS trade ideas
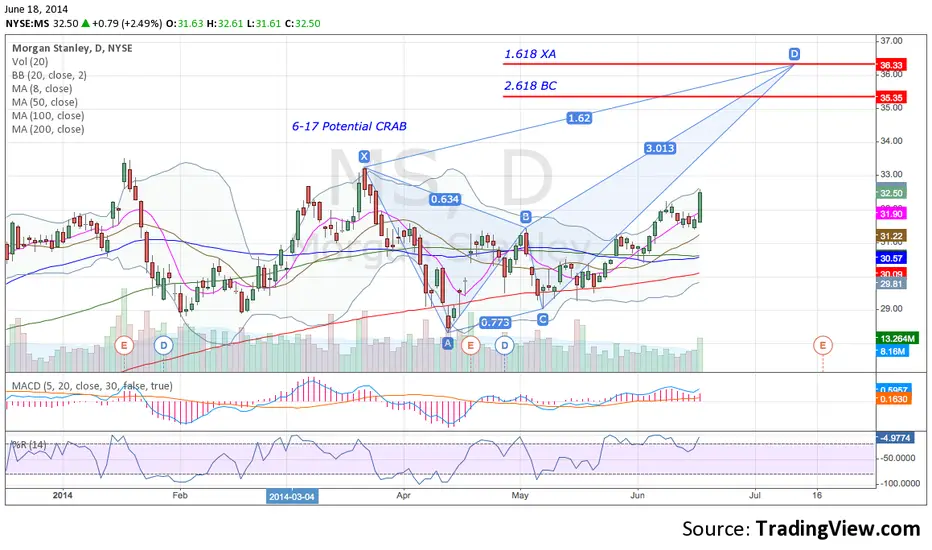
MSPotential CRAB. The problem is price is at the top of the daily and weekly bands. Price can ride along the daily bands when the weekly bands are open, but it has been a while since price has rode the weekly that way. Could take a while to fulfill.
Morgan Stanley - Candles and GapsThis is not a trade ideea, I just wanted to label what happened last 8 months, so when I will see the next signal i can compare it with the recent history.
The chart is kind of full, so I recommend you watch the numbers in the elipses and look for the explanation, not the other way around.
Now, about the chart, I can't make a 100% prediction on the resulting profit because I didn't trade these patterns, I just saw them today when I was looking at a breakout ideea posted by 'flavisam', but I think they would turn out quite profitable because all the losses were small and a few of the good trades had really good gaines. The only problem is the high frequency trading, which means many commisions, but I think that on a decent account at a decent broker it wouldn't be a problem.
As you can see, last 4 months we had fewer signals with more profitable trades, so let's hope this will continue.
I'm sorry if I missed anything, please point it out to me if u find something.
If I will see another pattern, I will post a comment.
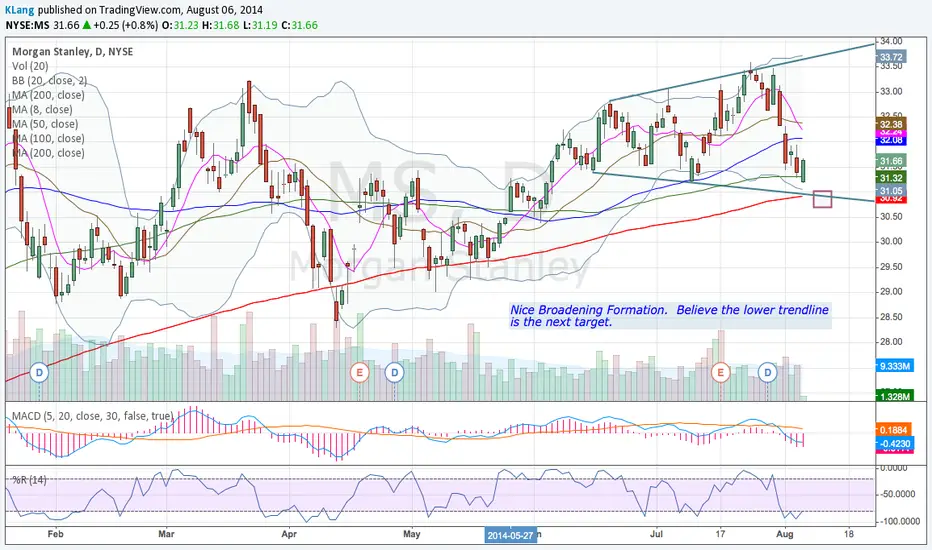
Right now we are in a consolidation period, I'm waiting for a breakout or a candle pattern at the bottom of the consolidation near the psychological level.

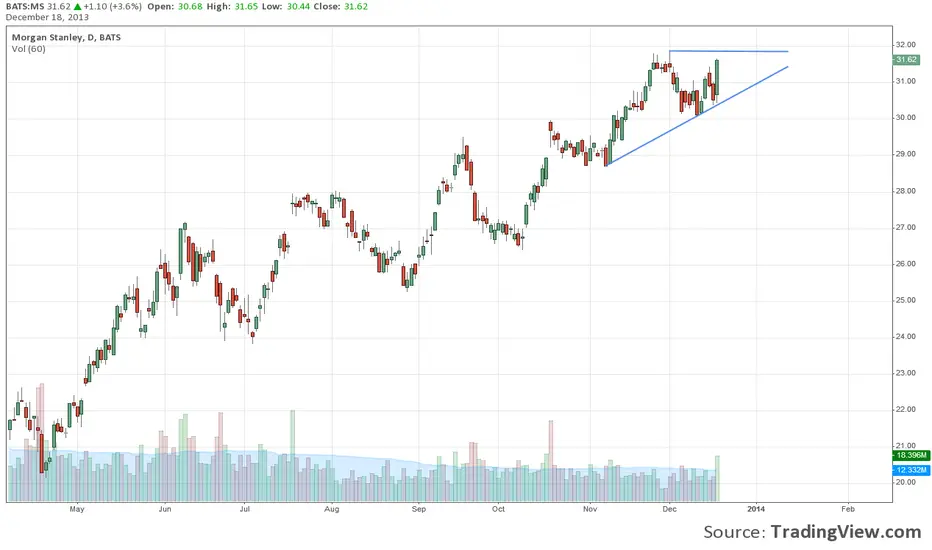


$MS (Daily) - New highs$MS looks to break past resistance $29.92. FMV is $33.00 so I'm looking for a ride on up.

MS Textbook Channel UP!I am planning to follow a short-term long strategy (5-7 days max) in MS as stated on the chart. I got long tier 2 size as planned on Friday, I will add tier 3 if price breaks out prior highs.
XLF showed relative strength and might lead other sectors next week if the reversal in SPY on Friday sustains. MS has been one of the best acting banks.
Total size and risk is small since price is extended right now.
If the stop triggers,I will try long ideas around the 85 MA(acting as strong support) or would try to buy near the channel support trend line.

MS- bearish patternMS developed a bearish pattern - like many other financials stocks. The break of the uptrend channel line would lead to lower levels.
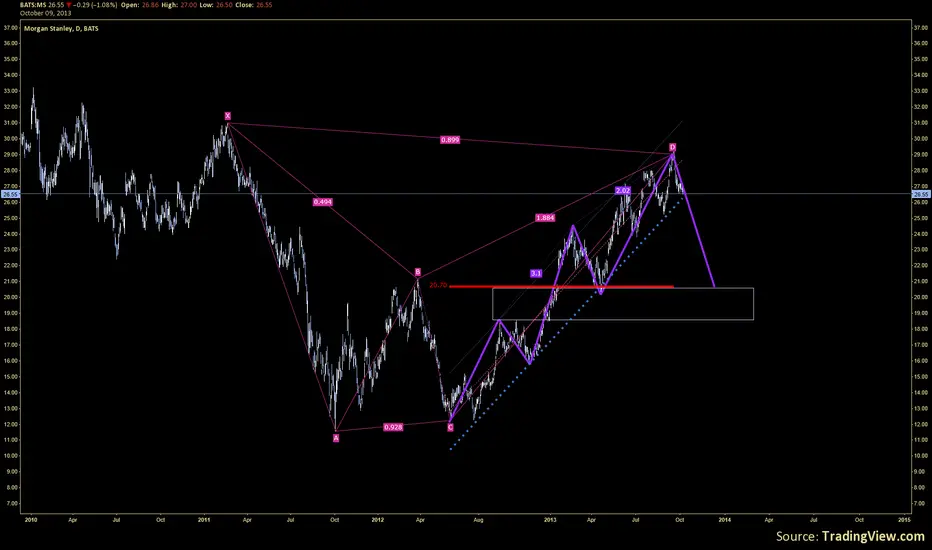

Chart request for @1991previa - tough nut to crack hereStay away from longs unless weekly close over 28. Cheers! MP

$SPY Hmm.Only a brake of 28 and this can lead us to ATH. Ichimoku, volume, rsi and MACD have different plans!

$SPY Financials in critical areaOnly a breakout above 27.96 and this can run! Again volume and ichimoku don't help for now!

MS Short swing trade idea7/2 MS Short swing trade set up. Closed below 50 SMA today. Short at the break of support in the 23.91-24.00 area, using the descending trendline to set a stop.
Could also short within the area of the trend lines with the same stop. That may be a little tricky since the 50 SMA could act as support if reclaimed.
1st target is top of the gap at 22.67. Next target is 20.77-20.95 zone. Full measured move target is 22.65, which is close to this support zone.


