Morgan Stanley descending. MSElliott flat, Gartley 222, Three drives, now past confirmation level. Fairly confident about this one going lower, much lower infact. Apex reaction may indicate end of Wave 5, but there is no way to tell here and now.
We are not in the business of getting every prediction right, no one ever does and that is not the aim of the game. The Fibonacci targets are highlighted in purple with invalidation in red. Confirmation level, where relevant, is a pink dotted, finite line. Fibonacci goals, it is prudent to suggest, are nothing more than mere fractally evident and therefore statistically likely levels that the market will go to. Having said that, the market will always do what it wants and always has a mind of its own. Therefore, none of this is financial advice, so do your own research and rely only on your own analysis. Trading is a true one man sport. Good luck out there and stay safe.
MS trade ideas

Will Morgan Stanley Bank continue in selloff?Morgan Stanley - 30d expiry - We look to Sell a break of 83.18 (stop at 86.32)
Short term bias has turned negative.
There is no indication that the selloff is coming to an end.
This stock fell 6.5 % last week.
A break of the recent low at 83.28 should result in a further move lower.
Short term MACD has turned negative.
Our profit targets will be 75.33 and 73.33
Resistance: 89.18 / 92.00 / 93.50
Support: 87.00 / 83.28 / 81.00
Please be advised that the information presented on TradingView is provided to Vantage (‘Vantage Global Limited’, ‘we’) by a third-party provider (‘Signal Centre’). Please be reminded that you are solely responsible for the trading decisions on your account. There is a very high degree of risk involved in trading. Any information and/or content is intended entirely for research, educational and informational purposes only and does not constitute investment or consultation advice or investment strategy. The information is not tailored to the investment needs of any specific person and therefore does not involve a consideration of any of the investment objectives, financial situation or needs of any viewer that may receive it. Kindly also note that past performance is not a reliable indicator of future results. Actual results may differ materially from those anticipated in forward-looking or past performance statements. We assume no liability as to the accuracy or completeness of any of the information and/or content provided herein and the Company cannot be held responsible for any omission, mistake nor for any loss or damage including without limitation to any loss of profit which may arise from reliance on any information supplied by Signal Centre.

MS - Short PositionOn the chart we can see the raising wedge pattern. It seems that the wedge is in its early stage of development.
We are expecting that the price will be consolidating inside the wedge for a while, before the breakout.
RSI currently is showing oversold conditions, therefore we believe that the price will bounce from the upsloping support.
We would enter the short position when (only if ) the price breaks down of the wedge.
Possible path is shown on the chart.
The target will be determined once the breakout occurs.
Good luck

Dark Cloud Cover Visible on Weekly in Morgan StanleyWe have a confirmed Weekly Dark Cloud Cover with 4 instances of Weekly Bearish Divergence and we are breaking down an up trending line I think it wouldn't be so crazy to bearishly target a 50-61.8% retracement from here.
MS - Minor Low BreakoutMS is the strongest stock in the XLF sector (Financial)
G/G trend with Vscore, Volume Profile, 21/34 propulsion, Darvas 3.0.
XLF has pulled back, but should resume trend with macro economic uncertainty (inflation reports/rate discussion) settles down.
Looking by the minor low breakout.
Prices with in the 13/21 propulsion dot levels.
Entry - $98.05
Profit - $99.80
25% stop loss
21APR23 97.5 Calls

$MS on the rise$MS on the rise,
In impulsive wave it flies,
Investors feel the prize.
Bulls take hold, gains soar,
Trading charts and stocks explore,
Excitement at the core.
(a nice poem by chatGPT)

$MS noticing the comparisons to Dot Com top in Jan/Feb of 2001$MS fun chart noticing the comparisons to Dot Com where many stocks topped in January and February of 2001 before legs lower. This is not my expectation but just pointing out some similarities

Morgan Stanley: Possible long EntryMorgan Stanley: Possible long Entry.
Currently market is trading in a uptrend in 4H chart and soon ongoing secondary trend is expected to end.
A major support at level of 84 may change the secondary trend.
Market is testing the level of 84 with a weak bearish approach. A falling wedge pattern is shown is charts.
A bullish movement is expected in upcoming sessions.
Market may test the resistance level of 94.50 in upcoming sessions.

$MS with a Neutral outlook following its earnings #Stocks The PEAD projected a Neutral outlook for $MS after a Positive Under reaction following its earnings release placing the stock in drift A with an expected accuracy of 90%.

Is this the return of MS with bitcoin over 20k this weekend will this help the W patten play out on the weekly chart ?????

Morgan Stanley to rise atleast 20% According to the bottom fishing program signal on H4 chart it would be logical to say that MS price will have a spike taking the price to 110 .

Another short ideaHere's another short setup I like; MS has a false breakout, has backtest/rejected, and has room down.

$MS with a Bullish outlook following its earnings #Stocks The PEAD projected a Bullish outlook for $MS after a Negative Under reaction following its earnings release placing the stock in drift D.

MS Morgan Stanley Options Ahead Of EarningsLooking at the MS Morgan Stanley options chain, i would buy the $75 strike price Puts with
2022-11-18 expiration date for about
$2.97 premium.
Looking forward to read your opinion about it.

Morgan Stanley Loosing. MSEnd of an upgoing impulse confirmed, initiating a new downward ABC pattern.
We are not in the business of getting every prediction right, no one ever does and that is not the aim of the game. The Fibonacci targets are highlighted in purple with invalidation in red. Confirmation level, where relevant, is a pink dotted, finite line. Fibonacci goals, it is prudent to suggest, are nothing more than mere fractally evident and therefore statistically likely levels that the market will go to. Having said that, the market will always do what it wants and always has a mind of its own. Therefore, none of this is financial advice, so do your own research and rely only on your own analysis. Trading is a true one man sport. Good luck out there and stay safe.

Morgan Stanley stock will be erased from markets -62%The stock chart warns of brutal hit to the downside

MS daily bullish hammerDIA daily bearish inside candle have to be quick. Already wicked in looks like a chop city.


MS: Medium term bears!Morgan Stanley
Short Term - We look to Sell at 87.23 (stop at 89.69)
The medium term bias remains bearish. There is scope for mild buying at the open but gains should be limited. Prices expected to stall near trend line resistance. Further downside is expected. Preferred trade is to sell into rallies.
Our profit targets will be 80.98 and 79.00
Resistance: 92.40 / 109.00 / 120.00
Support: 81.00 / 72.50 / 53.00
Please be advised that the information presented on TradingView is provided to Vantage (‘Vantage Global Limited’, ‘we’) by a third-party provider (‘Signal Centre’). Please be reminded that you are solely responsible for the trading decisions on your account. There is a very high degree of risk involved in trading. Any information and/or content is intended entirely for research, educational and informational purposes only and does not constitute investment or consultation advice or investment strategy. The information is not tailored to the investment needs of any specific person and therefore does not involve a consideration of any of the investment objectives, financial situation or needs of any viewer that may receive it. Kindly also note that past performance is not a reliable indicator of future results. Actual results may differ materially from those anticipated in forward-looking or past performance statements. We assume no liability as to the accuracy or completeness of any of the information and/or content provided herein and the Company cannot be held responsible for any omission, mistake nor for any loss or damage including without limitation to any loss of profit which may arise from reliance on any information supplied by Signal Centre.

The goal is $100The goal is $100. After parsing the SPX, I see a similar pattern of head and shoulders. The feeling is that we will fall to the level of $79 by the end of August. Then the upward movement, after the breakdown and consolidation of the $ 87 level, I see the goals of $ 93 and $ 100.

Swing short ideaHey all, I'm currently positioning myself for the next leg lower in the stock market. I am very confident Morgan Stanley's chart has topped out for a while to come and presents a safe shorting opportunity, in my opinion. I am looking for an entry *slightly* higher than where it currently rests. May try to time shorts when SPY gets to high 410's.
$MS with a Bullish outlook following its earnings #Stocks The PEAD projected a Bullish outlook for $MS after a Negative over reaction following its earnings release placing the stock in drift C with an expected accuracy of 33.33%.

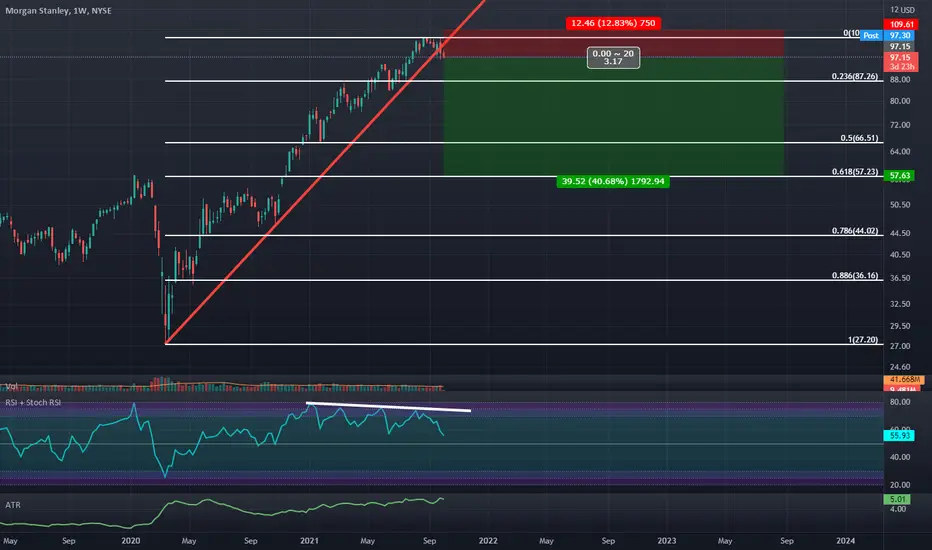
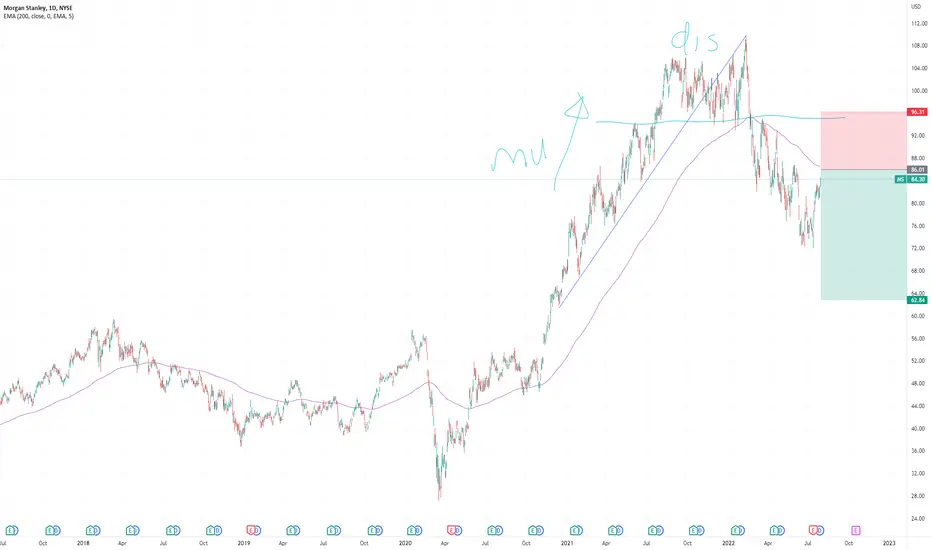
Rectangle TopVery long impulse wave with a bottom of 27.20 and a top of 109.73. MS reached it's high and looks it like price bounced around in a rectangle top for a while before breaking the bottom trend line which is now resistance. The bottom trendline of the rectangle top appears to have become the resistance line of yet another rectangle which has broken to the downside.
Price hit the yearly low earlier today at 76.89 and that is close to the .382 fib level of the impulse wave up (approximately 38% pull back of the wave up). The 2 year low is 35.53. 3 year low is 27.20.
There are a bunch of buyers in this impressive and steep rise up which is better viewed on weekly. (below)
Buyers often become sellers, eventually.
Short interest is lower than I expected at 1.46%.
Fundamentals look good. Dividend is 3.55% which is a substantial yield but comes with a high payout ratio of over 96%. The payout ratio shows the proportion of earnings a company pays its shareholders in the form of dividends, expressed as a percentage of the company's total earnings. In a perfect world, I would rather see a much lower payout ratio so that I feel the dividend is sustainable.
It seems there is no telling what the market will do hour to hour, much less day to day. I guess if one feels the market is finished pulling back, this could be a long. If one feels the market massacre is not over yet, then some would consider going short. Or some may sit on the side lines in cash like I am for the most part and watch the market. This could be my first true bear market and I am just trying to learn as much as I can. (o:
No recommendation
