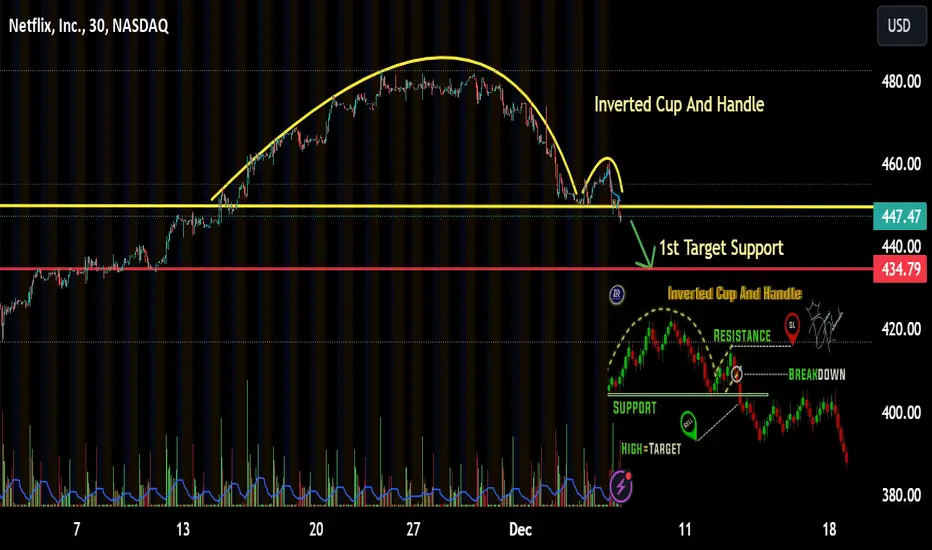
$NFLX Inverted Cup And Handle NASDAQ:NFLX I Found a Cup And Handle for you. My 1st target for next week would be 434ish area. Also tomorrows NASDAQ:AVGO ER should have an adverse effect on the market tomorrow along with eco data. It will be an interesting Thurs and Fri
NFLX trade ideas
NTFLX is Bullish .Weekly overall analysis shows that a continuation is still @ play to complete the structure to mitigate awaiting orders at premium zones to short the Markets.
Happy trading.

NFLX to Maintain Short-Term Range Bound Between 420 /480Analysis of Netflix (NFLX) Stock
NFLX appears to face a formidable resistance hurdle at 480, making it challenging for the stock to maintain levels above this threshold in the short term. This situation potentially sets the stage for a short-term reversal. In the event of such a scenario, investors might anticipate a bounce-back or rebound around the support levels of 420 and 436.
Netflix (NFLX) is currently encountering significant resistance around the 480 mark, indicating a challenging zone for short-term establishment above this level. Over the next six months, key support levels are anticipated to be within the range of 340 and 380, providing potential areas where the stock might find stability during downward movements.
For December 2023, the expected support levels are specifically noted around 420 and 436. In the event of a short-term reversal, it's likely that NFLX could experience a rebound within this range.
Looking at price targets, the projected target for NFLX in 2023 aligns with the resistance level at 480, while the forecast for 2024 suggests a target of 700.


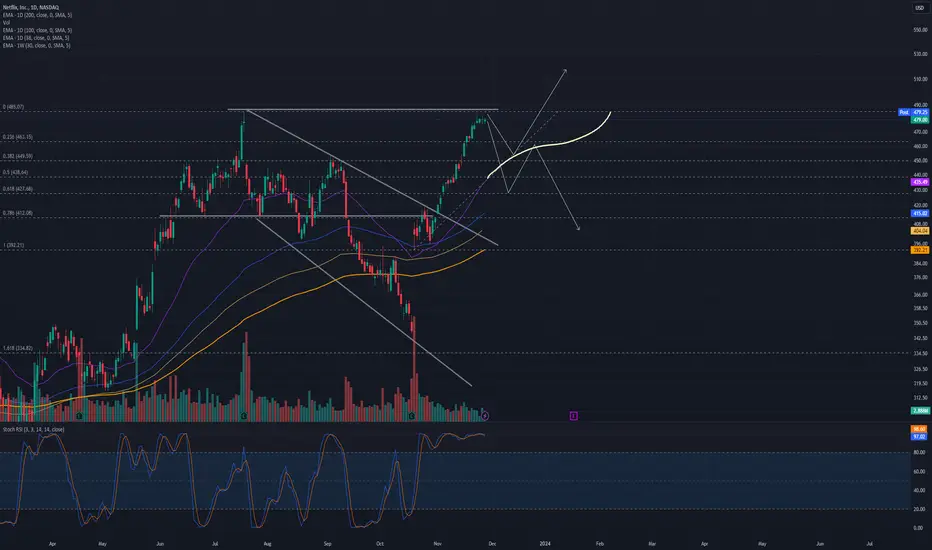
NFLX overbought, will rebound before breaking ATHNetflix loosing momentum and is likely to rebound to fibonacci levels before breaking the ATH. A rebound on the quickest Moving Average 38D will most likely trigger a breakthrough, while a rebound on the second quickest Moving Average 100D will recouchér back down up until recent down levels - Netflix would enter a sideway zone.
A rebound is prone to happen due a long-time overbought indication on the RSI.
NETFLIX Expect this rally to be extended.Almost a month ago (October 31) we gave a strong buy signal (chart below) on Netflix (NFLX) with the price reacting immediately having entered a non-stop rise:
Due to the sheer aggression of the current bullish leg of the Megaphone as compared to its previous ones though, we have to downgrade our medium-term target to $580, which will make a perfect +69.30% rise from the bottom as the July 18 High. Their RSI patterns are quite similar, though obvious that the current is more aggressive, hence will correct equally aggressively at some point, probably early-mid January 2024.
-------------------------------------------------------------------------------
** Please LIKE 👍, FOLLOW ✅, SHARE 🙌 and COMMENT ✍ if you enjoy this idea! Also share your ideas and charts in the comments section below! This is best way to keep it relevant, support us, keep the content here free and allow the idea to reach as many people as possible. **
-------------------------------------------------------------------------------
💸💸💸💸💸💸
👇 👇 👇 👇 👇 👇

Short $NFLX hereNASDAQ:NFLX looks like a great short here. Took some puts Nov 24 $437.5 and $435.
I'm expecting a retracement down to at least $413 or $396, however lower targets also possible (hence why I added the to the chart).

NFLX Nov 22, Gameplan Short! Expected Opening: Netflix (NFLX) is anticipated to open at $474.39.
Projected Range: Throughout the day, based on recent volatility, it might fluctuate between $465.09 and $484.81, suggesting a potential swing of +/- $9.86 (+/-2.08%).
Possible Movement: If it hits the extreme points, the estimated range could be around 4.15%.
Support and Resistance: There's no evident resistance above, and support is noted at accumulated volume @ $412.24, around 13.20% below the current price, making the risk-reward ratio seem favorable.
Insider Trading: Insiders at Netflix have been selling more shares than buying recently, which is often seen as a negative signal, with 221.7 thousand shares bought and 321.66 thousand shares sold in the last 100 trades. The last trade, made by Barton Richard N, was a purchase of 280 shares 14 days ago, but in general, there's more selling than buying among insiders.

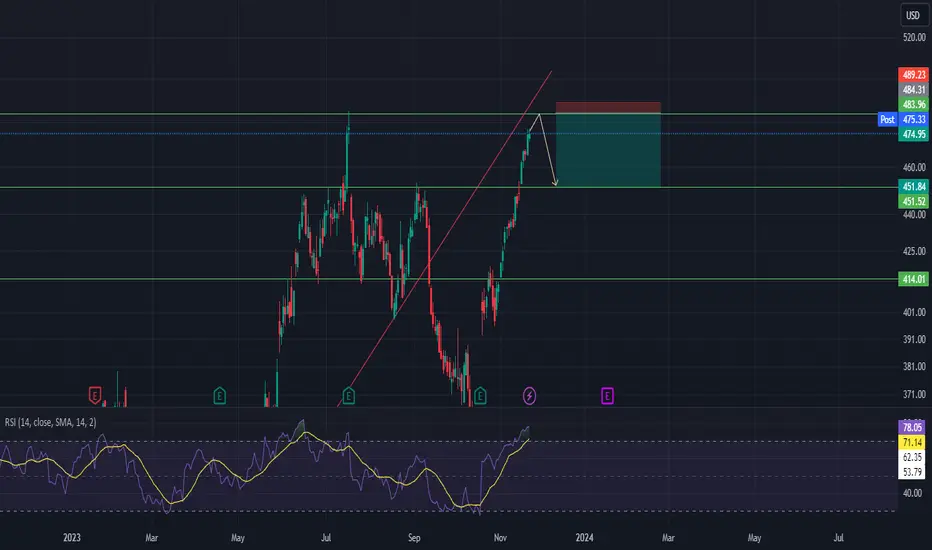
Netflix overbought at the resitancehi Traders
How are you?
NFLX has had a strong rally and it's approaching the resistance.
The pullback wouldn't be anything an extraordinary.
This is a speculative setup based solely on the technical analysis , especially RSI at super overbought teritory.
Entry , target and stop loss is show on the chart.
Do you agree? feel free to share your opinion in the comment section
Long signal on Netflix Hello,
We have a fantastic signal on Netflix with high probability and RR, cause of the breakout with significant volume,
I Hope you find my Idea benificial

NFLX AnalysisPrice filled the fair value gap at 346.37 and did not respected the bullish OB at 375.87 according to my last analysis. However, if you've been following my analysis, you would have expected a bounce off the gap. Price is on a nice bullish momentum and has filled the fair value gap at 459.25 made in July. Right now, I'm expecting price to (1) make a bearish retracement, back into the bullish OB at 418.84, or (2) take out the highs at 485.00 and then follow the analysis in (1).

Netflix respect the pitchfork levels Hello everyone,
Since the beginning of November, I've taken a position on buying Netflix stock, and there are several reasons for that. First, there's the breakout of the bearish channel that persisted for weeks. Second, the volume indicates the momentum of buyers, potentially pushing the market to the red line of Pitchfork levels.
It's evident that these levels are respected by the market, so there's a high probability that it could continue rising until it reaches this red line (around $500) for long-term investment (a few weeks).
I hope you find my analysis beneficial, and don't forget to hit the like and follow buttons for more ideas.

NETFLiX: $230 | Key Levelsfolks at $1.30 and $0.35 cents should be getting ready to upsize ..
and for those who sold at $10 and $20 ..
maybe an opportunity to get back on board Gamblers and Clueless folks at $700 and $600
hang in there and meet you halfway at $300

NFLX ~ Snapshot TA (Daily / Nov 2023)NASDAQ:NFLX chart mapping/analysis.
Bullish recovery back into ascending parallel channel (green).
Bull target(s)
Breakout descending parallel channel (white) + descending trend-line confluence resistance
Overhead gap fills (~470 / ~506.93 / ~566.88)
Golden Pocket Fib + gap fill (~506.93) confluence resistance zone
Bear target(s)
Underlying gap fills (~412.52 / ~354.79 / ~341.38)
Ascending trend-line support (light blue dotted)
38.2% Fib
23.6% Fib

Is Netflix Stock A Buy After Third-Quarter ReportsInternet television network Netflix (NFLX) has a commanding lead in the streaming video market but its growth has slowed. NFLX stock cratered in 2022 after the company reported two straight quarters of subscriber declines. However, after a corporate course correction, some people might be wondering: Is Netflix stock a buy right now?
Subscriber Growth Drives Netflix Story
Netflix stock has benefited from the cord-cutting trend as people quit traditional pay-TV services.
Over the last several years, Netflix has been laser-focused on growing its global subscriber base. It wants to build a competitive moat with scale. It has been investing heavily in local-language original content production worldwide. Netflix stock performance is linked to its net subscriber additions.
But Netflix stock tumbled 51% in 2022 as subscriber growth stalled. Growth has rebounded in 2023 thanks to the addition of a lower-cost, advertising-supported service as well as a crackdown on unpaid account sharing.
In the third quarter, Netflix added 8.76 million subscribers worldwide, vs. forecasts for 6.06 million. It ended the third quarter with 247.15 million subscribers worldwide.
Netflix also announced price increases for its ad-free service plans in the U.S., U.K. and France.
Netflix stock soared 16.1% on the first trading day after it posted third-quarter results late Oct. 18.
Netflix Stock Fundamental Analysis
In the September quarter, Netflix earned $3.73 a share on sales of $8.54 billion. Analysts had called for earnings of $3.49 a share on sales of $8.54 billion. On a year-over-year basis, Netflix earnings rose 20% while sales climbed 8%.
However, Netflix's financial guidance for the fourth quarter was a tad below Wall Street's targets.
For the current quarter, Netflix predicted earnings of $2.15 a share on sales of $8.69 billion. Analysts had been looking for earnings of $2.17 a share on sales of $8.78 billion in the fourth quarter. In the year-earlier period, Netflix earned 12 cents a share on sales of $7.85 billion.
After a humbling performance in 2022, Netflix says it is focused on profitability. It also is targeting increased revenue with a lower-priced, advertising-supported service tier. Plus, it is looking to monetize rampant account sharing on the service and turn freeloaders into paying customers.
The next major catalyst for Netflix stock could be the company's fourth-quarter earnings report, due in late January.
Netflix Content Draws Subscribers
Since it started its original content push, Netflix has launched quite a few hit shows. They include "Stranger Things," "Squid Game," "Wednesday," "Ozark" and "Bridgerton."
It also has premiered popular original movies such as "Bird Box," "Extraction," "Murder Mystery," "The Old Guard" and "Red Notice."
Recent buzzworthy shows on Netflix include TV series "One Piece," "FUBAR" and "The Fall of the House of Usher." Popular new original movies include action films "The Mother" and "Extraction 2" and comedy "You People."
Meanwhile, Netflix is facing competition from traditional media companies. Max from Warner Bros. Discovery (WBD) launched in May 2023. Paramount Global (PARA) debuted Paramount+ in March 2021. Comcast (CMCSA)-owned NBCUniversal launched Peacock in July 2020.
Other services include Amazon (AMZN) Prime Video, Apple's (AAPL) Apple TV+, Walt Disney's (DIS) Disney+, Hulu and more.
Netflix Enters Video Game Market
To create a stickier service, Netflix added mobile video games as part of its subscription offering in November 2021. Subscribers can play the games on Android and Apple iOS smartphones and tablets.
Since September 2021, Netflix has purchased four game studios. It bought Night School Studio, Next Games, Boss Fight Entertainment and Spry Fox. It also has opened two new game studios.
Netflix currently offers about 80 games to subscribers. They include action, arcade, puzzle, racing, sports and casino games.
Netflix Stock Technical Analysis
On May 18, Netflix stock broke out of a cup-with-handle base at a buy point of 349.80. It climbed as high as 485 on July 19 before pulling back. Netflix hit its record high of 700.99 in November 2021.
Price Momentum
NFLX is trading near the top of its 52-week range and above its 200-day simple moving average.
What does this mean?
Investors have been pushing the share price higher, and the stock still appears to have upward momentum. This is a positive sign for the stock's future value.

Strong Bullish trend on NITFLIX Hello enveryone,
Based on my analysis of NITFLIX stock on the 1-hour chart, there is a high probability of a continuation of the bullish trend for Intel 480$ in the next few days.

Netflix Surges 28% Since Q3 EarningsNetflix's stock in 2021 has been a rollercoaster, starting with a strong 62% rise by July, nearing the $500 mark, before experiencing a sharp downturn. The stock fell below the crucial 200-day moving average to around $370, marking a significant 28% drop, but found some support at the weekly 50-day average near $350.
The Q3 earnings report was a turning point, with actual earnings of $3.73 surpassing the estimated $3.49. This led to a positive market reaction, with the stock opening 16% higher post-announcement and climbing 28% since then. The surge in earnings was primarily due to robust subscriber growth, a key indicator of the company's future financial health and stock potential.
Looking ahead, Netflix faces major resistance levels, first at the $500 psychological mark, and then at last year's high of $609. Overcoming these barriers could signal further bullish trends. As of November, the stock is showing strong performance with an 8% increase, adding to the positive outlook among investors.
If you enjoyed this post, make sure to like, and follow for more quality content!
If you have any questions or comments, comment below. We reply to every comment!
See below for more information on our trading techniques.
As always, keep it simple, keep it Sublime.

$NFLX Near A Strong ZoneNetflix stock came to a strong zone where in the past showed great buy and sell moves. The next confirmation (rejection or breakout) will show us the way of the price.

NETFLIX SHORT?NFLX short - take profit before earnings?
I shorted Netflix at $430. Up 20% on the position. Take profit before earnings tomorrow? What's your opinion on NFLX? Bear or bull? The mainstream media seems quite ambiguous ahead of earnings.
I took a lot of profit this year so I thought about sitting on it until next year. But I could also dump some of my NVDA short (325 avg) that I got over my head on.
this is not a financial advice.
Trade at your own risk.
follow for more.

Long Signal on NITFLIX Hello enveryone,
We Have a fantastic long Signal on NITFLIX, with high probabilite and good Risk reward ration,
The target on this trader is going to be 450, with a stop loss of 439,
I Hope you find my Idea benifical, and make sure to hit the like and follow buttom for more ideas.

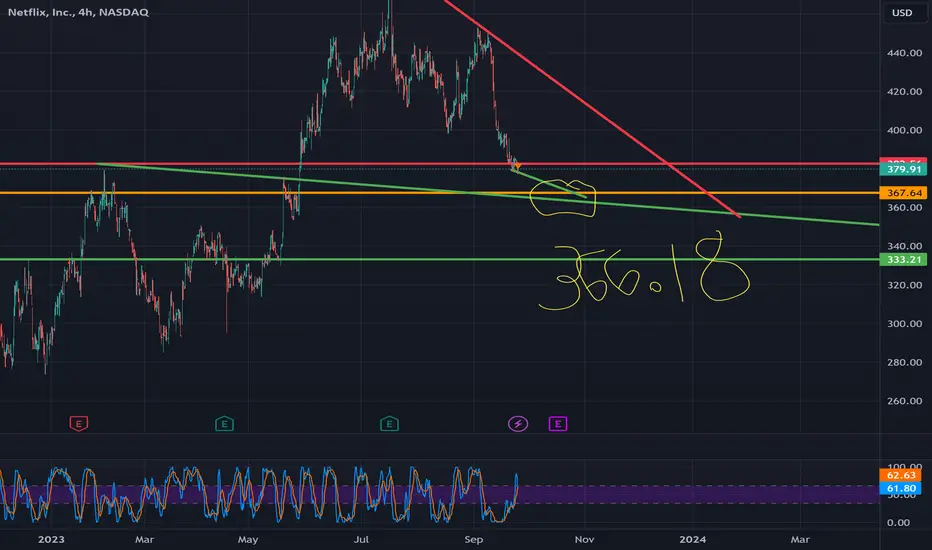
netflix approaching a big jumping pointHoly smokes, this is lining up for one huge final pump. If she holds 365, there is potential to rocket all the way up to 436. It won't be in 1 night, you'll have time to buy and sell, but it won't be a lot of time. You'll likely start seeing big AH movements, and a bunch of solid green days in a row as it climbs.
There is a chance it breaks down to 333, but again, there should be time to exit and reset your trade before it gets all the way down there. I would favor the upside pretty heavily on this trade, however, WAIT until it bounces off trend. If it hits the red trend, enter short on the rejection. If it climbs down and hits the green, go long on the support bounce.
NFLX-SELL strategy 4-hourlyLet's be honest here. The move up was extreme, and now the pattern starts looking weak. We are starting to be overdone, and for that reason a SELL may be the way to go.
Strategy SELL @ 433.00-437.00 and place SL @ 452.00. Profit order @ 431.50.

NFLX retesting broken trend + (M)MA50Typical pattern, longer trend broken, NFLX dropped 80% from its peak and now full retest to the trend. (M)MA50 is important MA, so far market retested broken trend and dropped below (M)MA50 which is 412$. Looks like "dead-cat" bounce.
