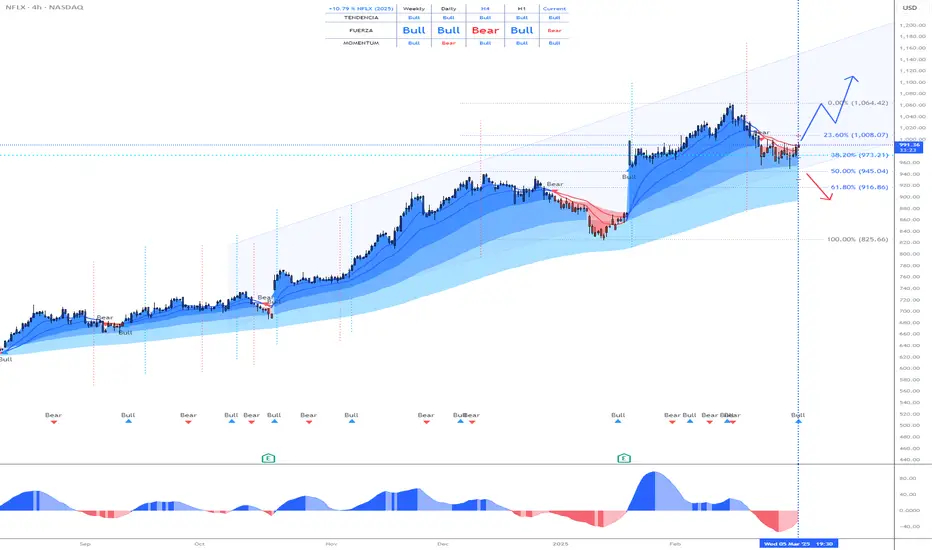
Pivoting Drop on Netflix. NFLXLast short idea was profitable for us, and I think this is a time for a pivot now. Price action is king. The drop down looked like ABC of a larger zigzag A wave, so now B which may be quite protracted. Fib goals here are for illustration purposes, as I recommend you never keep your goals stationary but use an adaptive indicator or indicator pair to exit.
NFLXCL trade ideas

Netflix: New All-time High!As expected, Netflix reached a new all-time high at $1,067, completing the magenta wave . Since then, the stock has already pulled back by nearly 20%. The ongoing magenta wave should extend further into our new magenta Target Zone, which spans $789.04 to $704.43. Since we anticipate a sustainable rebound from this range, it presents an opportunity to initiate or expand long positions. Such long entries could be hedged with a stop 1% below the Zone’s lower boundary, as there is a 30% chance that Netflix will drop below the Zone to complete the green wave alt. .

OMNICHART presents => NFLX - long term trendNetflix is still in an upward channel - in a long term bullish trend. In the coming months if it meets the support line and bounces off then that would be the time to buy leaps or scale into additional long term positions. Or start scaling in along with a put spread/s until the support line for a year. A tweak in the trade do make additional income would be to sell put at the support line for every week or month and most likely it will expire worth less and then sell a subsequent put (for week or month) at a point higher on the support line , basically keep selling your puts on the support line as time moves along and the price is above the support line. This was you might just cover the price of the long put you bought today and even make additional income. And if the stock goes up you are still making money. This buys you additional protection for free based on how disciplined you are with managing the put spread (especially the short end of it).

Netflix (NFLX) Shares Among the Biggest Losers in the US MarketNetflix (NFLX) Shares Among the Biggest Losers in the US Stock Market
According to market charts:
→ Netflix (NFLX) shares fell by approximately 8.5% during yesterday’s trading session, indicating that bulls failed to sustain the price above the psychological $1,000 per share level.
→ The S&P 500 index (US SPX 500 mini on FXOpen) hit a new low for 2025, closing down around 1.3%.
These declines reflect bearish sentiment in the US stock market, which may be driven by:
→ Uncertainty over Trump’s trade tariff policies. Yesterday, the White House postponed the introduction of tariffs on trade with Canada and Mexico for a second time, now pushing the deadline to early April.
→ Anxiety ahead of the Non-Farm Employment Change report release (scheduled for today at 16:30 GMT+3), as recession fears continue to mount.
Selling pressure was particularly strong in Netflix (NFLX) shares, as analysts (according to media reports) issued a cautious outlook on subscriber growth for the streaming giant. This may stem from concerns that the company's low-cost, ad-supported subscription model is losing its initial positive impact.
Technical Analysis of Netflix (NFLX) Stock Chart
Price movements in 2025 have formed an upward channel (marked in blue), which remains intact for now.
The $955 level, which previously acted as support, may now serve as resistance. If bearish sentiment persists, the price could continue its downward trajectory. However, bulls may find hope in key support areas, including:
→ The lower boundary of the current price channel.
→ The $870 level, which marks the lower limit of a broad bullish gap formed after a strong quarterly earnings report (as we noted on 23 January). This level has also acted as a key reversal point multiple times.
Analysts’ Forecasts for Netflix (NFLX) Stock
Overall, analysts remain optimistic. According to TipRanks:
→ The average 12-month price target for NFLX is $1,100.
→ 29 out of 37 analysts recommend buying NFLX shares.
Trade on TradingView with FXOpen. Consider opening an account and access over 700 markets with tight spreads from 0.0 pips and low commissions from $1.50 per lot.
This article represents the opinion of the Companies operating under the FXOpen brand only. It is not to be construed as an offer, solicitation, or recommendation with respect to products and services provided by the Companies operating under the FXOpen brand, nor is it to be considered financial advice.

NETFLIX: First warning of the END of the retracement!
On January 22, Netflix presented results that widely beat market estimates:
--> Sales 10,247 million dollars (+16% YoY) vs. 10,106 million dollars estimated by the consensus and 10,128 million dollars estimated by the company.
--> EBIT 2,243 million dollars (+52%) vs. 2,200 million dollars consensus and 2,190 million dollars estimated by the company.
--> BNA 1,869 million dollars (+99%) vs. 1,830 million dollars consensus and 1,847 million dollars estimated by the company.
--> EPS 4.27 dollars (+102%) vs. 4.18 dollars consensus and 4.23 dollars estimated by the company.
New subscriptions reach +18.9M, +44% YoY, vs. +9.2M expected. As anticipated by the Company, this is the last quarter in which it will publish this data. Total subscriptions exceed 301M (+15.9% YoY).
-----------------------------------------------------------------
The share price reached its historical maximum on February 18th at 1,064 and has not stopped falling since then, due to the fact that the Nasdaq index began a correction caused mainly by the volatility generated by trade tariffs.
--> What is the technical situation?
The technical aspect is CLEARLY BULLISH and any setback in the price will be a good opportunity to enter the stock.
It has reached a 50% Fibonacci retracement (945), an area that it has respected, and that therefore, can be taken as the LOWER to start a NEW BULLISH IMPULSE.
--> What risks does it have?
Trump's TARIFFS, since they can cause falls in the NASDAQ INDEX that drag down the entire market. But the Nasdaq index is in a VERY PROBABLE LOWER area, so the ENTIRE market could rise strongly in the next few days.
-------------------------------------
Strategy to follow:
ENTRY: We will open 2 long positions if the H4 candle closes above 992
POSITION 1 (TP1): We close the first position in the maximum area (1,061) (+7%)
--> Stop Loss at 940 (-5%).
POSITION 2 (TP2): We open a Trailing Stop type position.
--> Initial dynamic Stop Loss at (-5%) (coinciding with the 940 of position 1).
--> We modify the dynamic Stop Loss to (-1%) when the price reaches TP1 (1,061).
-------------------------------------------
SET UP EXPLANATIONS
*** How do we know which 2 long positions to open? Let's take an example: If we want to invest 2,000 euros in the stock, what we do is divide that amount by 2, and instead of opening 1 position of 2,000, we will open 2 positions of 1,000 each.
*** What is a Trailing Stop? A Trailing Stop allows a trade to continue gaining value when the market price moves in a favorable direction, but automatically closes the trade if the market price suddenly moves in an unfavorable direction by a certain distance. That certain distance is the dynamic Stop Loss.
-->Example: If the dynamic Stop Loss is at -1%, it means that if the price drops by -1%, the position will be closed. If the price rises, the Stop Loss also rises to maintain that -1% in the rises, therefore, the risk is increasingly lower until the position becomes profitable. In this way, very solid and stable price trends can be taken advantage of, maximizing profits.
NFLX - NetFlix is overhyped an TA says tooBesides what I think about NFLX (bad for you, poor quality & service, lairs etc.), there is something that can be used to rate and judge a Stocks pricing - The Technical Analysis.
The white Fork projects the most probable path of price. The U-MLH is the upper stretch, the L-MLH the lower and the CL is the Center, where price is in equilibrium.
Where is price now?
It mooned to the upper Warning-Line!
Such moves are insane, crazy, not healthy and produce by manipulation and/or greed that eats Brains.
However - As I follow the rules of the Medianlines (Forks), I know that price is hyper extended up there. So, it can't go further? Of course it could. But Chances are poor that it will.
Instead, Chances are high that price falls down to the U-MLH. At least.
Why?
Besides price is stretched, it failed to move up to the next Warning Line (WL2).
So, there you have it.
I'm shorting NFLX and my target is at least the U-MLH, with further downside potential with PTG2 at the Centerline.

NFLX long swing (conditional)Intraday profits taken. Tradingview doesn't let less than 15m timeframe chart to be published. The path was drawn on 5m chart when 15m candle created displacement above the H1 SIBI. This long trend idea depends on how indices do. For NFLX the technicals are there and any support from indices would see NFLX move higher, and possibly the weekly reversal with the President possibly announcing something later today that may impact the market. A bit of uncertainty around, but let's see.

Netflix (NFLX) Scalping Strategy🔥 Market Overview:
Trend: Short-term recovery, but price remains under key resistance.
Key Levels:
Resistance: $995.00, $1,010.00
Support: $987.00, $975.00
Indicators:
EMA9 near EMA200 → Price consolidating near equilibrium.
MACD negative → No strong bullish momentum.
RSI at 52.41 → Neutral, no clear divergence.
Risk of Short Squeeze? Low—only if price breaks $995.00.
Market Maker Activity: Some accumulation, but still within a range.
🔥 Scalping Strategy:
🩸 1. Momentum Scalping (If Breakout Above $995.00)
Buy near: $995.10
Target: $1,010.00
Stop-loss: $990.00
Risk-to-Reward: 1:2
🩸 2. Range Scalping (If Price Holds $987 - $995)
Buy near: $987.00
Sell near: $995.00
Stop-loss: $985.00
Profit Potential: ~2.4%
🩸 3. Breakout Scalping (If Below $987.00)
Short below: $987.00
Target: $975.00
Stop-loss: $990.50
Risk-to-Reward: 1:3
🔥 Mid-Term Trend Forecast (1-3 Weeks):
If $995.00 holds, Netflix could push towards $1,010.00 - $1,020.00.
If $987.00 fails, expect a drop to $975.00.
🔥 News & Market Context:
Netflix facing pressure to increase production in Los Angeles → Potential regulatory risks.
Stock up 1.31% today → Short-term bullish momentum but not decisive.
Earnings in 55 days → No immediate catalyst for a big move.
👑 Trade Rating (1-10):
Range Scalping: 7/10 (Good but needs confirmation).
Momentum Long Above $995.00: 8/10 (Breakout setup).
Short Below $987.00: 9/10 (Best risk-reward setup).
🔥 Decision:
🩸 Short-term Play: Range scalping $987 - $995 until a breakout.
🩸 Mid-term Play: Break above $995.00 = long; below $987.00 = short.
🩸 Ideal Play: Watch for price reaction at $995.00 before committing.
👑 Final Verdict: Wait for confirmation—price is still in a range.
🔥 LucanInvestor's Quote:
"Trade the setup, not the hype."

Netflix (NFLX) Scalping & Mid-Term Analysis🔥 Market Overview
Trend: Bearish 📉 (Strong downtrend)
Resistance: $972.00 → EMA 9, acting as a short-term ceiling
Support: $955.00 → Local demand zone
Indicators:
MACD: Bearish, no reversal confirmation
RSI: 41.53 (Neutral, no oversold signal yet)
VWAP: Below average, sellers still in control
🩸 Risk: NFLX is in a short-term freefall—possible more downside
🔥 Scalping Strategy (5x Leverage)
🩸 Momentum Scalping:
Buy: Near $955.00–$958.00, targeting $965.00 (+1.0%)
Sell: Near $970.00–$972.00, targeting $958.00 (-1.2%)
Stop-loss: Below $952.00
🩸 Breakout Scalping:
Above $975.00: Long to $985.00 (+1.6%)
Below $955.00: Short to $945.00 (-1.5%)
🔥 Mid-Term Trend Forecast (1-3 Weeks)
Bullish above $980: If momentum shifts, expect $990-$1000
Bearish below $950: Freefall potential to $930-$920
🔥 News & Market Context
🩸 No immediate catalysts, earnings in 56 days
🩸 Sellers dominating, no major support nearby
🔥 Decision:
🩸 Short-term: Scalp long near $955.00, sell at $965.00+
🩸 Mid-term: NFLX is weak—best play is waiting for lower entries
🩸 Ideal Play: Short bounces, confirm strength before aggressive longs
👑 Final Verdict:
"Falling knives don’t make safe catches—wait for the grip." – LucanInvestor

NFLX, Short, 1D✅ NFLX formed a clear rising wedge pattern and rejected the resistance, signaling a slight bearish move. The price is expected to move lower toward the support of the rising wedge.
SHORT 📉
✅ Like and subscribe to never miss a new analysis! ✅

Netflix Flips. NFLXA correction is well overdue on this one. There is a convincing constellation of indications on this price action, so where to begin?
A five wave impulse appears to be complete, and price action reverses tonality of the previous impulsive bullish candles. Divergences on RSX, BB%PCT. MIDAS line is crosses, while vWAP and US lines are aligned and are above the candle. VZO crossed bearishly and trigger line crossed the ribbon. BB%PCT is now bearish crossing the zero line and Ehler's Stochastic RSI is bearish as well and has been for a while.

NFLX 2-21🔥 Market Overview:
Trend: Bearish; price rejected at resistance and struggling to reclaim key levels.
Key Levels:
Resistance: $1,030, $1,045.
Support: $1,020, $1,010.
Indicators:
MACD: Bearish crossover, indicating downside pressure.
RSI: 55.05, neutral but losing momentum.
Supertrend: Bearish, confirming short-term weakness.
🔥 Scalping Strategy:
🩸 1. Momentum Scalping
Buy near: $1,020, targeting $1,030 (+1.0%).
Sell near: $1,030, targeting $1,022 (-0.8%).
Stop-loss: Below $1,015.
🩸 2. EMA Pullback Scalping
Buy near: $1,020 (EMA 9), targeting $1,028 (+0.8%).
Sell near: $1,030, targeting $1,020 (-1.0%).
Stop-loss: Below $1,015.
🩸 3. Breakout Scalping
If $1,030 breaks, enter long toward $1,045 (+1.5%).
If $1,020 fails, short toward $1,010 (-1.0%).
🔥 Mid-Term Trend Forecast (1-3 Weeks):
Holding above $1,020 could trigger a recovery toward $1,045.
A breakdown below $1,010 confirms a deeper correction.
Short-term weakness dominates unless bulls regain control.
🔥 News & Market Context:
Netflix remains volatile, trading within a defined range.
No major catalysts, leaving technicals to dictate movement.
Broader market conditions favor defensive trading.
🔥 Decision:
🩸 Short-term: Scalping between $1,020–$1,030 is the best play.
🩸 Mid-term: Bearish unless $1,030 is reclaimed.
🩸 Ideal Play: Trade with caution—no strong momentum shift yet.
👑 Final Verdict:
Markets punish hesitation—either execute or stay out.
🔥 LucanInvestor:
"Only those who adapt to market shifts survive."

Netflix Scalping + Forecast (2-19)🔥 Market Overview:
Trend: Strong bullish momentum, but facing short-term resistance.
Key Levels:
Resistance: $1,062.50 (Supertrend level), $1,080.
Support: $1,029.00, $1,007.00 (EMA 200).
Indicators:
MACD: Weakening bullish momentum—potential for a short-term pullback.
RSI: 56.11, showing slight overbought conditions but still in neutral territory.
Supertrend: Bullish, but the trend is flattening.
🔥 Scalping Strategy:
🩸 1. Momentum Scalping
Buy near: $1,040.00, targeting $1,060.00.
Sell near: $1,062.50, targeting $1,030.00.
Stop-loss: Below $1,028.00.
🩸 2. EMA Pullback Scalping
Buy near: $1,029.00 (Supertrend support), targeting $1,050.00.
Sell near: $1,062.50, targeting $1,035.00.
Stop-loss: Below $1,020.00.
🩸 3. Breakout Scalping
If $1,062.50 breaks, enter long toward $1,080.
If $1,029.00 fails, short toward $1,000.
🔥 Mid-Term Trend Forecast (1-3 Weeks):
If price holds above $1,029.00, expect continuation toward $1,080+.
If it fails, a retracement to $1,000 is likely.
The trend remains bullish, but consolidation is expected.
🔥 News & Market Context:
NFLX continues its uptrend, but momentum is slowing.
No major catalysts—price action is technical.
🔥 Decision:
🩸 Short-term: Scalping within the $1,029–$1,062 range is ideal.
🩸 Mid-term: Wait for a breakout confirmation.
🩸 Ideal Play: Trade within the range while watching for breakout potential.
👑 Final Verdict:
A strong trend does not mean a free ride—resistance is the test of conviction. Trade with precision or watch from the sidelines.
🔥 LucanInvestor’s Statement:
"Markets reward those who act with certainty. Hesitation is the graveyard of opportunity."

Earnings Season: How to Trade Post-Earnings Drift
Earnings season is in full swing, and while many traders focus on the immediate reaction to a company’s results, consider longer-term trends following earnings announcements that may deliver returns long after the earnings release— Post-Earnings Drift (PED) .
PED is based on a simple yet effective concept: stocks that react positively to strong earnings tend to continue drifting higher, while stocks that react negatively to weak earnings tend to continue drifting lower. This drift can persist for weeks or even months, making it one of the most efficient ways to trade earnings season.
Let’s break down how to identify these potential opportunities, which may have a positive risk-reward profile, and manage positions effectively.
Step 1: Fundamentals – The Catalyst for the Drift
Post-earnings drift is strongest when there’s a clear fundamental catalyst behind the move. Not every earnings beat leads to sustained upside, and not every earnings miss results in prolonged weakness. What matters is whether the report genuinely shifts market expectations.
Key factors to look for:
· Stronger-than-expected revenue and profit growth – The market rewards companies that deliver above expectations.
· Forward guidance upgrades – If management raises expectations, it signals confidence in future growth.
· Margin expansion and improving financial health – Investors want to see profitability improving alongside revenue growth.
· Shifts in business strategy – Companies that announce major structural improvements, such as cost-cutting initiatives or new revenue streams, often see extended moves.
The key is that the earnings report must provide a reason for continued buying or selling pressure. If the reaction is based on short-term noise rather than a fundamental shift, the drift is less reliable.
Step 2: Market Reaction – Confirmation of the Catalyst
Once you’ve identified a strong fundamental catalyst, the next step is looking at the market’s reaction. Not every stock gaps after earnings, but the reaction should provide evidence that the earnings release is driving demand.
Signs of a strong bullish reaction:
· Above-average volume – Institutions don’t place all their trades in one day. High volume suggests big money is stepping in.
· A decisive move higher – A stock that closes strong after earnings has a better chance of continuing higher.
· Follow-through buying in the days after earnings – If the stock remains bid up after the initial reaction, it suggests real demand rather than a temporary spike.
Signs of a strong bearish reaction:
· Heavy selling on high volume – Institutions unloading shares is a warning sign.
· Failure to bounce after the initial drop – Weak stocks tend to stay weak, especially if buyers don’t step in.
· Breaking key support levels – A stock that falls below major technical levels often sees continued selling.
Step 3: Trade Entry & Risk Management
Once you’ve identified a stock with a strong earnings catalyst and a clear market reaction, the next step is executing the trade.
Entry Strategy
For bullish trades: Enter on the first meaningful pullback after the initial earnings reaction. Look for a retest of intraday support or a consolidation period before the next leg higher.
For bearish trades: Enter on a weak bounce that fails to recover key levels, or on a breakdown below the post-earnings low.
Setting Stops Using ATR
The Average True Range (ATR) is a useful tool for setting stops, as it accounts for volatility. A common method is placing a stop 1.5x to 2x ATR below your entry for long trades (above for shorts). This ensures your stop is wide enough to avoid getting shaken out by normal price swings.
Managing the Trade with the 21-EMA
The 21-day Exponential Moving Average (21-EMA) is an excellent trailing stop for PED trades.
· As long as the stock stays above the 21-EMA, the drift remains intact.
· A close below the 21-EMA is a signal to exit the position.
This method allows traders to ride the trend while avoiding premature exits.
Real-World Example: Netflix’s Post-Earnings Drift
Let’s look at how this played out with Netflix (NFLX) after its Q3 2024 earnings report.
On October 17, 2024, Netflix reported:
· Earnings of $5.40 per share, beating estimates of $5.12.
· Revenue of $9.825 billion, slightly above expectations.
· A strong subscriber growth report, with 5.1 million new additions—exceeding forecasts by over 1 million.
· Ad-supported subscriptions surging past 50% of new sign-ups in available countries.
· Price hikes announced for Spain and Italy, signaling confidence in pricing power.
The stock reacted positively, gapping up nearly 5% on above-average volume.
Over the next two months, Netflix continued drifting more than 20% higher, confirming the post-earnings drift effect. The trend remained intact until the stock eventually closed below its 21-EMA, marking the end of the move.
Netflix then repeated the pattern in January 2025, beating earnings again and gapping higher on strong subscriber growth and revenue. Since then, the stock has drifted more than 10% higher and remains above its 21-EMA.
Netflix (NFLX Daily Candle Chart
Past performance is not a reliable indicator of future results
Disclaimer: This is for information and learning purposes only. The information provided does not constitute investment advice nor take into account the individual financial circumstances or objectives of any investor. Any information that may be provided relating to past performance is not a reliable indicator of future results or performance. Social media channels are not relevant for UK residents.
Spread bets and CFDs are complex instruments and come with a high risk of losing money rapidly due to leverage. 83% of retail investor accounts lose money when trading spread bets and CFDs with this provider. You should consider whether you understand how spread bets and CFDs work and whether you can afford to take the high risk of losing your money.

Short Re-entry Netflix (NFLX)Re-entry after previus stop
1)seasonality and presidential cycles (post election cycle )
2)overvalued conditions
4)bearish engulfing candle

Netflix 2-17 (scalping + forecast) 🔥 Market Overview (Netflix - NFLX)
Trend: Strong bullish trend with continued higher highs and higher lows.
Key Levels:
Support: $1036 (Supertrend support)
Resistance: $1064+ (Recent high)
Indicators:
EMA 9: $1045 – Price is above short-term EMA, confirming bullish momentum.
EMA 200: $931 – Long-term bullish structure remains intact.
Supertrend: Still indicating a buy signal.
MACD: Bullish momentum remains strong with a wide gap between MACD and signal line.
RSI: 76.19 – Overbought zone, indicating a potential short-term pullback.
🔥 Scalping Strategy
🩸 Momentum Scalping (Preferred Strategy)
Buy near: $1045, targeting $1064+.
Sell near: $1064-$1070, targeting a quick retrace to $1045.
Stop-loss: Below $1035 (break of Supertrend support).
🩸 Breakout Scalping (If $1064 Resistance Breaks)
Buy above: $1064, targeting $1080.
Stop-loss: Below $1055 to limit downside risk.
🩸 Range Scalping (If Pullback Occurs)
Buy around: $1036-$1040, targeting $1055.
Sell near: $1055-$1060, targeting a drop back to $1040.
🔥 Mid-Term Trend Forecast (1-3 Weeks)
Bullish continuation likely as long as price stays above $1036.
RSI overbought condition suggests possible short-term retracement before further upside.
If $1064+ holds, next targets: $1080-$1100.
If rejected from resistance, expect a dip to $1036-$1040 for re-entry.
🔥 News & Market Context
No visible major negative catalysts; strong technical momentum.
General market sentiment remains bullish for tech stocks.
Options data and volume spikes suggest institutional buying.
🔥 Decision:
🩸 Short-term: Scalp buy at $1045 with a target of $1064-$1070.
🩸 Mid-term: Hold long positions above $1036, targeting $1080-$1100.
🩸 Ideal Play: Buy the dip to $1036-$1040, take profit near $1065+.
👑 Final Verdict:
Netflix remains in strong bullish momentum, but short-term pullbacks are expected due to RSI overbought levels. Look for dip buys and breakout confirmation above $1064 before expecting further rally to $1080+.
🔥 LucanInvestor's Quote:
"A strong trend rewards patience. The weak exit early—winners ride momentum." 👑
NFLX longer term monthtly (Log) chart Interesting level being tested here by NFLX. If breaks above it, the longer term target is $2,500+
Summary:
Shorter term: Over-extended, pullback likely.
Longer term: The moon? NASDAQ:NFLX

Scalping & Mid-Term Analysis for Netflix Market Overview:
Trend: Netflix is in a strong uptrend, making new highs with bullish momentum.
Key Levels:
Resistance: ~$1,075 - $1,100
Support: ~$1,045 - $1,050 (weak), ~$1,020 - $1,000 (stronger)
Indicators:
MACD: Bullish momentum remains strong but shows early signs of slowing.
EMA: Price is well above 9 EMA & 200 EMA, confirming bullish dominance.
RSI: Overbought (76+), signaling possible consolidation or a short-term pullback.
🔥 Scalping Strategy:
🩸 1. Range Scalping (Short-Term Play)
Why? NFLX is at new highs, making a pullback before continuation likely.
How?
Buy near $1,045 - $1,050, targeting $1,070 - $1,075.
Sell near $1,075 - $1,100, as profit-taking might trigger a pullback.
Stop-loss below $1,040, to protect against deeper corrections.
🩸 2. Breakout Scalping (If Volatility Kicks In)
Trigger: A breakout above $1,100 or breakdown below $1,045.
Execution:
If NFLX breaks $1,100, scalp long targeting $1,125 - $1,130.
If NFLX drops below $1,045, scalp short to $1,020 - $1,000.
🩸 3. EMA Scalping
Why? NFLX is holding well above 9 EMA, making dips to EMA good long entries.
Execution:
Buy pullbacks to 9 EMA ($1,050 - $1,055) if price shows strength.
Short rejection of $1,075 resistance with confirmation.
🔥 Mid-Term Trend Forecast (1-3 Weeks)
Bias: Bullish → Cautious
Why?
Strong uptrend intact, but RSI is overbought—pullback likely.
If NFLX consolidates above $1,045, expect a push to $1,100+.
Failure to hold $1,045 could trigger a retrace toward $1,020 - $1,000.
Bulls need a clean breakout above $1,100 for further upside.
🔥 News & Market Context:
Tech stocks leading, NFLX benefiting from sector momentum.
No major bearish news, but overbought levels suggest a cooldown soon.
Volume remains strong, meaning dips could be bought quickly.
🔥 Decision: Enter or Stay Out?
🩸 Short-term: Scalping long on dips is valid, but avoid chasing new highs.
🩸 Mid-term: Bullish unless NFLX loses $1,045 support.
🩸 Ideal Play: Buy dips at $1,045, scalp resistance at $1,075, and watch for a breakout.
👑 Final Verdict:
NFLX remains strong, but overbought. Holding $1,045 → $1,100 next. Losing $1,045 → $1,020. 🔥

NFLX: Sell ideaThis configuration of the chart on NFLX alerts us to a probable bearish trend. Therefore, we must be vigilant. This decline will be confirmed by the breakage of the vwap and the support line by the sellers.

NFLX Heating Up! Is This the Next Big Move?🔥Technical Analysis (TA)
* Trend: NFLX has been in a strong uptrend, breaking past resistance zones and forming higher highs.
* Price Action: The price is currently testing an ascending trendline, moving within an expanding wedge, signaling increasing volatility.
* Support Levels:
* 1st Support: $1,033
* 2nd Support: $998
* Resistance Levels:
* 1st Resistance: $1,045
* 2nd Resistance: $1,050
* Indicators:
* MACD: Bullish crossover, showing momentum, but needs confirmation.
* Stochastic RSI: Overbought zone (~72), indicating possible consolidation or retracement.
GEX Options & Market Sentiment
* Gamma Exposure (GEX): High positive call resistance at $1,045 and $1,050, suggesting these could act as key levels where price action may slow.
* Put Support: Heavy options positioning at $997.5, indicating a strong support zone.
* Options Flow:
* Calls Dominant at 23.3%, suggesting bullish sentiment but not extreme.
* IV Rank: 12.1, meaning options are relatively cheap for long strategies.
🔥 Trade Setups to Watch
📈 Bullish Scenario:
* Breakout above $1,045 → Target $1,050+
* Entry: $1,040+
* Stop-loss: $1,030
📉 Bearish Scenario:
* Rejection at $1,045 → Drop to $1,000 support
* Entry: Below $1,030
* Stop-loss: $1,050
Final Thoughts
NFLX is showing strong bullish momentum, but it is near a key resistance area. If it breaks out, we could see a test of $1,050-$1,060. However, a rejection might send it back to $1,000 levels before another attempt higher.
📊 Key Takeaway: If bulls maintain control above $1,040, watch for a continuation toward $1,050+. But if rejection occurs, expect a pullback toward $1,000.
🔔 Follow for More Daily Hot Stock Alerts! 🚀
📢 This analysis is for educational purposes only. Trade wisely!

Triangle Alert: Netflix Ready To Explode ?📢 Greetings, Fellow Traders!
Wishing you all profitable trades, sharp insights, and unwavering discipline in your trading journey! May your setups be strong, your risk management be solid, and your patience be rewarded.
Markets may be unpredictable, but with the right strategy, mindset, and perseverance, success is always within reach. Stay focused, keep learning, and support each other—because in trading, knowledge and community make all the difference!
Happy Trading & Green Days Ahead! 🚀📈
Netflix (NFLX) | Symmetrical Triangle Breakout Setup | 4H Timeframe-:
Netflix (NFLX) has been consolidating within a symmetrical triangle pattern on the 4-hour chart, signaling an impending breakout. This formation suggests that the stock is in a phase of indecision, where buyers and sellers are battling for control. A breakout in either direction could lead to a strong move, making this an important setup to watch.
📌 Key Levels to Watch:
🔼 Bullish Scenario:
If NFLX breaks above the upper trendline of the symmetrical triangle with strong volume and confirmation, it could trigger a bullish rally. In this case, my first target would be the rising resistance line, which has historically acted as a key barrier for price movement. A successful breakout could indicate continued upward momentum, potentially leading to higher levels.
🔽 Bearish Scenario:
On the downside, if the price fails to hold the horizontal support level and breaks below the lower trendline of the triangle, it could lead to further downside pressure. In this case, I would anticipate a move toward the previously identified target zone, where buyers might step in to provide support.
📊 Trading Plan:
Breakout Confirmation: I will wait for a strong close above or below the triangle or horizontal support zone with increasing volume to confirm the breakout direction before entering a trade.
Risk Management: Stop-loss placement will be crucial to manage risk effectively. For a long position, I would place a stop-loss just below the breakout point, and for a short position, I would place it above the breakdown level.
Price Action Monitoring: I will closely watch how the price reacts around the breakout level and key resistance/support zones. A retest of the breakout level with strong buying/selling pressure could provide additional confirmation.
This setup presents a high-probability trade opportunity, but patience is key. Will Netflix break out to the upside and continue its bullish trend, or will it break down and test lower levels?
Let me know your thoughts in the comments!
Best regards-: Amit

NFLX Swing Trade IdeaI am looking at this Short trade idea given that indices remain bearish. I like how NFLX is setup on the H4 and Weekly TF. Anticipating price to gravitate lower towards weekly fvg giving that short trade idea. Obvious factors that can influence the trade idea is the high impact news and sentiment of the indices.

Short Idea Netflix (NFLX)Based on
1)presidential cycles (post election cycle )
2)overvalued conditions
3)quantitative data that shows 80% win rate for shorts on post election cycle years
4)bearish reversal candle
