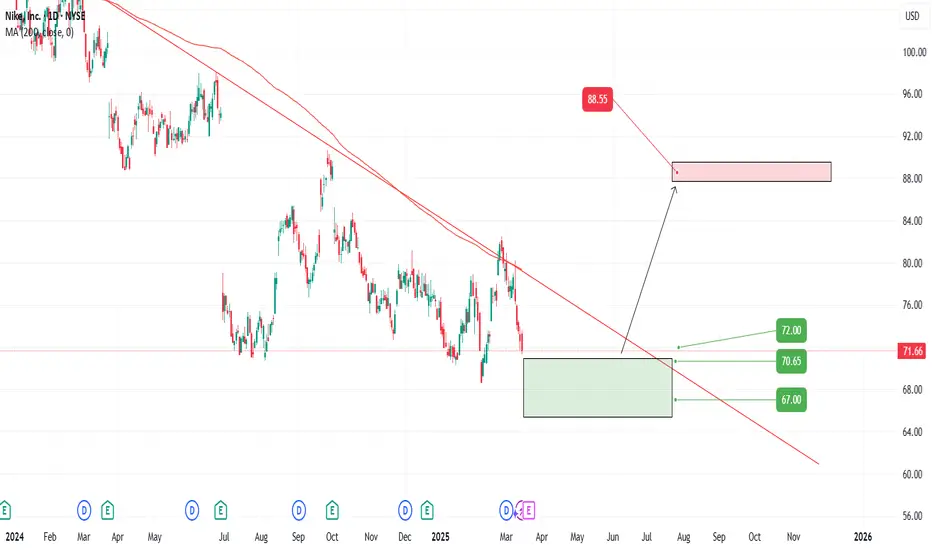
NKE Trade Alert – Massive Upside Potential! 🔥 NKE Trade Alert – Massive Upside Potential! 🔥
🚀 Nike (NKE) is setting up for a major breakout! Smart money is eyeing these key entry zones to ride the next big move.
📌 Entry Levels:
💰 72.00
💰 70.65
💰 67.00 (STRONG buy zone)
🎯 Profit Targets:
✅ 78.80 📈 (Solid first target)
✅ 82.50 🚀 (Momentum play)
✅ 88.50 💰 (Moonshot!)
📊 Risk-to-reward is 🔥 on this setup! Tight stops, high probability. Don’t miss out on this opportunity!
👀 Ready to trade like a pro? Let’s go! 🚀💸 #NKE #StockMarket #TradingSetup
NKE trade ideas
NKE: Bullish Setup with Falling Wedge & 1/16 Risk/RewardNYSE:NKE remains in a strong historical bullish trend 📈 and has now reached a key support level, presenting a potential buying opportunity 🚀. A potential local double bottom is forming, and the price action is also developing a falling wedge pattern—both strong bullish reversal signals. Additionally, volume has been increasing over the past months, indicating growing accumulation and renewed buying interest. With a favorable 1/16 risk/reward ratio, this setup offers an attractive opportunity for a move back toward the all-time high 🎯.

NKE LONG IDEAHello
Nike is my next buy
In my opinion, selling power is decreasing. Bullish divergence has been formed at a support level, that previously acted as resistance.
I calculated the intrinsic value of nike to be around 110 usd, which gives us a 30% discount at the moment
NIKE - LONG Down 56% - apparel and sporting giant.
Long term employee at the helm.
Turn around play?
Bill Ackman holding 11% of his portfolio
Thomas Gayner long term holder.
Historically on the low ends of P/E.
>20% ROIC over a decade.

NKE LongTrendline break
Support/resistance line + Confirmed
Entry 77
Stop 74
Target 85, 97
Risk management is much more important than a good entry point.
I am not a PRO trader.
In my trading plan, the Max Risk of each short term trade should be less than 1% of an account.

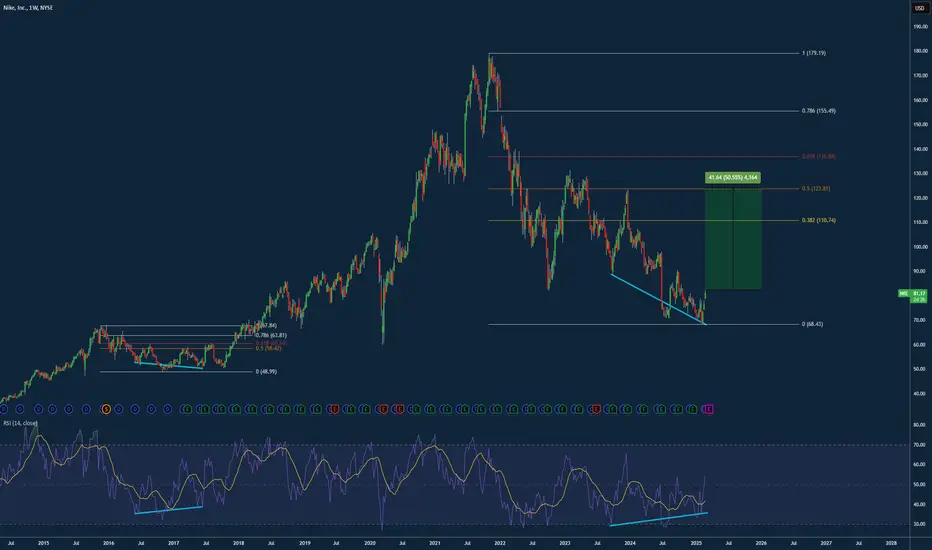
Nike RSI Divergence on Market Cycle completion The broad market cycle is clear, what's unknown is confirmation of trend reversal. This could be a fakeout into stagnation. This price level has historical support, but so does $65-$70.
RSI Divergence and fib retracement point towards a $120-$125 EOY 2025 target for bulls, with a possible opportunity for lowering cost basis in the event of a dip back to last weeks $70 range.
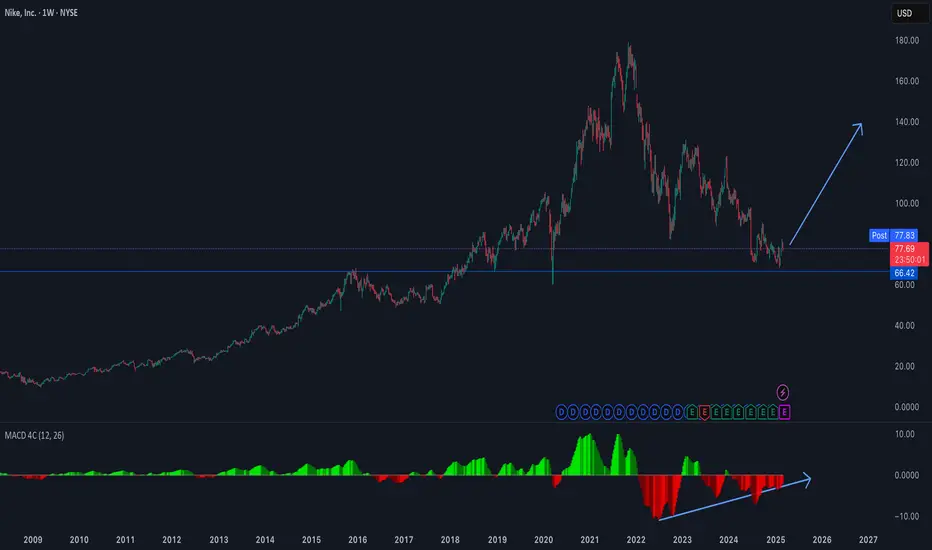
IS NIKE STARTING IT'S MULTI YEAR BULL RUN? (February 25, 2025)Lots of good news are showing up in the charts for Nike stock. in this video I explain all of it!

breaking three year down trendNike has finally broken the three year down trend, and has lifted above 10,20,50 and 100 MA. with some long term SR at $84.50, lets see if it breaks that. But IMO long for now with a stop loss at $75.4

Nike (NKE) Shares Surge 5%Nike (NKE) Shares Surge 5%
The sportswear giant was among the top performers in the US stock market yesterday after Jefferies analysts raised their outlook:
→ Upgraded NKE stock from “Hold” to “Buy”
→ Increased the price target from $75 to $115
Amid fierce competition, NKE shares had been in a downtrend throughout 2023-2024, but a leadership change (which we covered in September 2024) may have acted as a catalyst for a turnaround.
Technical Analysis of Nike (NKE) Stock
Jefferies’ upgrade triggered a bullish breakout of the downtrend line (marked in red).
The $71 level has proven to be a key support, particularly in February, when NKE hit its yearly low. Bears attempted to resume the downtrend, but failed—since then, the stock has surged approximately 17%, forming a sharp reversal (marked by an arrow), which is a bullish signal.
In Wyckoff Method terminology, this move could indicate a Terminal Shakeout, marking a transition from the Accumulation phase to the Mark-Up phase.
Nike (NKE) Stock Forecast
Jefferies analysts hold the most optimistic outlook among their peers. According to TipRanks:
→ 15 out of 28 analysts recommend buying NKE shares
→ The average 12-month price target for NKE is $86
Trade on TradingView with FXOpen. Consider opening an account and access over 700 markets with tight spreads from 0.0 pips and low commissions from $1.50 per lot.
This article represents the opinion of the Companies operating under the FXOpen brand only. It is not to be construed as an offer, solicitation, or recommendation with respect to products and services provided by the Companies operating under the FXOpen brand, nor is it to be considered financial advice.

NKE, Long, 1D✅ NKE has clearly broken the key resistance with strong volume and a positive delta, confirming bullish momentum. The price is now heading toward the next key resistance at 84.00
LONG 🚀
✅ Like and subscribe to never miss a new analysis! ✅

NKE ITS TIME TO GO LONG!Jefferies Upgrades Nike, Predicts Strong Growth & Big Earnings Recovery by 2027
finance.yahoo.com

Nike Falling Wedge Expected Upside soonNike has been putting in a pretty nice looking falling wedge. Keeping an eye on 2 Scenarios another breakout failure where price is pushed back to 68 dollars or a breakout.
Either way i feel this resolves to the upside fairly shortly.
Looking to enter this between 60 and 68 dollars if price rejects diagonal resistance.
Or if a breakout occurs to add to a back-test of current resistance line.
Fib targets indicated.

Nike (NKE) at a Pivotal Point: Reversal or Further Decline?The weekly chart of Nike (NKE) displays a prolonged downtrend, with price action respecting a descending trendline. A harmonic Bat pattern has formed, with key Fibonacci retracement levels indicating potential reversal zones. The price has recently tested the AB=CD completion zone around $77.17 and $69.90, aligning with historical support.
Technical indicators suggest oversold conditions, as both momentum oscillators (stochastic and RSI) show signs of bullish divergence. A breakout above the trendline and sustained buying pressure could trigger a move towards T1 ($107.99) and T2 ($132.31). However, failure to hold support may lead to further downside continuation.

NIKE is BullishAfter retesting a year long descending trendline once again, the bulls now seem to be in the driving seat as they have managed to break it with good volume. If the previous lower high is broken successfully, then we can expect a bullish rally s per Dow theory. Targets are mentioned on the chart.

$NKE! I am on the KIM pump to $125 (YES we can) Confessions from the Desk: Can Kim K Save Nike, or Did Nike Just Buy SKIMS?
Fresh off two weeks of solid busts (both in the market and in my morale), I’ve decided to pivot—because clearly, my current trading strategy has all the accuracy of a broken Magic 8-Ball. This week, I’ve dipped my toes into consumer goods and sportswear, because if there’s one thing Americans will never stop buying, it’s overpriced gym clothes they never actually work out in.
And right on cue, Nike is making headlines. Did Nike just buy SKIMS, or did they just recruit Kim K to save their soul? Hard to say. Either way, the company is betting big on a Made in USA push—because nothing screams patriotism like a $120 athleisure set stitched together with the finest American thread.
This marks the first global advertising campaign under the new CEO, and let’s be real—the stakes are high.
The real question is: Is Kim Kardashian the savior Nike needs?

$NKE is SUPER BULLISH Nike, Inc. (NKE) has recently seen a bullish sentiment among some investors and analysts, driven by several key factors:
Investor Confidence: Billionaire investor Bill Ackman’s Pershing Square Capital Management increased its stake in Nike by 15% during the fourth quarter, reflecting confidence in the company’s long-term growth prospects despite recent challenges.
Analyst Ratings: The stock has received a consensus “Moderate Buy” rating from analysts, with an average price target of $89.96, suggesting potential for price appreciation.
Strategic Initiatives: Under the leadership of new CEO Elliott Hill, Nike is focusing on premium sports products and direct-to-consumer sales, aiming to revitalize its brand and improve financial performance.
However, it’s important to note that some analysts have expressed caution due to challenges in Nike’s turnaround efforts, including competition and the need for product innovation. I do advise you to checkout their competition.
As of February 18, 2025, Nike’s stock price is $74.75, reflecting a slight increase of 0.02341% from the previous close.
Looking at The Fibonacci levels we have strong momentum to continue to price points of $78.85 with hopes of NIKESKIMS release success takes us to 1.618 of $85.20 or the 2.618 of $95.47
As always trade responsibly!!!!!

$NKE - Well it is what it isNYSE:NKE I loaded quite a bit when it fell below $70 and on reclamation of $70. I am in it for the long haul. Targets remain unchanged.
This may be like loading NASDAQ:META at $88 when every analyst and their mom was negative.
As always, I share my opinions and trades. I'm not suggesting anyone follow my trades. You do you.

NKE - Coming into long term support areasStill big swing here for swing trades, but I feel it needs to keep coming down to $60, possibly $50's.
I will DCA into shares slowly, and wait to add some LEAPS.
This isn't for the fast money crowd unless you are swing trading the $10 ranges which can be real good.
BUT, we broke current support of $70, we may see the fast track to $60.
on RADAR

NKE Short on DailyNKE looks like its setting up for another push lower off of these fib levels. Nice R/R

NIKE is BullishPrice was in a strong downtrend, however the descending trendline is broken successfully which indicates that bulls are assuming control of the price action. Moreover, there is also divergence on weekly and daily time frames which further indicates that the price has bottomed out. Price has also given a breakout above alligator. Targets are mentioned on the chart.

BUY NIKE *I am in no way a financial advisor and you should always do your own due diligence before placing any trade. Do not trade what you are not comfortable with losing. No trade is guaranteed.

Long Nike on a defined risk levelDouble bottom forming on possible bottom. Fundamentals are changing with new CEO.
Huge down trend for over a few years, so it's a low win rate set up for a long but there's a defined level to try.
Minimum risk here. Will add on bullish consolidation

Nike on a ride up the block before earnings!!!NYSE:NKE , recently hit a double bottom and has currently bounced 10%, right past the resistance of 76.74. As you can see, it came back to test that resistance and closed slightly above it...The last time it crossed 76.74, it consolidated for about a month before dropping again and bouncing off of not only the support of 70.32 but as you can, NYSE:NKE , also reversed at the Uptrend Support. This can now be viewed as support with a confirmation of it closing above 81.18. The next 2 resistant levels would now be 85.05 and 90.16. Furthermore, the last time it reversed off 70.32 it ran up for a 27% bounce.
The long play that I'm currently interested in is:
82.5 Call and 85 Call expiring 3/21 *side note-that's one day after their earnings release
Again, as I've said before... I am not a financial guru and definitely not a financial advisor (yet) but I will share with you my claims regarding what price action I see. I'd suggest you complete your own Due Diligence and not jump into mine or anyone else's picks without diving into some analysis yourself. Last and definitely the most important part... Take Profits, Take Profits, Take Profits!!! I cannot stress that enough. Good luck on your trading journey!
