Nvidia - The bullish consolidation flag!Nvidia - NASDAQ:NVDA - is still quite bullish:
(click chart above to see the in depth analysis👆🏻)
After Nvidia retested a major horizontal support just last month, we witnessed an extremely strong bullish reversal candle which resulted in a strong +50% rally. Considering the bullish flag consolidation, a breakout is much more likely, but not in the immediate future.
Levels to watch: $150
Keep your long term vision!
Philip (BasicTrading)
NVDA trade ideas

Nvidia Maintains Bearish Bias After EarningsNvidia released its quarterly earnings yesterday, and since then, market confidence triggered a significant bullish gap that pushed the stock price up by nearly 5%. However, in recent hours, a new bearish bias has started to emerge, steadily closing the gap as the market digests the company’s latest report.
Nvidia reported $44 billion in revenue, slightly above the $43 billion expected, while earnings per share (EPS) came in at $0.77, below the $0.87 forecast. Nevertheless, the most notable aspect of the report was the announcement of an estimated $8 billion revenue loss due to U.S. export restrictions. In response, CEO Jensen Huang strongly criticized these measures, warning that they could negatively impact the company’s performance in the coming months.
Uptrend Channel Remains Intact
Since early April, Nvidia has maintained a steady upward channel. Although a slight bearish bias has emerged recently, it is not yet strong enough to pose a threat to the broader bullish trend seen in recent months. Therefore, this technical structure remains the most important pattern for the upcoming sessions.
Technical Indicators:
RSI: The Relative Strength Index has begun to show signs of a possible bearish divergence, as lower highs on the RSI contrast with higher highs in the stock price. This mismatch could signal short-term corrective movements.
MACD: The MACD, meanwhile, continues to oscillate around the zero line, indicating a balance between buying and selling pressure. As long as the histogram remains near this level, it suggests neutral momentum in price direction.
Key Levels to Watch:
$140 USD: Current resistance level where short-term selling pressure may emerge.
$150 USD: Distant resistance around January highs. A breakout toward this level could support a stronger bullish channel.
$125 USD: Important support that coincides with the 200-period moving average. A bearish move toward this level could break the current bullish formation.
Written by Julian Pineda, CFA – Market Analyst

Nvidia after earningsSo , now the earnings were overall good, I actually do not care so much about earnings but more about expectations which were very good. Were still in a weak market sentiment, and in a summer hole with low liquidity, but I need to admit Nvidia is the star of the market for now.

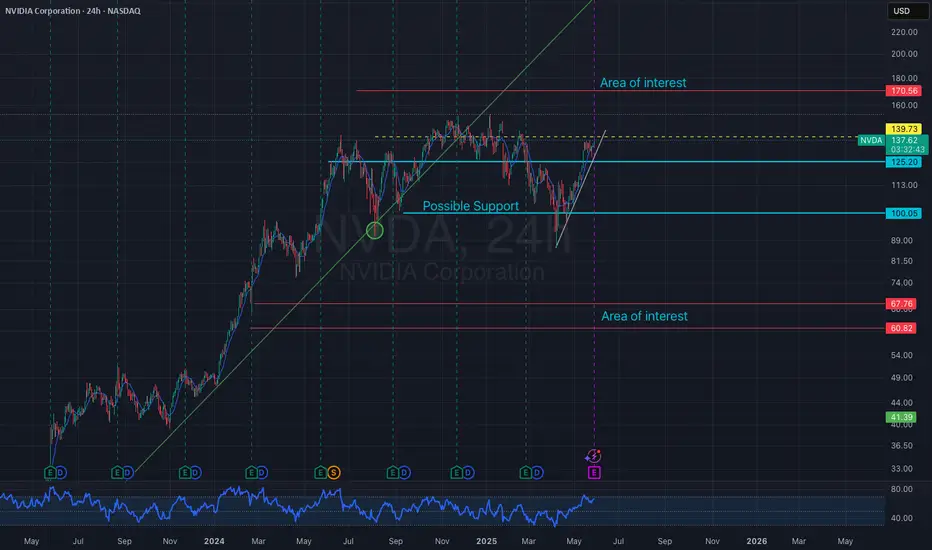
NVDA roadmap of Support / Resistance levels going into Earnings
NVDA earnings soon that the entire world will be watching.
Plotted are key levels mapped by its Genesis and Covid fibs.
Look for the move to stop and rebound at one of these zones.
$ 140.35-141.09 is the first resistance above.
$ 148.64-150.04 is the All Time High resistance.
$ 122.25 is a Golden Covid fib for bulls to hold.
$ 111.63-113.56 is pretty much Bulls' Last Stand
See "Related Publications" links to the right ----------->>>>
for previous plots that played out EXACTLY.
.

Nvidia Stock Price Rises Over 4% Following Earnings ReportNvidia (NVDA) Stock Price Rises Over 4% Following Earnings Report
Yesterday, after the main trading session, Nvidia released its quarterly earnings report, which exceeded analysts' expectations:
→ Earnings per share: actual = $0.81, forecast = $0.73
→ Revenue: actual = $44 billion, forecast = $43.3 billion
Additionally, according to media reports, Nvidia issued a strong forecast for the next period, although CEO Jensen Huang noted difficulties in accessing the Chinese market, which he estimates to be worth $50 billion.
Nevertheless, market participants reacted positively. According to Google, in after-hours trading the NVDA stock price rose by more than 4%, surpassing the $140 level.
It is reasonable to assume that this initial positive reaction could continue during today’s main trading session.
Technical Analysis of NVDA Chart
As we mentioned earlier this week, NVDA stock in 2025 has formed a broad descending channel (shown in red), and just before the earnings release, the price was consolidating near the upper boundary of this channel.
We also suggested a scenario in which the bulls might attempt to break through the upper boundary of the channel. Given the positive earnings report and the stock market rally following the Federal Court’s decision declaring Trump tariffs invalid, the likelihood of this scenario increases.
This, in turn, means that:
→ the upper boundary of the channel, once broken, may act as support;
→ we may once again see the key psychological resistance level of $150 come into play — a level we have highlighted multiple times before.
This article represents the opinion of the Companies operating under the FXOpen brand only. It is not to be construed as an offer, solicitation, or recommendation with respect to products and services provided by the Companies operating under the FXOpen brand, nor is it to be considered financial advice.

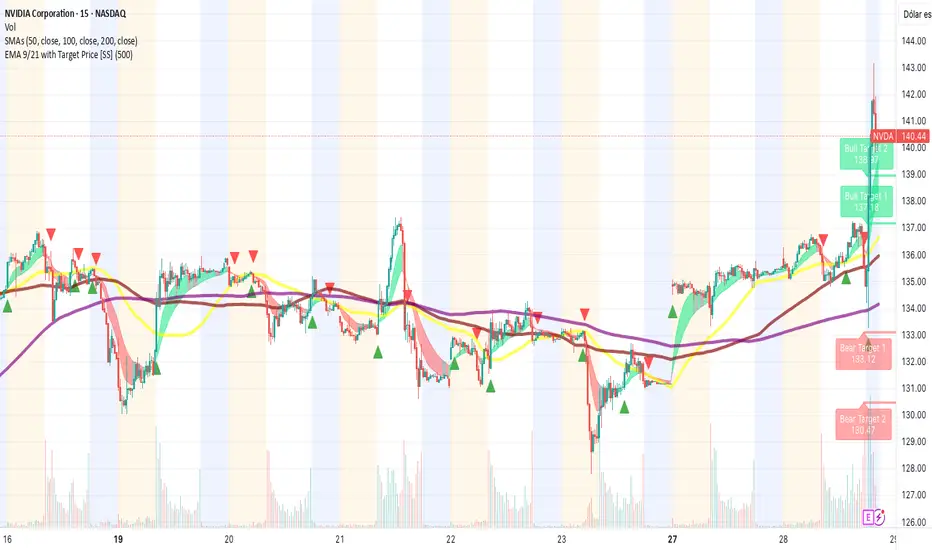
SHORT Nvidia, Bearish Chart Setup, Resistance ConfirmedThe resistance from 21-May has been confirmed 28-May.
The same level has been working as resistance since 14-May.
After two weeks, this resistance level continues to hold and it is now confirmed.
In November 2024 NVDA produced a high.
Later in January 2025 NVDA produced an all-time high.
18-February 2025 NVDA went to produced a lower high; a rejection that led to a major drop.
The major drop resulted in a recovery and the recovery found resistance earlier this month. This resistance, the same from 14-May, 21 and 28-May, is also a lower high compared to the previous levels just mentioned.
The signal here is double: (1) Resistance confirmed and (2) a lower high.
There is one more. 28-May produced a volume breakout day. The day ended up closing red. So, Nvidia is confirmed bearish now.
Thank you for reading.
Namaste.

NVDA GEX Earnings Outlook by OptionsNVDA reports earnings this Wednesday, and it’s a big deal. A major move could impact both the indexes and broader tech sector.
The OTM 16 delta curve essentially overlaps with both the GEX profile and the expected probability zone — signaling strong confluence.
📈 Rising IV with falling call skew: Volatility is rising into earnings, while the call skew is dropping — a sign of growing interest in downside hedging/speculation.
🔷 Key inflection zone (129): Above 129, the market is unlikely to surprise. Below it, however, a domino effect could trigger increased volatility and put-side flows.
Implied move into earnings is 6.62%, reflecting binary risk expectations from the options market.
Strong gamma squeeze territory exists between 140–145, with significant call wall buildup around 140.
The nearest expiry shows a positive net GEX — supporting short-term mean-reversion or hedging flow stability above 129, at least until the earnings print.
🔴 Downside risk scenario:
In the event of a downward move, the market is most heavily hedged around the 125 level, which aligns with the deepest put support.
💡 Wheeling Opportunity Idea
ONLY IF you want to own NVDA long-term around the $130 level (even if it drops short/mid-term), this might be a great time to start the wheeling strategy.
Because earnings inflate volatility, you can sell a near-term cash-secured put (CSP) for solid premium — even on a 53DTE (July) option.
Based on current GEX levels, we’re seeing:
-Support (squeeze zone) around $125
-Call resistance around $140
-A potential upside squeeze extending to $145-$150
These align roughly with ~20 delta OTM options, so the premium is attractive.
How would I personally start this:
Sell a CSP for May 30 with the intention to get assigned if NVDA drops.
If I do get assigned, I’m happy to own shares.
Then, I sell a 60DTE covered call right after to collect another round of premium.
If I’m not assigned, I sell a new 45–60DTE put the following week — still benefiting from the relatively high IV.
👉 Remember: High IV = synthetic time value. With this two-step method, you can harvest premium twice in quick succession.
I used the same technique with NASDAQ:INTC , and it’s been performing well.
💥 ONLY IF you want to own NVDA long-term around the $130 level (even if it drops short/mid-term)!

NVIDIA/USD 4 HR./ CORRECTIVE WAVE B NORTH IS LIKELY OVER!1). Price is very likely heading towards the fair Market value @ 123! 2). Risk Assets are Weak today on US$ strength! 3). BANKS ARE SELLING! 4). Volume is dropping. 5). Trendline is intersecting with target fib. level 100% TOWARDS 123! 6). Corrective wave C is likely dropping to complete wave 4. 7). At the bottom of wave 4 we will look for a long (Buy) position!

NVDA Q1 Earnings: Strong Fundamentals Amid Geopolitical NoiseDespite recent trade restrictions, Nvidia has shown remarkable operational strength, beating expectations with $44.1 billion in revenue and a 73% YoY growth in its data center segment, fueled by rising demand for artificial intelligence. While international tensions led to a projected $8 billion loss, the market responded with confidence—viewing it as a temporary adjustment rather than a structural threat. This strong financial position supports our CALL contract entry, which is already gaining value. If tomorrow’s GDP data confirms economic stability, we could see another bullish move, and if our technical target is reached, we’ll exit as planned.
All eyes on NVDABullish or Bearish? Where do you think we are going? Let's see how hard this move will be and how much it will affect the rest of the market. Be careful and GL! Lets see if we can hit some targets
$NVDA - head and shoulders + possible bull shark harmonicOn my chart, NVDA appears to be potentially forming a head and shoulders pattern.
At the same time, an almost perfect bullish shark harmonic woukd comple around the target for the head and shoulders pattern.
Could be something, could be nothing.
But I'll be careful and not spend my money on NVDA just yet.
Positive earnings might invalidate this idea and send NASDAQ:NVDA to the moon instead.
Let's see what happens.

NVDA ER targets!!
144-148 for bullish news, beats expectations
123-126 for meeting expectations, base case
111-114 for missing expectations
TL;DR I favor the short side...I'd open an ITM bearish Broken Wing Butterfly. But it's too much risk for my port so I'm staying out.

SPX Bullish Patterns Emerging ahead of NVIDIA EarningsThe SP:SPX has taken out some major pivots and recaptured the ever so important daily 200 MA.
across multiple time frames some very interesting bullish patterns are emerging.
All eyes will be in NASDAQ:NVDA earnings tonight after the bell.
If NVIDIA beats and guides it will breakout of an epic bull flag pattern that will likely casue this market to trend to new All time highs.
Probabilities from a technical pattern standpoint are pointing towards higher price action.
We have already broken out and back tested key support levels and the buying is clearly being observed.
We remain net long with positions already in profit.

NVDA LONGNVDA is a long term buy from here. With earnings later today, we can expect a big push up into our purple zone. I am holding my positions strong!
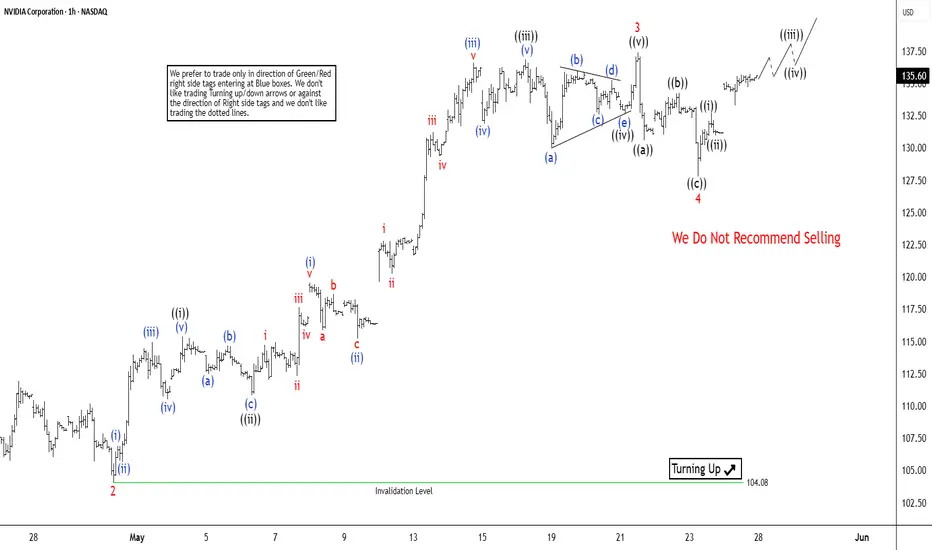
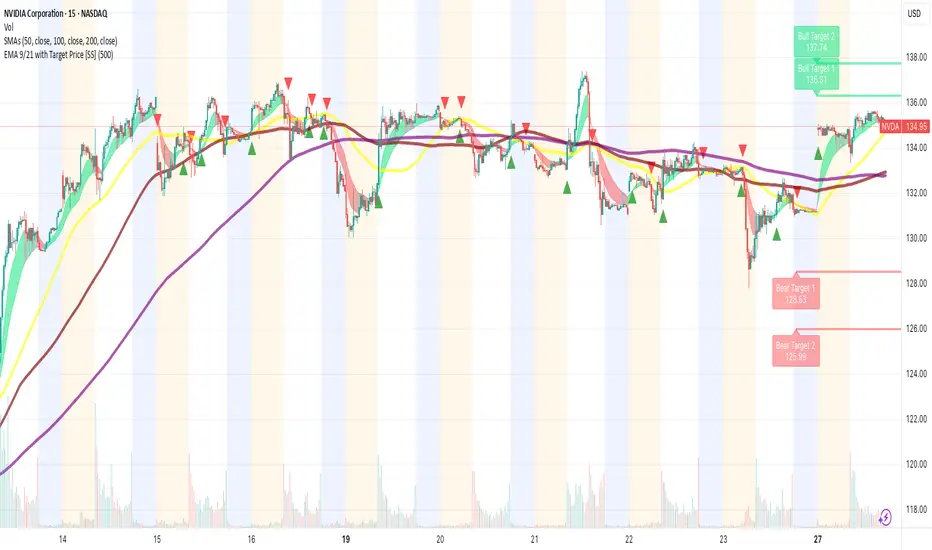
Nvidia (NVDA) Elliott Wave Analysis: Wave 5 Nearing Its EndThe short-term Elliott Wave analysis for NVIDIA (NVDA) indicates a bullish trend unfolding as an impulse structure since the low on April 21, 2025. From that low, the stock completed wave 1 at $111.92. The stock then followed by a corrective pullback in wave 2, which bottomed at $104.08. The subsequent rally in wave 3 displayed strong momentum, characterized by a nested impulse structure in a lesser degree. Within wave 3, the first sub-wave, wave ((i)), peaked at $115.40, with a brief dip in wave ((ii)) to $110.82. The powerful wave ((iii)) surged to $136.89, followed by a shallow pullback in wave ((iv)) to $132.65. The final leg, wave ((v)), concluded at $137.40, completing wave 3 on a higher degree.
The corrective wave 4 unfolded as a zigzag pattern. From the wave 3 peak, wave ((a)) declined to $130.59, wave ((b)) rebounded to $134.23, and wave ((c)) completed the pullback at $127.80, finalizing wave 4. NVIDIA has since resumed its upward trajectory in wave 5. As long as the pivot low at $104.08 holds, the stock is expected to extend higher in wave 5, completing the cycle from the April 21 low. Following this, a larger-degree three-wave pullback is anticipated, offering a potential pause in the bullish trend.
$140 NVDA to the downside?I am seeing a previous ORD Block to be tested at $139/140 after that I might expect some sort of "news" to break and start a selling to fill both Gaps on the downside before it continues.
It might happen or not, but my experience shows me manipulation is quite real. And we got to account for that guy that saw the market collapse before anyone you know that famous housing problem that even made a movie about it? He is shorting NVDA as well. I do not believe in any of them, but I would be careful. Unless NVDA doesn't break strongly above $140 and retest without problems. I would bet going down eventually too.
For now going up.

SunsetToday the stock tried again to get a new top - successfully. But the top has been sold immediately! This week we have seen 3 windows. All of them are still open.
This jumping from window to window shows an overaware market, perhaps artificial(AI!) pumping.
The sale of the recent top is confirming my view.
I am selling.

NVIDIA Pre-Earnings – Why is it rising already?First of all — thank you all for the support on the previous analysis: over 900 views and 36 boosts! 🙏
A common question came up:
"Why is NVDA rising if earnings haven’t been released yet?"
Simple: the market is anticipating.
There’s strong expectation that NVIDIA will once again outperform when it reports on May 28. That alone has brought in early buying pressure — both institutional and retail — and we’re seeing that reflected in the current price action.
🧠 This is what we often call "buy the rumor".
NVDA is also benefiting from:
Renewed strength in the tech sector
High demand for AI infrastructure
Clear leadership in its industry
I entered the position ahead of the move, based on fundamentals and a strict risk management plan. If earnings deliver, the CALL option should accelerate significantly. If not, I already have a defined stop-loss strategy in place.
This is not about guessing — it’s about staying disciplined.
Let’s see how the next 48 hours unfold. 🚀📈
$NVDA – Earnings Super Bubble?🚨 Nvidia is reporting earnings tomorrow, and the market is waiting with bated breath.
While analysts pile on with hyper-bullish predictions extrapolating the AI super bubble, they seem to ignore one glaring fact:
👉 The last time Nvidia beat earnings, the stock crashed -45% shortly after.
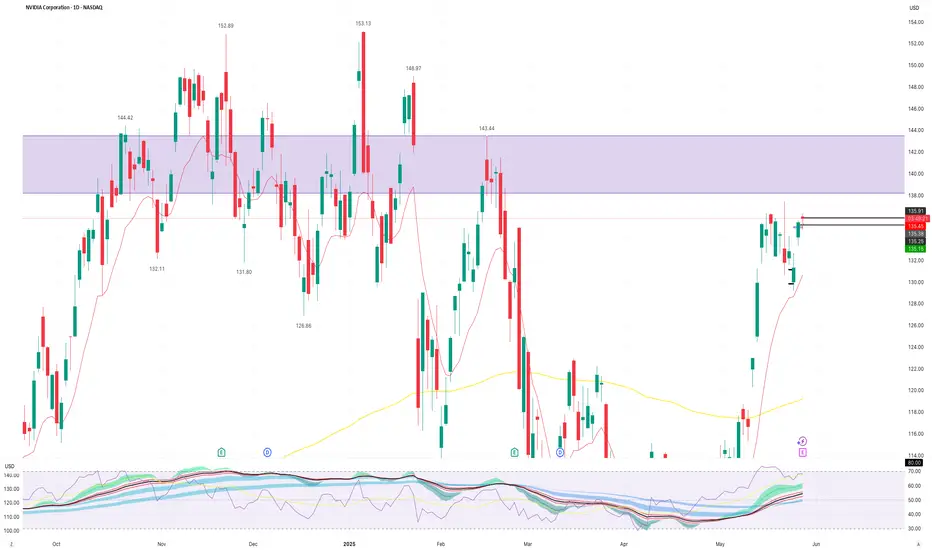
Technical view:
We’re near resistance at the previous post-earnings high.
RSI sits at 63.80, hinting at possible exhaustion.
Volume spikes hint at indecision, not confirmation.
This could be a make or break moment for NASDAQ:NVDA and by extension, the entire Tech sector.

What to Watch in Nvidia Earnings and Key Technical LevelsStock markets around the globe are turning their focus to one key earnings report: Nvidia. AI has been the primary driver of the U.S. stock market over the past few years, and Nvidia’s earnings are widely viewed as the best indicator of growth in the AI sector. The correlation between Nvidia and broader U.S. stock performance as well as its influence on global equities, crypto, and FX is strong enough for the world to fixate on this report.
Nvidia is expected to report $0.88 EPS for the first quarter of FY2026, representing a 43.36% year-over-year increase, but a slight decline quarter-over-quarter. The company previously guided revenue between $42.14 billion and $43.86 billion, with market consensus currently at $43.317 billion, in line with that range.
The key revenue stream, Data Center, is expected to generate $39.357 billion, reflecting 74.44% growth. Some analysts are forecasting as high as $42.051 billion for this segment alone.
At a forward P/E ratio of 27.6x, Nvidia is trading well below its 1-year (32.1x), 2-year (33.7x), and 5-year (40.1x) historical averages. This more favorable valuation, coupled with strong AI tailwinds, could present a solid medium- to long-term buying opportunity if earnings and guidance support the growth narrative.
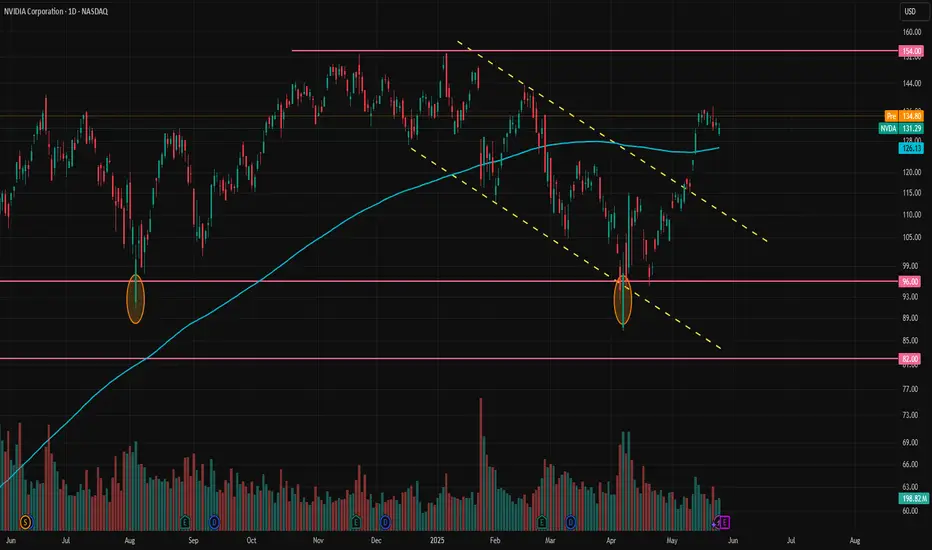
After breaking out of the downtrend, NVDA approached the 140 resistance level but failed to break through. Following the upcoming earnings release, if Nvidia pulls back to either 118 or 110, those levels could present buying opportunities, assuming the report isn’t significantly negative.
It’s worth noting that sometimes real market expectations run much higher than the analyst consensus, which can lead to a selloff even after a strong earnings report.
The 154 level remains the key resistance for now, and in our view, a breakout this week carries a relatively low probability. If the report tomorrow exceeds expectations, 154 could still act as a barrier and trigger some profit-taking by Nvidia bulls.
What’s Happening with Nvidia (NVDA) Ahead of Earnings?What’s Happening with Nvidia (NVDA) Ahead of Earnings?
After an extended weekend due to Veterans Day in the US (observed on Monday), financial markets are returning to active trading. The highlight of the week will be Nvidia’s (NVDA) earnings report, scheduled for Wednesday after the close of the main trading session.
What You Need to Know Ahead of Nvidia’s Earnings
According to media reports, market participants are concerned about:
→ escalating trade tensions between the US and China;
→ increasing competition;
→ Nvidia’s premium pricing at a time when the GPU market is shifting towards more affordable alternatives;
→ downward revisions to earnings per share, which some interpret as a sign that Nvidia’s report may fall short of expectations.
On the other hand, Reuters reports that Nvidia is set to unveil a new processor that:
→ is designed specifically for AI applications;
→ is based on the Blackwell architecture;
→ will not be subject to US export restrictions on chips sent to China;
→ is expected to be cost-effective.
Technical Analysis of Nvidia (NVDA) Stock
Today’s NVDA price chart suggests that the descending channel (marked in red) may be forming a large bullish flag — a continuation pattern that typically indicates a potential resumption of the uptrend after a corrective phase.
Price action in Nvidia stock has slowed near the upper boundary of the channel — a sign of temporary equilibrium between supply and demand (this could also be interpreted as traders adopting a wait-and-see stance ahead of the earnings release).
Given that the earnings report is a potentially strong price catalyst, a breakout from the bullish flag cannot be ruled out. Such a move could signal the start of a new phase in NVDA’s long-term upward trend (as indicated by the arrow on the chart).
This article represents the opinion of the Companies operating under the FXOpen brand only. It is not to be construed as an offer, solicitation, or recommendation with respect to products and services provided by the Companies operating under the FXOpen brand, nor is it to be considered financial advice.

NVDA - 140 Quasimodo?Well NVDA has exceeded the 120 PoC from the last year, and other than the head and shoulders developing it looks rather bullish above that 120. But I would sell 140, or at least not buy.
And if I'm buying I'd probably wait for 112. Think I will wait forever? 😂
Will update after we get some more data.

$NVDA bull flag potentialNASDAQ:NVDA setting up with a bull flag formation on the daily. A strong ER with good guidance can get us to 140-145. A less than stellar guidance can break the bull flag thesis and send it back to the 120-125 range, with some gaps below.
