NVIDIA: More Room in Wave BNvidia’s strong rally over recent weeks lifted the stock above resistance at $153.13. Despite a brief pullback on Tuesday, we still expect beige wave B to extend toward $178.39. Afterward, beige wave C should initiate a substantial correction, likely finding its low above $81.98 to complete blue wave (IV). If Nvidia rallies directly through $178.39, that would support our alternative view that blue wave alt.(IV) has already bottomed (37% probability).
📈 Over 190 precise analyses, clear entry points, and defined Target Zones - that's what we do.
NVDACL trade ideas

$NVDA ONCE IN A LIFETIME RARE Fibonacci HARMONICSNASDAQ:NVDA ONCE IN A LIFETIME RARE Fibonacci HARMONICS
NVDA is the NEW Fibonacci King the completion of the CYPHER was at 88 were I went long!
My Target is now 174 🎯up 200 grand on my account
I will ALERT here on the NEXT PLAY LOW RISK setup (NO CHARGE)
All I ask is DROP A 👍

NVDA Buyers Getting Squeezed? What Gamma & Price Action Say NextGEX-Based Options Insight (Gamma Exposure):
📉 NVDA is currently sitting at $152.54, just above a key PUT wall at $150, with GEX sentiment tilted bearish short-term.
* Highest Call Resistance / Gamma Wall: $160
This is the level with the strongest net positive GEX, acting as a cap where market makers may short against CALLs.
* 2nd Call Wall: $158 – Heavy positioning here, could slow price if it bounces.
* PUT Support: $150 – Strong gamma magnet; price may hover or bounce near this.
* IVR: 8.6 (low) – Options are relatively cheap.
* CALLs Flow: 2.6% bias – Weak call flow, favors downside or range behavior.
💡 Options Trade Suggestion:
Because NVDA is under the gamma wall and just above strong PUT walls, consider buying a debit PUT spread, especially if $152.50 breaks.
* Setup: Buy 155P, Sell 150P expiring this Friday
* Risk: Defined
* Reward: Targets $150 zone (gamma magnet)
* Only valid below $152.50 breakdown
1H Price Action + SMC Trade Plan (Chart 2):
🟣 Structure Breakdown Confirmed – NVDA lost its rising structure and broke BOS + CHoCH zones near $157–158.
📉 Current Bias: Bearish
Multiple break-of-structure (BOS) and change-of-character (CHoCH) events suggest a shift to downtrend.
🟩 Possible Short Entry Zone:
* Price could retest the last order block around $155–156 for a lower high before dropping.
📍 Short Trade Idea:
* Entry: Around $154.80–$155.50 (if price retests)
* Stop: Above $157.99 (previous high)
* Target: $150 (1st TP), $147.50 (2nd TP, PUT wall)
📍 Alternative Scenario (invalidates the short):
If price reclaims $158 with strength, we could get a squeeze toward the $160 gamma wall.
Conclusion & Plan:
Right now, NVDA is in a short-term downtrend, aligning with bearish GEX flow. Option sentiment, volume, and structure all favor selling bounces into $155–157 with $150 as magnet. But don’t short blindly—watch if price retests OB and rejects. Use PUT debit spreads or simple 1 DTE options with tight stops.
Disclaimer: This analysis is for educational purposes only and does not constitute financial advice. Always do your own research and manage your risk before trading.

Nvidia - New all time highs!Nvidia - NASDAQ:NVDA - breaks out now:
(click chart above to see the in depth analysis👆🏻)
Within two and a half months, Nvidia rallied more than +70%. Following this recent bullish strength, a retest of the previous highs was totally expected. But this does not seem to be the end at all. There is a much higher chance that we will see new all time highs soon.
Levels to watch: $150
Keep your long term vision🙏🙏
Philip (BasicTrading)

$NVDA - $270 PT in BULL ChannelThe stock is currently bouncing off of the lower channel line of the rising Bull Channel. Price action has created a Cup and Handle. The projected Price Objective sits at around $270. Remember, the height of the cup is the project target which from current stock price extends to around $270.

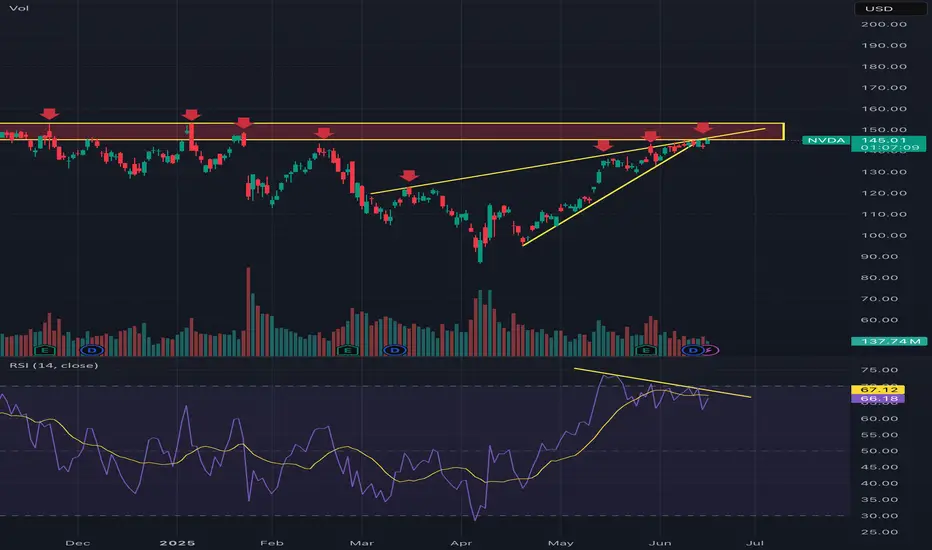
Nvidia into MAJOR resistance This will not be a popular opinion and that’s okay. The charts don’t lie and you can see it is into major resistance, highlighted by all the red arrows when it got rejected. It’s now broken down from a rising wedge which also lines up with said major resistance. I’ve also highlighted bearish RSI divergence, too many factors here for NVDA to keep going up. Could it break through? Of course it could but you have to look at all these factors I’ve highlighted and ask yourself what are the probabilities that it goes down here? High, very high and you want to take trades that put the probabilities in your favor.
Nvidia Breaks Out and Stays OutNvidia has powered to new all-time highs, reclaiming its title as the world’s most valuable
company. The move is being driven by a blend of AI-fuelled optimism and technical resilience.
AI spending is alive and well
After a rocky start to the year, Nvidia’s resurgence has been fuelled by a sharp rebound in
confidence across the AI ecosystem. At the company’s shareholder meeting, CEO Jensen Huang
painted a bullish long-term picture, calling the AI boom a multitrillion-dollar opportunity and
highlighting the rise of sovereign AI infrastructure around the world. That message landed well with
the market, especially after several big tech firms reaffirmed their commitment to AI investment
during earnings season.
Micron added fuel to the rally with a blowout earnings report, topping forecasts and issuing strong
guidance on AI-driven demand. Investors have also warmed to the idea that Nvidia’s grip on the AI
hardware stack remains firm, despite rumblings of competition. Cloud giants like Microsoft and
Amazon may want to build their own chips, but for now, the fastest and most scalable path still runs
through Nvidia.
The price action tells its own story
They say the strongest stocks are the ones that bounce back quickly from bad news. Nvidia fits the
bill. After a nasty correction in Q1, triggered by China export restrictions and the DeepSeek
breakthrough, it would’ve been easy for sentiment to stay sour. Instead, since mid-April, the chart
has told a different story. The January gap has been closed, the stock has gone sideways to digest,
and now we’ve seen a clean breakout to fresh highs.
Volume was healthy on the move higher. Not euphoric, but solid enough to back the price action.
What matters now is follow-through. Traders will want to see Nvidia hold above the breakout zone,
and so far the early signs are promising. Price has now closed above the breakout for three sessions
in a row, increasing the probability that this isn’t a fake-out.
There’s also a clear ascending trendline in play, offering a reference point for future pullbacks
alongside the old horizontal resistance. The RSI is up at 76, but that’s no red flag here. Nvidia has
happily trended with the RSI in the 80s before, and momentum doesn’t tend to fizzle out just
because it’s technically overbought.
NVDA Daily Candle Chart
Past performance is not a reliable indicator of future results
Disclaimer: This is for information and learning purposes only. The information provided does not
constitute investment advice nor take into account the individual financial circumstances or
objectives of any investor. Any information that may be provided relating to past performance is not
a reliable indicator of future results or performance. Social media channels are not relevant for UK
residents.
Spread bets and CFDs are complex instruments and come with a high risk of losing money rapidly
due to leverage. 85.24% of retail investor accounts lose money when trading spread bets and
CFDs with this provider. You should consider whether you understand how spread bets and CFDs
work and whether you can afford to take the high risk of losing your money.

NVIDIA"It’s clear that this stock is currently in a strong upward wave and could advance toward wave 5 of 3, targeting the $1,090–$1,350 range. After reaching this zone, it may enter a corrective phase as wave 4, which could bring a pullback to the $150–$250 range. Following that, the stock is expected to resume its main wave 5 rally, with targets between $5,000 and $7,200."

Nvidia - More Upside After Correction NVIDIA completed an irregular flat correction back in April. Since then, the price action has been strong and steady, forming higher highs and higher swing lows —a clear sign of bullish con-
continuation.
From an Elliott Wave perspective, the current move appears incomplete, as we cannot yet identify a full five five-wave advance from the April lows. This suggests that more upside may still be ahead.
However, we could see a wave four pullback develop sometime during the summer. If that occurs, the key support zone to watch would be around $140 down to $130, which could provide
an opportunity within the ongoing uptrend.
- Resistance: 170
- Support: 143 / 132
- Invalidation: 115
GH

$NVDA Tradespoon – Long Entry $152.62Tradespoon model generated long signal for NASDAQ:NVDA . Predicted range: $152.62–$158.22. Trend: -0.22%. NASDAQ:NVDA

How will NVDA react to the meeting between Canada and USA?Possible Upsides for NVIDIA
Pricing Power & Revenue Buffer
-If Canadian-sourced semiconductors face tariffs, NVIDIA could raise prices across its product line to cover margin impacts—shifting cost to customers.
Accelerated Supply Chain Shifts
-The threat (or reality) of disruptions can drive companies to prioritize U.S. or Taiwan-based supplies, where NVIDIA is deeply integrated, potentially shortening delivery cycles.
Competitive Advantage
-Rivals relying on affected Canadian inputs might see delays or cost increases—NVIDIA could gain market share in both AI datacenter and auto/industrial segments.
Risks & Downsides
Higher Costs for Hardware Buyers
-If tariffs increase the cost of critical components like chips or memory, end-users might delay purchases, potentially reducing NVDA’s sales volume.
Spillover Sentiment Hit on Tech Stocks
-Trade wars often cause broad tech stock sell-offs. As a high-growth leader, NVDA could see increased volatility, even if its business remains strong.
-Disclaimer: This analysis is for informational and educational purposes only and does not constitute financial advice, investment recommendation, or an offer to buy or sell any securities. Stock prices, valuations, and performance metrics are subject to change and may be outdated. Always conduct your own due diligence and consult with a licensed financial advisor before making investment decisions. The information presented may contain inaccuracies and should not be solely relied upon for financial decisions. I am not personally liable for your own losses, this is not financial advise.

The King Roars AgainRS Rating of 95
Breaking out of key pivotal zone
Wall of Buyers displaying institution appetite
RTX 5000 Series debuted at a very friendly consumer price
Looking forward shows no signs of decelerating growth prospects for the Wall Street darling
I have reasons to believe this security price can increase in value

$NVDA: Levitating higher: Next Stop 175$: 250$ Before cycle endsIn this summer bull market, it makes more sense to talk about the large cap winners. NASDAQ:NVDA chart is a beauty to watch with the steady climb of this mega cap stock levitates all the indices including S&P500 and NASDAQ. After hitting 90$ during the Liberation Day drawdown the stock is 60% up since then and recovered all its losses and hitting a new ATH. With stock at 158 $ it is targeting the highs of the upward sloping Fib Retracement channel which indicates that stock can reach a price of 175$ before this run loses its steam. At RSI of 65 this is not overbought compared to its historical level of 84. Hence there might be more room left in this bull run for $NVDA. My prediction is that before end of July 2025 the stock hits 175$.
But where do we like to see this outperforming stock during this cycle of bull run. Will it hit 5T USD before Dec 2024? If NASDAQ:NVDA hits 5T USD, then the stock will be 205 $ which in my opinion not impossible before Dec 2025. 40% Upside in the Market Cap and the stock price is achievable in a momentum stock like $NVDA.
Verdict: NASDAQ:NVDA @ 175 $ before July 2025 & 205 $ or 5 T USD Market Cap before Dec 2025

NVIDIA (NVDA) 4H Setup – Rocket Booster Strategy Building🚀 NVIDIA (NVDA) 4H Setup – Rocket Booster Strategy Building Momentum After Gap-Up and Volume Spike 📈
NVIDIA (NVDA) is showing early signs of another bullish
continuation on the 4-hour chart, echoing a similar pattern seen recently on Microsoft. This setup fits well within the Rocket
Booster Strategy framework — a method focused on catching strong trend acceleration signals backed by confluence.
Here’s what’s happening on NVDA’s chart:
1. High Volume on the 4H Candle
There’s been a strong increase in volume on a bullish 4H candle, indicating significant interest at current levels. This suggests
accumulation or breakout positioning, typically a good sign ahead of momentum bursts.
2. Stochastic RSI Between 50 and 20
While the Stochastic RSI hasn’t bounced from the oversold zone yet, it’s hovering between 50 and 20 — a zone that often acts as a
launching point for continued upward momentum. This shows that buyers are gradually regaining control without being overextended.
3. Price Above the 50 EMA and 200 EMA
NVDA is currently trading well above both the 50 EMA and 200 EMA on the 4-hour chart. This bullish structure confirms a strong
underlying uptrend, and it gives added confidence to long positions.
4. Bullish Gap-Up
A gap-up occurred recently, further confirming buying pressure. Gaps during trending conditions often signal the start of a new
impulsive wave, especially when backed by rising volume and clean trend structure.
Strategy Context
This is a textbook setup for the Rocket Booster Strategy, though the Stochastic RSI is not fully reset. Instead, it’s showing a more
gradual buildup of strength — which can be an early entry signal before larger players pile in.
Entry: On 4H candle continuation or brief intraday retracement
Stop Loss: Below the gap or recent support
Target: Previous swing highs or Fibonacci-based extensions
Final Thoughts
NVIDIA is showing strong signs of bullish continuation, and this could be the early stage of a new momentum phase. The
Stochastic RSI position adds a slightly different flavor to the setup
— more of a buildup than a reversal — but the overall structure remains solid. As always, risk management is key.
Let me know in the comments if you’re watching NVDA too or already in the trade. More setups like this coming soon.
🔥 Rocket Booster Strategy: Engaged for NVDA?
Disclaimer:
This analysis is for educational and informational purposes only. It does not constitute financial advice or a recommendation to buy or sell any security.
Always do your own research and consult a licensed financial advisor before making any trading decisions. Trade at your own risk.

NVIDA still bouncing in the channel but could 158 be....Let's analyze NVIDIA (NVDA) stock with a focus on your specified parallel channel from November 2023 lows to April 2025, and its current position relative to the channel's middle line.
As of Friday, June 27, 2025, at 10:18:37 PM PDT, here's a breakdown of NVDA:
**Current Price & Performance:**
* **Last Price:** $157.75 (as of 4:00 PM ET on June 27, 2025)
* **Today's Change:** Up $2.66 (1.71%)
* **Previous Close:** $155.09
* **Today's Range:** $155.255 - $158.71 (intraday)
* **52-Week Range:** $86.63 - $158.71 (Today's high is the 52-week high, indicating a strong recent upward push and reaching new all-time highs.)
---
### **Parallel Channel Analysis (Nov 2023 Lows to April 2025)**
A parallel channel is formed by two parallel trendlines that encompass the majority of price action.
* **Uptrend Channel:** Both lines slope upwards.
* **Middle Line:** Often drawn equidistant between the two channel lines, serving as a dynamic support/resistance level.
**Constructing the Channel (Conceptual):**
* **Bottom Line:** Drawn from a significant low in November 2023 (NVDA's 52-week low is $86.63, likely from around that timeframe or slightly later in 2024). This line would connect subsequent higher lows.
* **Top Line:** Drawn parallel to the bottom line, touching the significant highs experienced during the uptrend, extending through April 2025.
**NVIDIA's Trajectory in the Channel:**
NVIDIA has been in a **parabolic uptrend** since late 2023, driven by massive demand for its AI chips. This kind of explosive growth is highly conducive to parallel channel formations, where the price continually moves higher within defined boundaries.
* **From Nov 2023 Lows to April 2025:** NVIDIA experienced a massive rally during this period. The price would have largely stayed contained within a relatively wide, upward-sloping parallel channel.
* It would have likely bounced off the bottom trendline (support) and moved towards the top trendline (resistance) multiple times.
* The middle line would have acted as a pivot point, with the price oscillating above and below it.
**Current Position: "Price is now above the middle line."**
* **Interpretation:** The fact that the price ($157.75) is currently *above* the middle line of this parallel channel (which spanned from Nov 2023 to April 2025) is a **bullish sign**.
* When the price is in the upper half of an upward-sloping parallel channel, it indicates **stronger bullish momentum** within the established trend.
* It suggests that buyers are in control and the stock is likely heading towards the **upper trendline of the channel**, or even attempting a breakout above it, especially given its recent push to new all-time highs.
* The middle line, having been crossed to the upside, now acts as a **dynamic support level**.
---
### **Implied Trend and Next Steps (based on the channel):**
* **Continued Upside:** Being above the middle line suggests a continuation of the upward trajectory within the channel.
* **Targeting Upper Band:** The next logical target for NVDA, within the context of this channel, would be its **upper trendline**. Given NVDA's history of consistently pushing boundaries, it might even test or break above this upper trendline, potentially signaling an acceleration of the trend or a "blow-off top" (though this is not guaranteed).
* **Support:** The middle line of the channel now becomes a key support to watch on any pullbacks. A move back below it would suggest a weakening of immediate momentum or a move back to the lower half of the channel.
---
### **Overall Outlook for NVDA:**
NVIDIA is trading at **all-time highs**, which itself is a testament to its strong bullish trend. The parallel channel analysis reinforces this:
* The fact that the price is **above the middle line** of a multi-month parallel channel (Nov 2023 to April 2025) indicates **significant bullish strength and control by buyers**.
* This suggests **continued upside potential** within the channel, with the upper trendline acting as the next likely resistance/target.
* NVIDIA's fundamentals (AI dominance, strong earnings, innovation) continue to fuel this technical strength.
**Important Note:** While parallel channels are powerful tools, extreme parabolic moves can sometimes lead to channel breaks or sharp corrections. Always combine technical analysis with fundamental understanding, risk management, and your own due diligence. Given NVDA's recent surge, it's also important to consider if the stock is becoming overextended in the short term, even within a strong uptrend.

Nvidia Key Resistance Test—Will $157.75 Trigger Rally? Current Price: $157.75
Direction: LONG
Targets:
- T1 = $161.80
- T2 = $169.50
Stop Levels:
- S1 = $155.25
- S2 = $150.75
**Wisdom of Professional Traders:**
This analysis synthesizes insights from thousands of professional traders and market experts, leveraging collective intelligence to identify high-probability trade setups. The wisdom of crowds principle suggests that aggregated market perspectives from experienced professionals often outperform individual forecasts, reducing cognitive biases and highlighting consensus opportunities in Nvidia.
**Key Insights:**
Nvidia remains a market leader in technology, benefiting from its dominance in artificial intelligence processing units and a growing demand for critical computing infrastructure. Traders widely recognize Nvidia's ability to capitalize on high-margin opportunities in the AI space and data-center expansion. Recently, bullish momentum patterns supported a breakout forecast, with expert price models suggesting that Nvidia will likely attempt key resistance zones before pushing higher.
However, challenges such as supply-chain constraints for semiconductor chips and broader sector overbought conditions might lead to intermittent retracements. Nvidia's historical resilience in tight cycles offers optimism, with analysts signaling growth opportunities as new catalysts emerge from both technical and fundamental perspectives.
**Recent Performance:**
Nvidia's stock performance has demonstrated volatility but remains strong year-to-date, driven by widespread adoption of AI technologies and strategic investments in autonomous systems, gaming advancements, and supercomputing infrastructure. Price action displays resilience near support levels and hints at a continuation of bullish trends. The stock recently formed a golden cross—a bullish technical indicator where the 50-day moving average crosses above the 200-day moving average—highlighting potential upside targets.
**Expert Analysis:**
Market professionals remain optimistic, projecting favorable long-term growth across Nvidia's highly profitable product lines. AI is expected to fuel enterprise solutions growth, with supercomputing initiatives providing durable momentum opportunities. Analysts also point out Nvidia's active partnerships with world-leading enterprises, including in sectors like autonomous vehicles, gaming, and cloud computing. Despite optimistic forecasts, traders should monitor overbought conditions and sector-wide supply bottlenecks before aggressively scaling positions. Resistance levels near $160 could spark consolidation, offering better entry points for subsequent moves higher.
**News Impact:**
Recent developments reinforce Nvidia's strategic positioning, including massive investments in AI-driven innovations and global partnerships. New product announcements and collaborative ventures with big tech players have amplified Nvidia's stock sentiment in expert circles. Yet, industry-wide chip shortages and macroeconomic concerns persist, potentially hampering rapid price acceleration. Positive earnings surprises or key news events in the coming quarter may further support a bullish case for Nvidia, validating its resilience as a top-tier growth stock.
**Trading Recommendation:**
Given Nvidia's sustained strength, coupled with bullish technical formations, a long position appears justified for traders seeking upside exposure. Current price action suggests well-supported price continuity amid investor enthusiasm for AI and supercomputing growth. Primary resistance levels at $161 and second-tier targets near $169 offer traders strong profit-taking junctures. Stop-loss levels below $155 safeguard against potential sector-wide retracements, ensuring disciplined risk management to preserve capital while leveraging Nvidia’s growth trajectory.

NVIDIA(NVDA) Jackpot – Thief Trading Blueprint for Fast Profits!🚀 NVDA Stock Heist: The Ultimate AI Gold Rush (Scalping/Day Trade Plan)
🌟 Hey there, Market Pirates! 🏴☠️💰
Thieves, Traders, and Money Makers—gather around! Based on the 🔥Thief Trading Style🔥, here’s our master blueprint to loot NVIDIA’s AI-fueled rally. Follow the strategy on the chart—long entry is LIVE! Our escape? Near the high-risk Resistance Zone. Overbought? Consolidation? Reversal trap? Bears are lurking, but we’re stealing profits first! 🎯💸
🎯 Entry (The Vault is Open!)
"Swipe the AI gold at any price—the heist is ON!"
Pro Tip: Use buy limits within 15-30min near swing lows/highs for pullback entries.
🛑 Stop Loss (Thief’s Escape Route)
SL at recent swing low (4H timeframe)—adjust based on your risk & lot size.
Scalpers/Day Traders: Tighten SL if stacking multiple orders.
🏆 Target 🎯: 165.00 (The AI Jackpot!)
📈 Why NVDA?
Bullish momentum from AI dominance, earnings hype, and institutional FOMO.
Tech sector strength + chip demand = THIEF’S PARADISE.
📰 Fundamental Heist Intel
Need macro trends, sentiment, and intermarket analysis? 🔗 Check our bioo for the full robbery toolkit.
⚠️ Trading Alert: News & Position Control
Avoid new trades during earnings/news—volatility kills heists!
Trailing SLs = Locked profits. Don’t get greedy!
💥 Boost This Heist!
👊 Hit "Like" & "Boost" to fuel our next raid. Every click = More stolen profits! 🚀💰
🤑 Stay tuned—more heists coming! NVIDIA today… what’s next? 🤫🐱👤

NVDA GEX Analysis for Options Trading. Jul 7Gamma Exposure (GEX) Insights – July 5, 2025
* 📍Key Gamma Wall (Resistance):
→ 160.98 — Highest positive GEX level (strong call wall / gamma resistance).
→ 162.5 — Next large call wall, acting as a magnet or rejection pivot.
→ 165 / 170 — Thin GEX above = squeeze zone if breakout occurs.
* 🧲 Support Side:
→ 152.5 – 150: HVL + Put Support + GEX pocket.
→ 140: Second PUT wall, deeper support if breakdown worsens.
* 📉 IV Sentiment:
→ IVR: 5.6, IVx avg: 37.9 = Low implied volatility.
→ Current IV crush environment favors debit call spreads or directional long calls with tight risk.
* 📊 Call/Put Flow:
→ Calls: 3.3%, Puts: -0.53%
→ Slight bullish bias but not overcrowded — room for gamma expansion.
🔄 Options Trade Setups Based on GEX
Bullish Gamma Squeeze Setup:
🟢 Trigger: Price breaks and holds above 161.
🧨 Target: 165 → 170 (thin GEX zone could cause sharp move).
🛡️ Strategy: Buy 160C / Sell 165C (debit spread) or long 162.5C with defined stop.
⛔ Stop: If NVDA fails to hold above 158.
Bearish Gamma Rejection Setup:
🔴 Trigger: Rejection at 160.98–162.5 zone with volume fade.
🎯 Target: 156.5 → 152.
🛡️ Strategy: Long 160P / Short 155P (bear put spread) or short 162.5C naked if IV allows.
⛔ Stop: Breakout above 162.5 invalidates this setup.
📈 1-Hour Chart Technical Analysis
Structure & Price Action:
* NVDA is in bullish market structure, forming higher lows with a clean CHoCH → BOS → retest play.
* It reclaimed the 159.20 level and is testing the 160.98–162.5 zone — a key area where momentum traders will engage.
Zones to Watch:
* Support:
→ 156.68 (minor swing support)
→ 153–152 OB zone (valid bullish OB + HVL)
* Resistance:
→ 161–162.5 (GEX resistance + supply)
→ Above 162.5 opens room to 165+
Trend & Volume:
* Strong bullish candle breaking BOS.
* Volume picked up during BOS, but follow-through needs to come with breakout candles or retest hold.
🔍 My Suggestions for Intraday/Swing Traders:
✅ Bullish Setup:
If NVDA holds above 159.20 and reclaims 161, enter on retest of 160.50.
TP1: 162.5
TP2: 165
SL: Below 157.80
❌ Bearish Setup:
If price gets rejected near 162 and breaks below 157.80 → short retracement to 153.
TP1: 156.5
TP2: 152
SL: Above 162.50
My View:
Currently bullish bias but entering a decision zone. Wait for clean breakout with volume, or short rejection if momentum fades. Keep GEX in mind — above 162.5 has little resistance and can rip.
This breakdown is for educational purposes only and not financial advice. Always manage your risk before taking a trade.

NVDIA to 185 or Higher base Trend ExtensionInitial Impulse Move (P1 to P2): The strong upward movement from $90.33 to $153 shows significant bullish momentum.
Healthy Retracement (P2 to P3): The pullback to $87 represents a deep correction—deeper than the starting point, suggesting a potential shakeout before resuming upward.
Extension Projection: Using the 1.618 level from this wave structure, the projected price of ~$187 serves as a potential target or resistance level where price may react or consolidate.
Technical Significance: The 1.618 level is often used by traders to anticipate where profit-taking or trend exhaustion may occur in strong moves, especially after a retracement.


NVIDIA AnalysisNASDAQ:NVDA
NVIDIA (NVDA) – Elliott Wave + Fib Confluence Forecast | 2025/26 Outlook
After a textbook falling wedge breakout and bullish retest, NVIDIA is now completing a potential (A)-(B)-(C) correction wave structure. Here's the detailed outlook:
🧠 Technical Structure & Price Zones
The (A) wave may have topped near 159.59, with strong Fib confluence zones (2.618–4.236) and a visible rejection.
A sharp (A) down leg is projected to test the Fib 0.618–0.786 support between 114–102 USD, aligning with a historical demand zone and key structural low.
A corrective (B) bounce could reach up to ~142 USD, which is the 0.618 retracement of the projected fall.
The final (C) wave may target the 1.618 extension around 187–190 USD, suggesting a potential year-end rally if the wave structure unfolds as expected.
These may again align with wave turning points, particularly around July and September 2025.
📊 Fibonacci Clusters
Numerous Fib confluences were detected using the full wave stack (retracements, extensions, projections).
Watch the 121.92 and 142.82 horizontal zones — both are strong Fib overlaps and historical pivot levels.
Blue vertical lines indicate potential turning windows.
📌 Conclusion: A high-probability ABC correction pattern seems to be forming. Once Wave (B) completes, a final impulsive push toward ~190 USD could occur before a larger correction sets in. Monitor macro headlines and price behavior near Fib zones.
💬 Let me know your thoughts below — bullish, bearish, or neutral? Always happy to discuss wave setups!

NVIDIA NVIDIA has tapped the target we setup few weeks ago, now we are waiting for the pullback.
Disclosure: We are part of Trade Nation's Influencer program and receive a monthly fee for using their TradingView charts in our analysis.

NVIDIA Has more room to raise furtherIs it V-Shape pattern ? If Yes, it's definitely ready to go up and possible to hit 199-200
