Procter&Gamble: Short-Term Strength Still Fits the PlanPG has extended its rally, pushing turquoise wave C higher. While some selling pressure is starting to show, we’re sticking with our primary view: the stock should still break above $180.43 to complete beige wave b before turning lower. However, in our 37% likely alternative scenario, beige wave alt.b would have already topped, and the stock would next drop below $148.87.
📈 Over 190 precise analyses, clear entry points, and defined Target Zones - that's what we do.
PGCL trade ideas

PG eyes on $165-166: proven Major Resistance to Pump or DumpPG trying to recover from the tariff bottom.
Currently testing a major Resistance zone.
Look for Dip to Green zone or Break-n-Retest.

Can P&G Weather the Economic Storm?Procter & Gamble, a global leader in consumer goods, currently faces significant economic turbulence, exemplified by recent job cuts and a decline in its stock value. The primary catalyst for these challenges stems from the Trump administration's tariff policies, which have directly impacted P&G's supply chain by increasing costs for raw materials and finished goods imported from China. This financial burden, estimated to be hundreds of millions of dollars, compels P&G to reassess sourcing strategies, enhance productivity, and potentially raise product prices, risking a reduction in consumer demand.
In response to these escalating pressures and a noticeable slowdown in category growth rates within the U.S., P&G has initiated a substantial restructuring program. This includes the elimination of up to 7,000 jobs, representing approximately 15% of its non-manufacturing workforce, over the next two years. The company also plans to discontinue sales of certain products in specific markets as part of its broader strategic adjustments. These decisive measures aim to safeguard P&G's long-term financial algorithm, although executives acknowledge they do not alleviate immediate operational hurdles.
Beyond the direct impact of tariffs, a pervasive sense of economic uncertainty and declining consumer confidence in the U.S. further complicates P&G's operating environment. Recent data indicates a sustained drop in consumer sentiment, directly influencing discretionary spending and prompting households to become more cautious with their purchases. This shift, combined with broader negative economic indicators such as rising jobless claims and increased layoffs across various sectors, creates a challenging landscape for companies reliant on robust consumer spending. P&G's immediate future hinges on its strategic agility in mitigating tariff impacts, managing pricing, and adapting to a volatile economic climate.

Go DefensiveUncertain and relatively bearish market at the moment, I expect "boring" defensive stocks such as PG to be the safety play for most investors.
I think this will bounce to $180.
Not financial advice, good luck to all :)

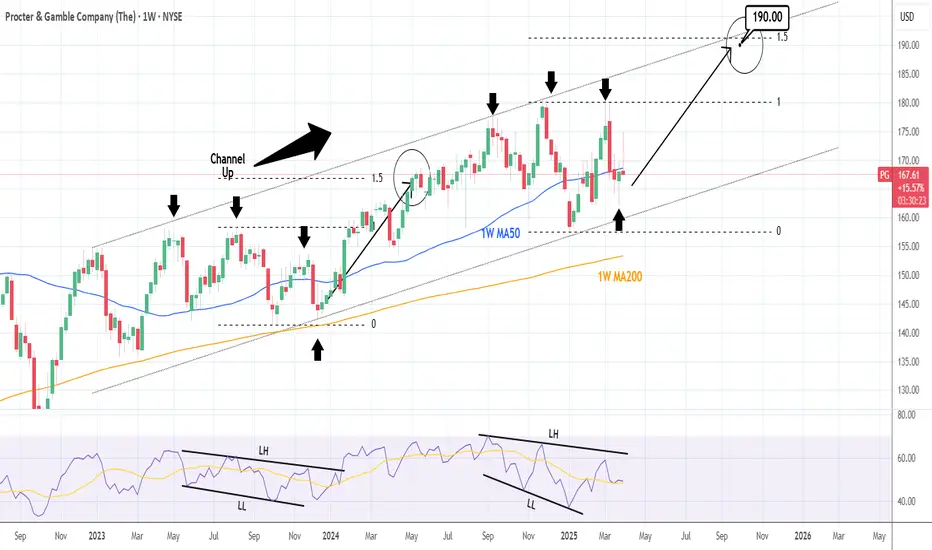
PROCTER & GAMBLE: This volatility implies a major market bottom.Procter & Gamble is neutral on both the 1D (RSI = 47.822, MACD = 0.180, ADX = 17.832) and 1W (RSI = 49.820, MACD = 0.340, ADX = 20.781) technical outlooks as despite last week's rebound and this ones early strong rise, it pulled back and is about to close the 1W candle flat. We are exactly on the 1W MA50, which inside the 2 year Channel Up has always been a fair level to go long. The 1W RSI indicates that last week's low may be the symmetric low to December 11th 2023. This kickstarted a rally that hit the 1.5 Fibonacci extension. Consequently we are bullish long term, aiming at just under the new 1.5 Fib (TP = 190.00).
## If you like our free content follow our profile to get more daily ideas. ##
## Comments and likes are greatly appreciated. ##
PG - Procter & Gamble Company (Daily chart, NYSE)PG - Procter & Gamble Company (Daily chart, NYSE) - Long Position; Short-term research idea.
Risk assessment: High {volume & support structure integrity risk}
Risk/Reward ratio ~ 1.33
Current Market Price (CMP) ~ 170.40
Entry limit ~ 169
1. Target limit ~ 174 (+2.96%; +5 points)
Stop order limit ~ 165.25 (-2.22%; -3.75 points)
Disclaimer: Investments in securities markets are subject to market risks. All information presented in this group is strictly for reference and personal study purposes only and is not a recommendation and/or a solicitation to act upon under any interpretation of the letter.
LEGEND:
{curly brackets} = observation notes
= important updates
(parentheses) = information details
~ tilde/approximation = variable value
- hyphen = fixed value

Harmonically Bullish on Procter and Gamble. PGXABC bullish zigzag, within a structure harmonically consistent with a developing XABCD. In harmonic reactions, retracements are often indicative of extensions to follow, which in this case is 1.618. This conveniently aligns in a Fibonacci cluster with a .886 larger retracement, consistent with a Bat Harmonic. One thing about Bats is that they are the most common and the most reliable out of the harmonic family. Interestingly, MIDAS, VZO, Stoch and BB%PCT all flipped on literally the same candle? Fractal resonance anyone?

PG one more tryAfter undercutting and rallying on good earnings NYSE:PG is setting up again in an ascending triangle structure for the last 2 weeks
targeting 172.5 & 175

Upgoing on Procter and Gamble. PGReady to gamble with tight stops that we might be having and upgoing ABC here. We are monitoring this position incase this is not the actual break out. Price action is suggestive. Now, what do we mean by that? Anytime we have a plateau or flat price action after any short burst, it can be taken as and indication of more price action in the initial direction.

Is PG Going to Break Resistance?
Looking at the volume profile, it suggests that the trend is heading upward.
If buying pressure keeps up, there's a good chance to test the resistance???

PG SellPG nice pull back after a long down trend. Looking for Trend continuation off the Daily Fib zone back to the lows. Good R/R

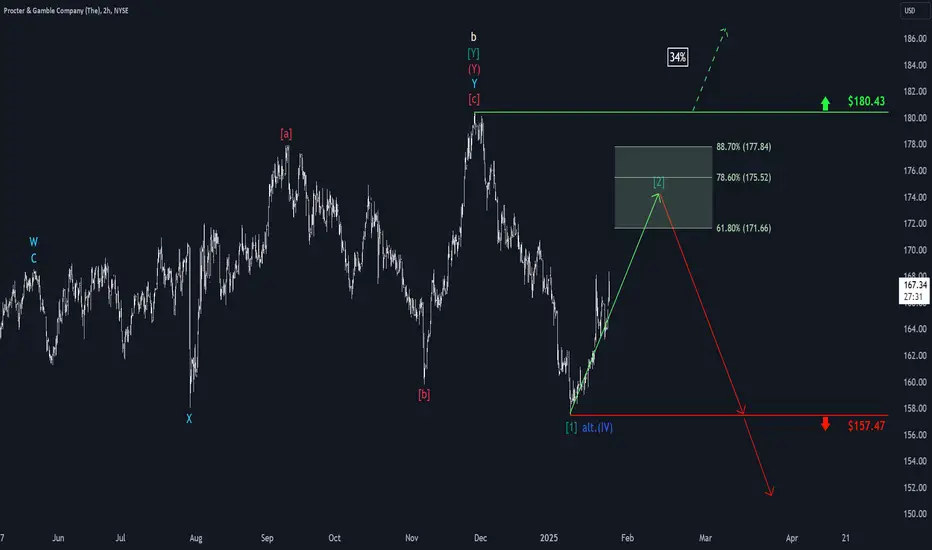
Procter & Gamble: Target Zone Ahead!Wave in dark green has been successfully completed, creating a new support level at $157.47 with its low. PG is currently working on the countermovement of wave , and we have outlined a Target Zone for the expected top (between $171.66 and $177.84). This price range could be an opportunity to take profits from long trades or establish new short positions. However, our alternative scenario, which allows for a breakout to the upside, holds a 34% probability. If the stock manages to climb above the resistance at $180.43, this will suggest that the broader uptrend continues. In this case, the low observed would not correspond to wave in dark green, but rather to wave alt.(IV) in blue. So, potential short positions could be secured with a stop-loss set 1% above the upper boundary of our Target Zone.
PROCTER AND GAMBLE USDThis may be a opportunity for 10 % move. Price can Swing from support. Break trend line. This is not Buying Selling Tips. Plz take your according to your view or ask to financial adviser.

PG Channel Trade - Oversold/BouncePG set up for bounce. Staple goods. Looking for reversal confirmation.

Procter & Gamble (P&G) Overview and AnalysisProcter & Gamble (P&G) is a global leader in consumer goods, offering a wide range of household, personal care, and health products. Their iconic brands, including Tide, Gillette, Pampers, and Olay, have made them a household name worldwide.
1️⃣ Past Performance: In their last two earnings reports, the stock jumped by ~12% after strong results.
2️⃣ Current Price: The stock has dropped to a key support level ($159), attracting buyers at a discount.
3️⃣ Upcoming Earnings: Set for January 22, 2025—a potential catalyst for movement.
4️⃣ Outlook: Analysts predict a price target of $209 by year-end, highlighting strong growth potential.

$NYSE:PG Setting up againAfter this bull flag breakout idea:
NYSE:PG has retraced back and giving 4 confluences to go long here:
* Bouncing off the Weekly 50 SMA
* Bouncing off the Daily 200 SMA
* 0.618 fib retracement bounce
* Bounce off of the ascending support line since 22'
The risk is weekly close under 50 SMA
The profit targets would be 175 & 180
I am looking at the 180C for February to cover earnings, can also go with LEAPS for peace of mind

PG “Potential Reversal”NYSE:PG is showing signs of a potential reversal….after testing the 200 MA technicals are shifting bullish!

PG heads up at $177: Possible double top here for a good reasonPG previously topped at this double fib zone for a reason.
Golden Genesis reinforced by a Covid fib for strong resistance.
Now to see if we get a "double top" here or a Break-and-Run.
$ 177.03-177.52 is the key zone of interest.
Looking for a rejection to supports below.
Or a Break-and-Retest entry for next leg.
======================================================

Bullish PG Bullish Call Options!Options Call for PG January 17, 2025!
Bullish Call: $170 Call at $5.30 on Robinhood, target price is $180 so it would be aproximetly a $11-13 option by the end of January 17th (+41D). The conditions are favorable with a Delta of 0.5902, an implied Volatility of 15.16%, and a Chance of Profit of 37.08%.
Stock Targets: 178 Target Profit, 170 Entry, 168 Stop Loss, it's a 2.58 Risk to reward ratio with a 7.65% Price Swing or 15% if PG overshoots to $190!
Chart Analysis: Bullish XABCD Chart pattern. Confirmed Bullish Breakout on the Regression Trend with a Bullish 3 Bars FVG.
Technical Indicators: Gabriel's Fractal TRAMA Dragon indicates a recent Bullish Reversal. There also is a Rising Buy Volume over the past 4 days with a Bullish Delta RSI 5 days ago, that is comfortably away from the Overbought condition. Next is the SMI-MFI Bullish KD% Crossover that was 6 days ago. Finally, there is my personal QQEMOD with a Bullish Momentum (-3D), Divergence(-8D), and a DMI Reading of a Weak Uptrend (-2D).
Market Sentiment: Bullish on Daily Charts, Bullish on Weekly Charts, and Strong Bullish on Monthly Charts!!!
Volatility Conditions: Wide Squeeze on Daily Charts, Normal Squeeze on Weekly Charts, but there is a Fired Squeeze on the Monthly Charts. This means that the price might overshoot to $190-195, if both the Squeezes on the Daily and Weekly charts are fired as well.

$PG, sleeper stockOne of the best in consumer staples right now, big lower wick and held the horizontal and ascending support...can go nuts.
can buy shares and be stress free instead of options...
better way would be to buy debit spreads for 1-2 years out to amplify returns

Gunning for an ascending triangle breakoutNYSE:PG has been on an uptrend for the past 1.5 years and although the larger trend may look distributive, the stock may gun for one more leg of upside as there is no strong selling pressure on 22 May when it corrected. In fact, after the 2nd selling at 168 resistance , the selling pressure became weaker and it forms a higher low, indicating strong buying pressure potentially.
Here's the plan, should the stock break out, I'm aiming to TP at 173.23 first as I think there might be a retracement thereafter. Afterwhich, I will allocate some position at 163.09 and 158.10 should there be any pullback.

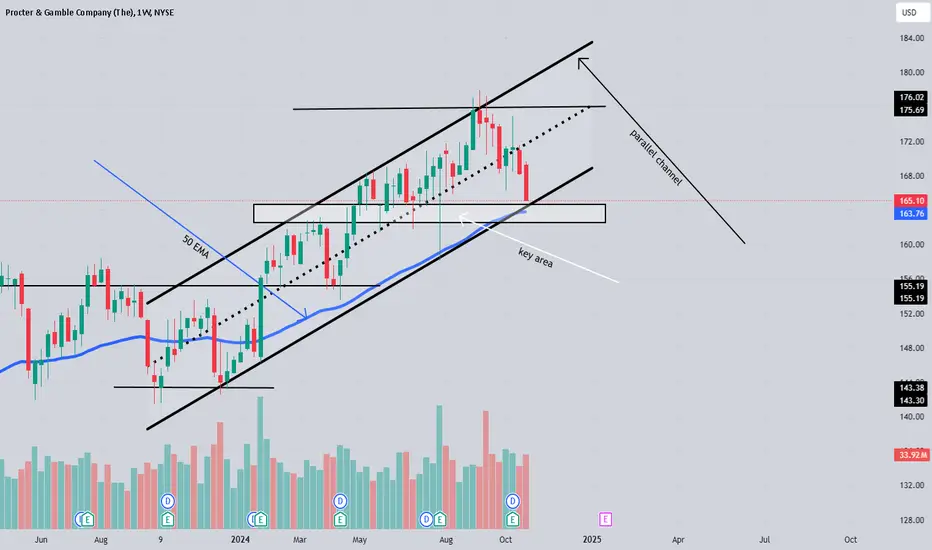
PG Weekly ChartPositives- Candlestick resting on 50 EMA, Resting on key support level, bottom of and upward parallel channel possible cycle up
Negatives- minor downward trend, with bearish candles, election week
The Procter & Gamble Company (P&G) | Chart & Forecast SummaryRight Here You Can See The Procter & Gamble Company (P&G) With The Symbol "P&G" Registered On The New York Stock Exchange. The Procter & Gamble Company (P&G) Is An American Multinational Consumer Goods Corporation Headquartered In Cincinnati, Ohio
The Following Chart & Forecast Summary On The Procter & Gamble Company (P&G) Has been Subject On
Key Indicators on A Trade Set Up in General Like A
1. A Push Set Up
2. A Range Set up
3. A Break & Retest Set Up
Overall Conclusion | Like The Trade Plan Execution & Risk Management On Demand It Tells Us
It Is A Neutral Bias For Now
