seeing a great Trianlge on TGT. Will enter long long plays seeing a great Trianlge on TGT. Will enter long long plays after Break of the Triangle
TGT trade ideas


TGT Potential BreakoutTGT is testing its highs with an inverse head and shoulders and ascending triangle. WIth a break out confirmed on a close, the top of the ascending channel it is in, the measured move of the ascending triangle, and fib extensions all together give profit taking areas as well as reasonable stops. TGT does not report earnings until August 11th. Unfortunately, this trade setup gets no help from the oscillators.

TGT Strong Bull Flag TGT is setting up for a move higher. Strong Bull Flag sitting just under defined resistance. Friday it tried to breakout but couldn't sustain the move and fell back into pattern. I will look for an entry this week through the 124 - 124.50 level on strong volume.

$TGT Bull FlagAnother Nice Bull Flag - looking for breakout here to retest all time highs at $130 as possible earnings run-up.

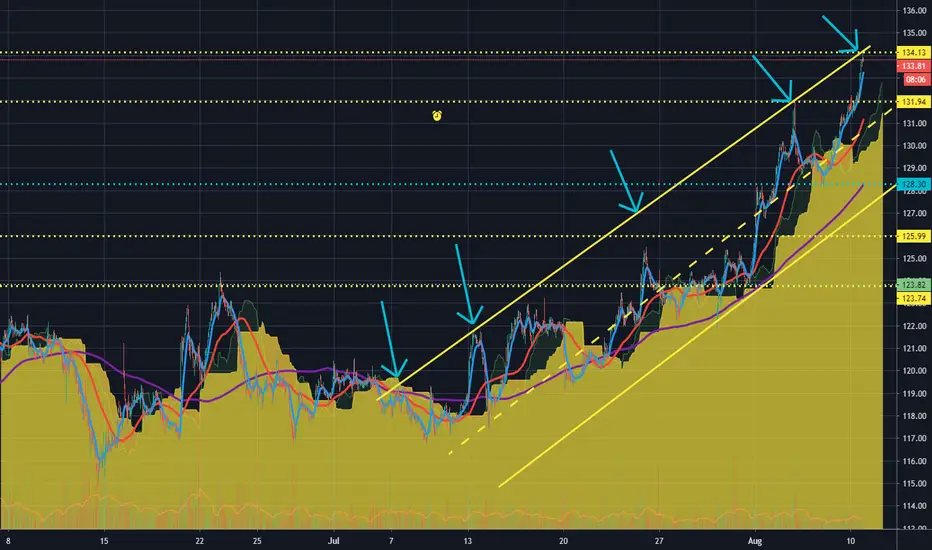
TGT Possible Breakout to 130!Hi looking at this nice setup for a TGT move from 124.08 to 130.00! No roadblocks in the way!

Double Bottom and Bullish Divergence on TGTAs you can see, the price action is contained within a descending broadening wedge at the moment, which has appeared to have found a double bottom, with Class A Bullish Divergence on the MACD and Class B Bullish Divergence on the RSI. From my entry point at $92.84, if the trade reaches the 382 fib retracement, that would be a 9.23% gain. If it reaches Dow's 50% retracement, then it will be 12.83%, and if it goes so high as to reach the top of the descending broadening wedge where it will run into the 618 Golden Zone as well as the 200 and 50 day moving averages as resistance, I will see a profit of 16.44%.
It's worth noting that bullish divergence is not as reliable in a bear trend.
None of this is financial advice, and I am not employed or affiliated with Apollo Trading in any way. I am, however, interested in hearing critiques and criticisms of this idea.

TGT - Poor Retail - Poor R/R RatioThe poor retail sector, TGT you looked so good before, lapping WMT , chasing AMZN , but then the 'rona.
TGT still has great long term potential, current Mr Market is pricing in a -1%YoY growth rate on DCF to get to a $121 price point, 0% gets you $131, and current EBIT valuations have you around the $94/98 point. This should lag in the tight zone till earnings . If we get a "bad" number, let it sell-off, look for the $110/100 point, and pick up a few shares knowing that the world is not coming to an end.
Really poor R/R ratio right now before earnings (~0.5), but when you get past earning with a nice drop you can turn that into a number in the ~3.5 to 7 range. Technicals, charts, VOLUME! and fundamental analysis = how to stay in the market.

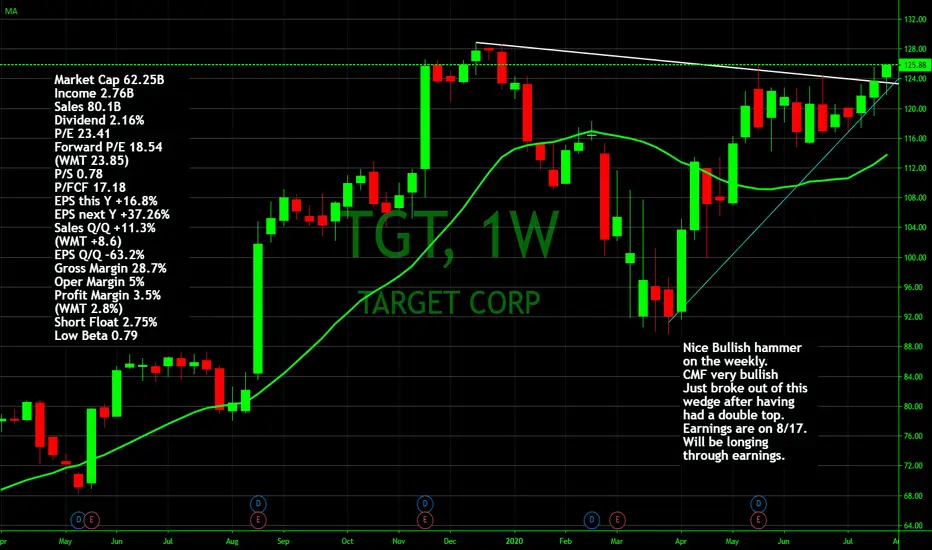
Target - $129 Price TargetMarket Cap 62.25B
Income 2.76B
Sales 80.1B
Dividend 2.16%
P/E 23.41
Forward P/E 18.54 (WMT 23.85)
P/S 0.78
P/FCF 17.18
EPS this Y +16.8%
EPS next Y +37.26%
Sales Q/Q +11.3% (WMT +8.6)
EPS Q/Q -63.2%
Gross Margin 28.7%
Oper Margin 5%
Profit Margin 3.5% (WMT 2.8%)
Short Float 2.75%
Low Beta 0.79

TGT BUY OR LONG , TARGET UP TO $150 TGT will confirm the triangle pattern at $125, the triangle pattern for the target to $135 but the resistance is at $130
and if it breaks past the old peak of $130, TGT will have a chance to touch $150.
- Price is above support 1d (MA200)
- MACD supports the new rising trend
- Volume is awaiting confirmation
=> Offer to buy in two zones ($125 + $131) at a rate of 50% + 50% <=> ($125 +$131) = price average $128
=> Stop loss : 10%
=> Target $150
Wish you good deals!

TGT BreakoutBulls have a duty, and that's to push TGT past $126. The volume profile becomes extensively low and it is easy to assume a further breakout by TGT. AVWAPs are holding as support and buying momentum has been strong. PT is $130, followed into $140. I am long TGT.


#target $TGT #weekendchartreading breakout from a trianglechart to watch for next week,
odds of follow through are high


TGTTGT has been forming a nice consolidation lately with a strong resistance area from around 122.80 to 123.60. Looking for a continuation of the strong bullish day yesterday after today's panic sell brought it down. Note the 20SMA looking ready to cross up the 50MA, which can help push it past the resistance area and possibly make a run to 126.

