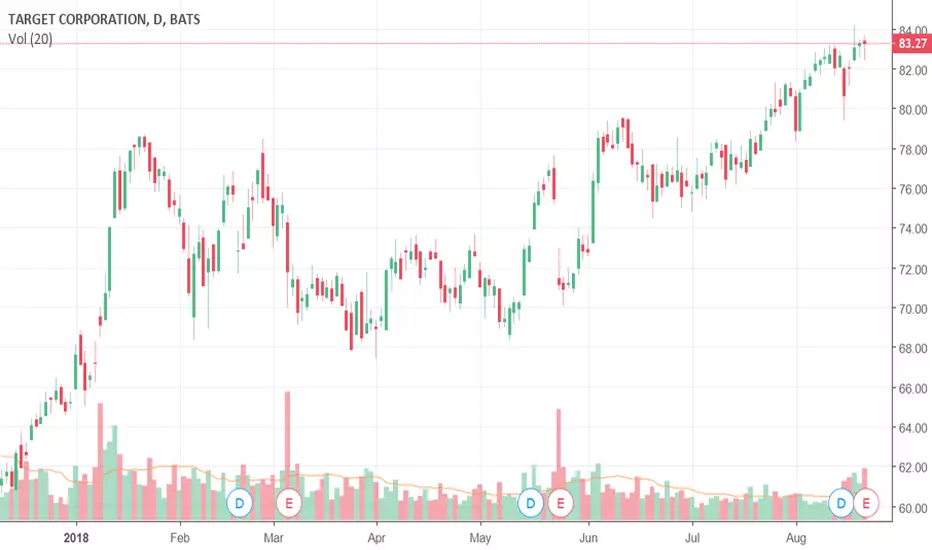
Target (TGT) earnings: revenue growth accelerating or not?Target Corporation (TGT) shares are trading at 83.27. The company is scheduled to announce its second-quarter results on August 22 before the opening bell. What's driving TGT stock price? What's TGT stock price forecast?
Analysts are keeping an eye peeled for market share gains after strong Walmart results last week.
Target is an iconic brand that's under threat from considerably larger and more powerful competitors Amazon and Walmart. The company differentiates itself through signature categories (apparel and wellness) that carry higher margins and faster growth rates than other areas of its business.
www.finstead.com
TGT trade ideas


TGTNow price is in the range between levels:
supoort level @72.45
resistance level @73.21
Enter if m15 hold above 73.25
Stop: 72.36
Target 1: 74.4
Target 2: 74.98

short TGT - Short Term TradeI have bought the puts for TGT ending next week. This has been falling for the last 2 days on decent volume.
My tgt : 75
SL : 78


Sharing a chart for a friend. Price prediction for TGTI believe that target has room to retrace to the $64 range. There is strong long term support at these levels and it could be a strong buy signal.

Good place to buy TGTGood spot to pick up some TGT. Lots of support (100 EMA, cloud and previous resistance). Additionally, TGT will be on a red 9 on the TD indicator, so a good spot for a price flip (at least temporarily). I'll put an $83 to $85 target on this, with timetable of 4-8 weeks. Bonus bullevidence... upcoming golden cross of the 50/200 EMA on the weekly.


Bullish CypherBullish Cypher with bullish divergence. It looks messy but it measures really well.
Measurements
- .786XC
- 1.27BC

THE WEEK AHEAD: TGT, ANF, COST, XOP, OIH, FXIA trio of retail names, TGT, ANF, and COST announce next week ... .
TGT announces on 3/6 before market open. Preliminarily, the March 16th, 11-day, 20-delta 69.5/81 short strangle pays 1.54 at the mid, with its defined risk counterpart, the 66.5/69/81/84 iron condor paying under 1/3rd the width of the wings at .83/contract, slightly shy of the credit I like to receive on those to pull the trigger.
For those into the short put/acquire/cover cycle type trade (I'm going to refer to these as "spack" trades for short):* the 30 delta, March 16th 71.5 short put is paying 1.37 at the mid, which would yield a cost basis of 70.13 of any assigned shares, a discount of 6.7% over where the underlying is currently trading.
ANF announces on 3/7 before market open. Given the size of the underlying, I'd probably go short straddle, with the March 16th 21 paying 3.22 at the door and its defined risk iron fly variation -- the 17/21/21/25 paying 2.56, slightly greater than 1/4 the width of the long strangle component of the setup, which is what I want to see at the least out of an iron fly.
The "spack" trade: the March 16th, 30 delta 19 short put is paying .91/contract, yielding a cost basis of 18.09 in any assigned shares versus 20.68 market, a 12.5% discount.
Lastly, COST announces on the 7th, after market close. The March 16th 177.5/200 short strangle is paying 2.40, with the defined risk 172.5/177.5/200/205 paying 1.21, somewhat short of 1/3rd the width of the wings.
The spack trade is to sell the March 16th 182.5 for 2.31/contract which would result in a cost basis of 180.19 in assigned shares -- a 4.8% discount over where shares are currently trading.
Sector-wise, the volatility remains in a familiar place, with XOP/OIH having the highest (34%). FXI (29%), XRT (27%), and XHB (26%) follow in descending order, with background implied a bit on the light side (I like >35% to bother).
Depending on your thoughts about where petro is heading: The XOP April 20th 31/37 short strangle is paying 1.01 at the mid (neutral assumption); the April 20th 32 short put (bullish assumption) is paying .74 with a resulting cost basis of 31.26 (an 8.4% discount over current share price); and the Plain Jane slightly monied April 20th 34 covered call (buy shares at 34.14, sell the April 20th 34 short call) costs 32.50 to put on (a 4.8% discount over current price) (selling the April 20th 34 short put for 1.47 yields basically the same metrics).
The FXI April 20th 44/51 short strangle is paying 1.41 at the mid, with the spack trade being to sell the April 20th 45 put for a .94 credit, resulting in a cost basis of 44.06 per share, a 6.8% discount over where the underlying is currently trading.
* -- Generally speaking, the cycle is to: (a) Sell puts. At expiry, if price is above your strike, you keep the premium. (b) If at expiry, price is below your strike, either allow yourself to be assigned, or roll the short put out "as is" for credit and therefore further cost basis reduction. (c) On assignment, proceed to cover your shares by selling calls against at or above your cost basis in the shares, looking to exit the trade profitably.

Possible TGT bullish pennant formationIf price action closes above flag's upper resistance level, expect a brief retest of resistance to establish support and then a continuation higher. NYSE:TGT

Possible bullish flag breakout on TGTIf price action closes above flag's upper resistance level, expect a possible retest of resistance to establish support and then a bullish continuation. NYSE:TGT

TGT Swing Trade on a pullback into the 10/20 EMALooks like a good place for Target to pullback before continuing bullish. The stop is below the 10, 20, and 50 EMA on the hourly, as well as the 100 and 200 SMA. I believe that will be too many averages for it to breakthrough to trigger the stop. Hoping to be in this trade for less than 2 weeks.


Quick swing tradeWho knows what happens with the crazy volatility in the markets, but I'm hoping for a small pullback on Target to trigger this bad boy. I figure it's going to move quite a bit tomorrow. Time will tell.

High Strength Hi guys. I see there is tons of potential here. Apart from the technical analysis I don't see another store with so many customers. Bullish in my humble opinion. Thank you for taking a look.


Triangle or Pennant Breakout | Andrew AponasI analyzed TGT from the Monthly-Daily. From what I can tell it looks like TGT just sold off in a strong bearish down trend on the weekly chart, however price may now be entering a period of accumulation by the insiders. The Blue sideways moving channel is drawn from the weekly and the grey upward moving channel is for the current price action.I have also drawn a test ceiling and supply and demand lines from the monthly. The demand line is drawn exactly where the top of the weekly channel is. I have a bullish breakpoint already drawn on the chart which has signaled an entry to buy, however price is consolidating in a small pennant or triangle, confirmed by the declining volume. I also took note of the last major price waterfall which could have been the insiders buying into the markets selling, thus accumulating their position. It is difficult to conclude where price may breakout to, in the past it has reversed bearish at this ceiling; and the market may be overbought. Price has already diverged from the breakpoint signal, and the indicators (fast) are all overbought calculations. I will stay neutral and wait for confirmation of the direction of the breakout, which will be from the indicators and volume. Thank You, God Bless.
Aroon I have set at a faster speed and found both lines descending in uniform confirming this period of consolidation, the first line that breaks the 50% line will be one signal of the direction of the breakout.
MACD I have set at a faster speed and can see this may be a good pivot point for a reversal however the histogram is still bullish and has the potential to remain above the 0 line and the lines are threading together which in my experience signals price is still in a trend, which means the bullish trend may still be my friend.
Stoch. I have set at a faster speed and have noted that price is in an uptrend threading since 11/15 and has not confirmed that the plot below overbought is signaling to sell. This also may suggest the bullish trend is still my friend.
finance.yahoo.com
finance.yahoo.com
finance.yahoo.com
www.stockconsultant.com
www.stock2own.com
www.opiniontrade.com
www.predictwallstreet.com

Break Points | Break Point Signals | Break Point Signal Lines | Hi I am going to introduce a concept that I learned from trader, user-name gumbtg. Although the concepts were never formerly named while I was learning them from this young trader I have dubbed them "Break-Points" which are a class of intersecting points and can be used on any chart, time frame, or indicator. The concept remains the same through out each different application.
What is a breakpoint? A breakpoint is the intersecting point plotted after the trendline is broken. In example if the trendline is bullish and price finally reverses to break the trendline bearish the exact point at which price has broken the trendline is then plotted, as seen with the transparent blue ovals. This becomes the breakpoint.
From this breakpoint, which remember is a class of intersecting points, the Break Point Signal Line is drawn. The Break Point Signal line is a horizontal line that extends outward and remains active until broken, as seen with the orange horizontal lines. Once price trades in this same example bullish and close above this line a break point signal is confirmed.
What is a Break Point Signal? The breakpoint signal in this example is a bullish signal to go long, once price trades back above this horizontal line and closes there it signals a buy signal to go long, as seen with the blue tailless arrows.
To summarize: Bulls, the intersecting point where the trendline has been broken creates a signal to go long AGAIN once price closes above this value. And Vice Versa. The bear side is the exact same concept except it is applied as an inverse, once price closes below the signal line it confirms a signal to sell short AGAIN. The signal is always in the same direction as the original trend. The Signal line is always a horizontal line drawn from the intersecting point where the trendline was broken.
I learned these concepts from another Trading View Member, Username GUMBTG, who I will tag in the comments below. Please visit his profile for more examples and trade ideas specific on breakpoints, however I do not know if he is or will be calling them Break Points, Break Point Signal Lines, and Break Point Signals. Those names I guarantee will be refereed to in my analysis on my trading ideas. Thank You, God Bless.
