Tesla The Power of Candlesticks in Action!
On this Tesla (TSLA) chart, we’ve spotted two bullish candlestick patterns—but will they spark upside momentum? 📈
Will buyers step in on this signal, or is there more downside ahead? 🤔
From Bitcoin, we’ve seen that demand can be created even without a physical product—will TSLA follow the same psychology? Let’s watch how price reacts! 🚀📊
#Tesla #StockMarket #CandlestickPatterns #Trading #BullishOrBearish
TSLA trade ideas

Tesla rebounds after 55% grash, can it keep climbing?Tesla stock is bouncing back after a rough start to 2025. Following 58 days of sideways trading, a breakout has triggered a 27% move. What is next and is too late to trade?
This content is not directed to residents of the EU or UK. Any opinions, news, research, analyses, prices or other information contained on this website is provided as general market commentary and does not constitute investment advice. ThinkMarkets will not accept liability for any loss or damage including, without limitation, to any loss of profit which may arise directly or indirectly from use of or reliance on such information.

$TSLA approaching a good area for shortAs tesla approaches the 50% mark of 4hr structure look to take shorts. 1st target can be 327ish depending on candle closes we might be able to take lower to 310 then maybe 300.

TESLA LOOKS REALLY GOOD FOR THE NEXT 3 YEARS FROM HEREIn this video, I talk about how the next 2 to 3 years look super bright for Tesla stock's future, and even how the next 6 to 12 months could play out


Tesla Bullish, Let Me ExplainYesterday's high was the highest price since 4-March 2025, almost two months ago. The fact that TSLA moved out of bottom prices and strong long-term support zone while challenging resistance is a bullish signal.
The prices that were activated in Mach and April as support is the same range that TSLA used back in 2024 to launch the previous bullish wave. The same prices as in October and September 2024. The same levels were activated but as a higher low. Clearly a bullish dynamic.
For this setup to be bearish, the action would have to go lower and print a lower low compared to August 2024, this isn't the case. We have a strong higher low which means that buyers were eager to enter the market and waiting for this long-term support zone to be activated. As soon as it was activated buyers showed up and this is confirmed by current price action. Short-term, Tesla is moving up.
This is short-term because a new bullish wave is just now getting started but the fact is pointing towards additional growth.
Yesterday TSLA closed above EMA55 daily for the first after hitting support since October 2024. Once EMA55 gets challenged and conquered, we are looking at the least 2-3 months of bullish action. Don't get me wrong, there can be swings short-term, shakeouts and such but no new lows. The low has been set 7-April 2025, from this point on, we will see growth.
Once a strong resistance level is challenged, we can look at the chart and see if there will be a major correction or just a retrace before additional growth. The truth is that the stock market is set to go higher, TSLA is just one stock. The SPX, NVDA, Bitcoin and many other instruments will grow. Everything will grow.
Namaste.

Looks like a reversal to the high 200sWith OB oscillators, and reversal pattern, this is very likely to retrace from here and fill some gaps along the way.

Looking at a clear direction down to around 290Specifically the quick moving 10%+ plus the Friday from before has left many open areas to target, especially as the OB levels are at a head. This isn't short of anything more than a bear reversal, no pun intended.

Tesla Wave Analysis – 13 May 2025- Tesla broke resistance area
- Likely to rise to resistance level 360.00
Tesla recently broke the resistance area between the round resistance level 300.00 (which stopped the previous waves 4 and (1)) and the 38.2% Fibonacci correction of the downward impulse (C) from January.
The breakout of this resistance area accelerated the active medium-term impulse wave (3) from the end of April.
Tesla can be expected to rise to the next resistance level 360.00, top of the previous wave 2 from February and the target price for the completion of the active impulse wave (3).

TSLA bottom on Weekly chartI am calling a temporary bottom on TSLA stock due to Ichimoku cloud support on the Weekly chart. Ignore the bad news and all the other things going on. Price is everything. Stop losses should be placed below the cloud support. If It keeps going down and I end up being wrong SO BE IT. If it goes up from here then you can thank me later by buying me a coffee with your profits. But no Starbucks coffee please. I don't consider that coffee, more like road tar. Carry on recruits.

To the Moon?In the worst-case scenario, we will hit all-time high territory for Tesla. We broke the resistance already, and the price is surfing moving averages respectfully. I bought plenty.

TSLA Break Volume profile + Lift High Lift LowFrom the TSLA image
1.) Decided to enter last Friday. Try measuring the Volume profile from the highest price to the present to see when there is frequent trading. It turns out that, hey, it has established a base.
2.) Looking at the pattern, it looks like a Triple bottom and seems to break through the Volume profile resistance and resistance line.
3.) Like the latest graph on Friday, it will be a High and Low lift.
So I guess it's either a Shoot or a Lose, with a Stop loss at the Low that was lifted up.

TSLA: Big Cup & Handle? Over $300 Soon?Big cup and handle? I feel like NASDAQ:TSLA has so much potential here. Ready for a break out of this handle.
I have long calls for 5/16.
Looking for over 295 to possibly 300? Then big move to $324?

TSLA: Moved like a Hulk. Forming another Wedge? RoboTaxi soon?Liking how NASDAQ:TSLA has been moving. Lot of momentum and strength.
Looks like it’s forming another loaded wedge. Maybe a break upside?
Calls: Green ray at 319.77
Puts: Green ray 315.55
Data as well tomorrow. CPI!
NFA. Do your DD!

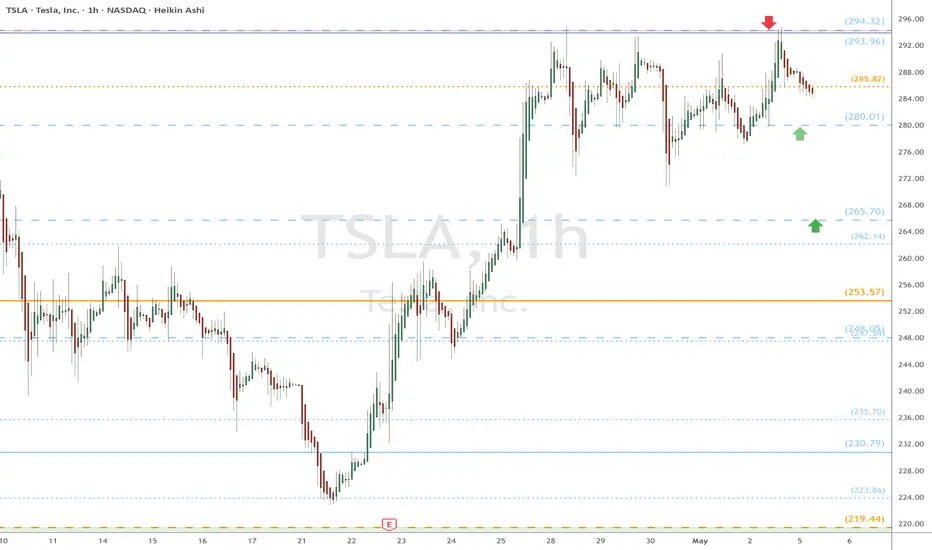
TSLA eyes on $294: Proven Resistance that bulls MUST break NOW TSLA back to a critical double fib resistance $293.96-294.32
Bulls MUST break and retest this as support and do it right now.
Any weakness could give a dip to fibs below at $280.01 or 265.70
Tesla - The Next 7 Days Decide Everything!Tesla ( NASDAQ:TSLA ) is sitting at a crucial structure:
Click chart above to see the detailed analysis👆🏻
Despite the -60% correction which we have been seeing over the past couple of months, Tesla still continuously validates its overall uptrend. That's exactly the reason for my strong bullish thesis and the assumption, that after we see bullish confirmation, Tesla will reject the current support area.
Levels to watch: $250, $400
Keep your long term vision,
Philip (BasicTrading)

TSLA – Is the Rally Just Getting Started? Updated Trade Setup Tesla (TSLA) just lit up the board with a +7% breakout, smashing past key resistance.
Currently trading around $318, this move isn’t just noise, it’s backed by rising volume and a bullish macro environment favoring growth stocks and innovation plays.
🟢 Potential Entry Zones (on dip or continuation):
• $312–$318 → Pullback entry near breakout zone
• $290 → Retest of previous resistance, now support
• $260
💰 Profit Targets (Swing Outlook):
• TP1: $335 – short-term resistance from previous highs
• TP2: $355 – psychological level + extension target
• TP3: $390+ – if breakout trend accelerates into Q2 earnings
💡 Why TSLA?
• Massive volume surge confirms institutional interest
• FSD, AI & Dojo projects keep optionality wide open
• Solid balance sheet in a tightening rate environment
• Global EV growth still in early innings
• Technical breakout above multi-week range
This setup is about riding momentum, not guessing bottoms. If the market holds, TSLA could be on a new leg up — but it’s crucial to manage risk and avoid FOMO entries.
⚠️ Disclaimer: This is not financial advice. Just sharing my personal analysis and trade plan. Always do your own research and trade responsibly.
📊 Follow for more real swing setups, breakout trades, and raw trading psychology.
This isn’t hype — it’s structure. Let’s stay sharp. 🔍📈

Swing Trade Plan for TSLA (as of $285)TSLA has rallied from its previous consolidation zone and is approaching a potential resistance area between $290–$295. Momentum is solid, but RSI and volume trends may suggest we’re nearing short-term exhaustion.
✅ Strategy 1: Wait for the Pullback (Safer Play)
Entry zone:
• $240 – Ideal level near former resistance turned support
• $215 – Strong support with higher reward potential
Stop-loss:
• Below $200 (to protect against deeper trend reversal)
Profit targets:
• $265 – Conservative
• $290 – Re-test zone
• $355 – Bullish breakout continuation (if sentiment remains strong)
This setup gives room for the price to breathe and positions you after a healthy correction.
⚡️ Strategy 2: Momentum Breakout Trade (Aggressive)
Entry:
• On breakout above $295 with volume confirmation
Stop-loss:
• Below $280 (tight, breakout failure protection)
Target:
• $320, $340+, depending on follow-through
This is higher risk, higher reward — you’re betting on bulls continuing the charge without a pullback.
⚠️ Disclaimer: This is not financial advice. Trading involves risk. Always do your own analysis and trade with proper risk management.

TSLA LONG ~ All the technicals are there!TSLA will still hit $2600 ~ Says Cathie Wood
Will it? Let's take a look ~
ELON is pissing people off and investors are worried, Tarrif FUD, brand deterioration.
All of this doesn't matter
Why?
Pull up TSLA YoY earnings since 2013 and you will see that their revenue growth is outrageous, this past year is really the very first time TSLA flat lined, but holding at 25B revenue.
From a technical analysis since 2013 on the LOG chart, you can see TSLA has done a 10x rally twice, and has held strong support through it's bear cycles. The next it due by 2027.
TSLA has been uptrend for over a year, and broke it's ATH 6 months ago.
Voluming is rising in the longterm
and literally the conservatives love him,
If you think competitors are nipping at their heels think again. The infrastracture that Elon has built with his mega factories, and their positioning in the market is so insane other's don't even come close.
On the short term,
The FUD will wash away,
TSLA is finding support at the bottom of the channel,
shorterm volume is waning on the sell offs,
Shorts will get squeezed by end of June,
and Up and UP TSLA will continue.
BTFD!

TSLA Bullish Price Movement. Price has broken a long term trendline and came to retest and then advanced higher. Expecting price to continue advancing higher.

TSLA LongTSLA Long
Current demand Zone (218) confirmed,
Sell put below next two demand
Long entry 225
no Stop
Target 300
Risk management is much more important than a good entry point.
I am not a PRO trader.
In my trading plan, the Max Risk of each short term trade should be less than 1% of an account.

Trading Journal $TSLAUnfortunately a 1/2 position instead of a full position.
Selling into strength on 1/2 position
Market gapped up.. US CHINA Deal..
AMEX:SPY and NASDAQ:QQQ are way extended now above the 50day MA .. needs time for market to digest their gains
so this could pull back with it

$TSLA – Base Breakout Setup with Dual Entry StrategyTesla ( NASDAQ:TSLA ) is coiling up, forming a classic base breakout setup with a dual approach for traders who want precision:
🔹 Support Zone Entry (280-285)
Shaded area = the zone between the 9 EMA (blue) and 20 EMA (yellow) — a key dynamic support area.
I'm taking a starter position here with a stop just below yesterday's low for tight risk control.
🔹 Breakout Confirmation (Above 295)
Full size only if we see a clean breakout above $295, confirming momentum.
This is where I’ll add size, looking for a strong continuation.
🔹 Execution Plan
Starter position: Shares and options at support zone ($280-$285).
Full position: Add at breakout ($295) with a mix of shares and options.
Risk: Tight stop below yesterday's low for the starter position.
⚠️ Risk Management: Always respect your stops — discipline over hope.
