Tesla is AI, Robotics company. Here is data for $6000 by 2032Hey, what's up, traders, investors and Elon Haters.
I know a $6000 will might sound controversial, and it will be hard to agree with Elon Haters. But before you put your hate on here, read the data. My goal is not to convince you or prove to you that you should invest. All these predictions can go wrong. Investing has happened many times in history, and big companies have gone bankrupt. Although many are calling this for Tesla. I don't think it's gonna happen.
📍Let's start with the fact that Tesla is not a Car company anymore, as many still value it this way.
If you look at their products and the revenue, it's broadly changing. In 2026, less than 50% income will be from the Auto business.
🧪Tesla represents a multifaceted technology powerhouse extending well beyond EVs. Its leadership in AI, Robotics and integrated hardware-software systems, alongside its unmatched margins. They are a long-term innovator in clean energy and autonomy.
🧪The business model integrates 4 colliding S-curves, which will revolutionise transportation safety and efficiency and transform industrial automation.
1) Electric Vehicles
2) Energy Storage Solutions
3) FSD / Robotaxi
4) Robotics - Humanoids
📍The first 2 in the list above are pretty much becoming the same as their Auto business and it will overextend in the next years.
📍Now let's add potential revenue from the Robotaxi. It will enormously overtake all of those
You might be wondering how? Or thinking about competitors. In fact, there is no competitor; every other company which is in this business need suppliers for servicing the cars. Tesla creates everything by itself autonomously. Their cost per mile will be the cheapest on the market in comparison with Waymo, Uber some calculations show that it can be even cheaper than driving your own car.
📍Now let's add potential revenue from Optimus.
You can see its multiple times bigger than everything. Humanoids are a 50 trillion dollar business. Why? The world is short of workers and declining birth rate. The world needs workers. The first use case for humanoids will be manufacturing, they are the best way to supplement all of that.
📍What if that doesn't play out?
All of this is still just predictions, and anything can happen. In the chart below, Cern Basher (find him on X) shows how the probability of potential business affects stock prices.
Watch the top lines. Autos, Energy, and Storage are playing out. But what if Tesla makes only 10% of the Robotaxi and Optimus, and completely fails in AI? What would be the stock price?
If Tesla completely fails in Robotaxi and Optimus and delivers only 10% of the projected stock price still can reach $3590. Which is still not bad, right?
📍But if everything plays out as projected, here is the potential revenue from Optimus.
📍Optimums will not only replace workers but also save a lot of costs for the companies
Elon Musk: This year, we will hopefully be able to make about $5000 in Optimus Robots. We are technically aiming for enough parts to make 10,000 to 12,000. But since it's a totally new product, everything is totally new, I'll say we're succeeding if we get to half of the 10,000.
Here is what it could mean for the stock price. Because I'm mainly a technical trader, not a fundamental and data expert, I like to use data from analysts and experts on Tesla.
Note: it's price projections, not predictions.
🎯 Cern Basher approx 7K by 2032
🎯 James - InvestAnswer - $6500 by 2032
🎯 When to buy?
First of all, you need to decide if you want to trade or if you are an investor. For a trade, there was a perfect technical setup at $200 which I posted around a month ago and was hated for that. Because many people are influenced by the media.
As an investor with a long-term horizon, you don't need to find a perfect entry or timing. You don't use leverage and have your long-term vision. I have been buying at $150, I bought at $450, and I bought big time again around $215, and I will buy on Monday at $350 and in future I will buy at $1000 again.
My strategy is to split profits from short-term trading into long-term investments - BTC and Tesla.
The Robotics, Autonomous Driving, and AI are disruptive technologies and S curves playing at the same time. The biggest revolution in human history is going on now. Tesla could potentially be part of it, and if all works as projected. Tesla will be bigger than the top 5 companies on the Nasdaq Combined.
David Perk
Looking for constructive discussions and opinions.
TSLACL trade ideas

Tesla Inc. Stocks & Crypto: We Are All One!What one does, the rest follows.
Tesla (TSLA) hit bottom in January 2023. It has been moving within a rising channel, higher highs and higher lows since.
Volume was moving down until December 2024. The drop in volume was the preparation for a correction. Volume has been rising and 7-April 2025 produced the highest volume since February 2023.
Here is the thing, when the highest buying came in February 2023, it was the start of this major bullish dynamic, the rising channel. Now volume starts to rise again after a major low (a higher low by the way). This means that we are set to experience another phase of growth, reaching new highs compared to December 2024 and in December TSLA produced its All-Time High. This means that the current bullish wave, brand new, will end in a new ATH in a matter of months. Isn't that great?
Knowing that Tesla is growing and set to continue growing, we know that all related markets or those that have a positive correlation with this one will also grow; What one does, the rest follows.
Thanks a lot for your continued support.
Namaste.

Tesla at a Tipping Point – Bear Market Rally or Final Push?The chart of Tesla Inc. (TSLA) on the daily timeframe shows a potential major top formation and subsequent range-bound consolidation, hinting at possible exhaustion. Let's break it down technically:
1. Topping Zone (Marked Purple Box)
This upper zone (~$380–$460) represents a distribution area:
Volume: Notice the volume declines slightly during the uptrend, suggesting weakening conviction on the rally. Followed by increased red bars during the drop – classic distribution.
Price Action: A blow-off move to the top followed by lower highs. This indicates buyer exhaustion.
2. Consolidation Range (Marked Yellow Box)
After the drop, TSLA enters a range between ~$240 and ~$350:
This is a classic bear flag / rectangle, and often follows a top pattern.
It looks like lower highs and higher lows are forming, but price has just returned to the upper end of the range.
We're now testing the upper resistance ($360), which is a decision point for either breakout or rejection.
Conclusions
Current volume remains muted during the recovery, which is not bullish. A true uptrend needs rising volume. Volume pattern supports a “bear market rally” narrative.
If we pull a Fib from the top (~$460) to the bottom (~$240):
The current level (~$342) aligns closely with the 61.8% retracement, a classic reversal zone in downtrends.
Strong resistance is expected around this area.
Moving Averages (50D & 200D):
The 50-day MA is curving up from below, and price might be hitting resistance.
The 200-day MA is overhead, it creates a death cross scenario in past data.
🔔 Summary – Are We at a Top?
Yes, this looks like a potential short-term top within a broader bearish context.

MicroStrategy buy gold pair trade I want to fair trade microstrategy and Tesla. I want a chart so I can see when to buy Tesla and sell micro strategy in conversely sell microstrategy and by Tesla shares

$TSLA KEY Fibonacci Updates Long from 250 NAILED ITWe went long at 250 and NAILED IT
However, WATCH the GOLDEN ZONE short starting at 350 for a potential stall or retracement
I will be looking to add on ALL DIPS!
DROP A LIKE for live updates!

TSLA long levels 1st target 363 & 2nd target open daily gap 401TSLA long levels 1st target 363 & 2nd target open daily gap 401

$TSLA Weekly Chart Analysis🚀 NASDAQ:TSLA Weekly Chart Analysis
🔹 Strong Momentum: Launching off the volume shelf and cruising with the market’s bullish energy.
🔹 Room to Run: Approaching the red barrier, but not there yet—still has upside before a pullback.
🔹 Healthy RSI: Sitting at 56.60, meaning plenty of room for further gains.
🔹 Catalyst Ahead: Robotaxi event incoming! (Sell the news? You bought the rumor. 🤔)
🔹 Key Resistance: Watch levels at $350–$400.
Stay sharp—let’s see if TSLA keeps charging forward! ⚡📈

Tesla The Power of Candlesticks in Action!
On this Tesla (TSLA) chart, we’ve spotted two bullish candlestick patterns—but will they spark upside momentum? 📈
Will buyers step in on this signal, or is there more downside ahead? 🤔
From Bitcoin, we’ve seen that demand can be created even without a physical product—will TSLA follow the same psychology? Let’s watch how price reacts! 🚀📊
#Tesla #StockMarket #CandlestickPatterns #Trading #BullishOrBearish

Tesla rebounds after 55% grash, can it keep climbing?Tesla stock is bouncing back after a rough start to 2025. Following 58 days of sideways trading, a breakout has triggered a 27% move. What is next and is too late to trade?
This content is not directed to residents of the EU or UK. Any opinions, news, research, analyses, prices or other information contained on this website is provided as general market commentary and does not constitute investment advice. ThinkMarkets will not accept liability for any loss or damage including, without limitation, to any loss of profit which may arise directly or indirectly from use of or reliance on such information.

$TSLA approaching a good area for shortAs tesla approaches the 50% mark of 4hr structure look to take shorts. 1st target can be 327ish depending on candle closes we might be able to take lower to 310 then maybe 300.

TESLA LOOKS REALLY GOOD FOR THE NEXT 3 YEARS FROM HEREIn this video, I talk about how the next 2 to 3 years look super bright for Tesla stock's future, and even how the next 6 to 12 months could play out


Tesla Bullish, Let Me ExplainYesterday's high was the highest price since 4-March 2025, almost two months ago. The fact that TSLA moved out of bottom prices and strong long-term support zone while challenging resistance is a bullish signal.
The prices that were activated in Mach and April as support is the same range that TSLA used back in 2024 to launch the previous bullish wave. The same prices as in October and September 2024. The same levels were activated but as a higher low. Clearly a bullish dynamic.
For this setup to be bearish, the action would have to go lower and print a lower low compared to August 2024, this isn't the case. We have a strong higher low which means that buyers were eager to enter the market and waiting for this long-term support zone to be activated. As soon as it was activated buyers showed up and this is confirmed by current price action. Short-term, Tesla is moving up.
This is short-term because a new bullish wave is just now getting started but the fact is pointing towards additional growth.
Yesterday TSLA closed above EMA55 daily for the first after hitting support since October 2024. Once EMA55 gets challenged and conquered, we are looking at the least 2-3 months of bullish action. Don't get me wrong, there can be swings short-term, shakeouts and such but no new lows. The low has been set 7-April 2025, from this point on, we will see growth.
Once a strong resistance level is challenged, we can look at the chart and see if there will be a major correction or just a retrace before additional growth. The truth is that the stock market is set to go higher, TSLA is just one stock. The SPX, NVDA, Bitcoin and many other instruments will grow. Everything will grow.
Namaste.

Looks like a reversal to the high 200sWith OB oscillators, and reversal pattern, this is very likely to retrace from here and fill some gaps along the way.

Looking at a clear direction down to around 290Specifically the quick moving 10%+ plus the Friday from before has left many open areas to target, especially as the OB levels are at a head. This isn't short of anything more than a bear reversal, no pun intended.

Tesla Wave Analysis – 13 May 2025- Tesla broke resistance area
- Likely to rise to resistance level 360.00
Tesla recently broke the resistance area between the round resistance level 300.00 (which stopped the previous waves 4 and (1)) and the 38.2% Fibonacci correction of the downward impulse (C) from January.
The breakout of this resistance area accelerated the active medium-term impulse wave (3) from the end of April.
Tesla can be expected to rise to the next resistance level 360.00, top of the previous wave 2 from February and the target price for the completion of the active impulse wave (3).

TSLA bottom on Weekly chartI am calling a temporary bottom on TSLA stock due to Ichimoku cloud support on the Weekly chart. Ignore the bad news and all the other things going on. Price is everything. Stop losses should be placed below the cloud support. If It keeps going down and I end up being wrong SO BE IT. If it goes up from here then you can thank me later by buying me a coffee with your profits. But no Starbucks coffee please. I don't consider that coffee, more like road tar. Carry on recruits.

To the Moon?In the worst-case scenario, we will hit all-time high territory for Tesla. We broke the resistance already, and the price is surfing moving averages respectfully. I bought plenty.

TSLA Break Volume profile + Lift High Lift LowFrom the TSLA image
1.) Decided to enter last Friday. Try measuring the Volume profile from the highest price to the present to see when there is frequent trading. It turns out that, hey, it has established a base.
2.) Looking at the pattern, it looks like a Triple bottom and seems to break through the Volume profile resistance and resistance line.
3.) Like the latest graph on Friday, it will be a High and Low lift.
So I guess it's either a Shoot or a Lose, with a Stop loss at the Low that was lifted up.

TSLA: Big Cup & Handle? Over $300 Soon?Big cup and handle? I feel like NASDAQ:TSLA has so much potential here. Ready for a break out of this handle.
I have long calls for 5/16.
Looking for over 295 to possibly 300? Then big move to $324?

TSLA: Moved like a Hulk. Forming another Wedge? RoboTaxi soon?Liking how NASDAQ:TSLA has been moving. Lot of momentum and strength.
Looks like it’s forming another loaded wedge. Maybe a break upside?
Calls: Green ray at 319.77
Puts: Green ray 315.55
Data as well tomorrow. CPI!
NFA. Do your DD!

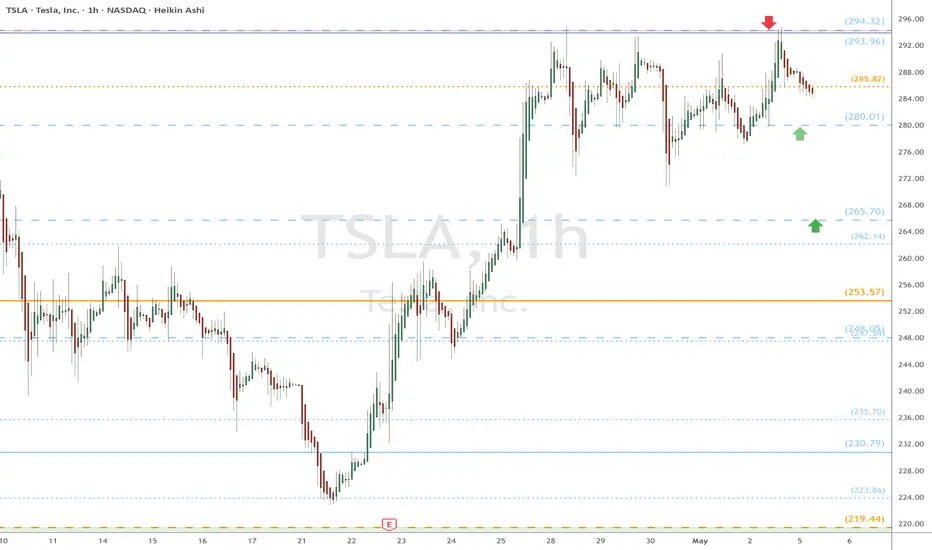
TSLA eyes on $294: Proven Resistance that bulls MUST break NOW TSLA back to a critical double fib resistance $293.96-294.32
Bulls MUST break and retest this as support and do it right now.
Any weakness could give a dip to fibs below at $280.01 or 265.70
Tesla - The Next 7 Days Decide Everything!Tesla ( NASDAQ:TSLA ) is sitting at a crucial structure:
Click chart above to see the detailed analysis👆🏻
Despite the -60% correction which we have been seeing over the past couple of months, Tesla still continuously validates its overall uptrend. That's exactly the reason for my strong bullish thesis and the assumption, that after we see bullish confirmation, Tesla will reject the current support area.
Levels to watch: $250, $400
Keep your long term vision,
Philip (BasicTrading)
