TSLA VolanX Earnings Strategy: Short-Term Bearish Bias (TEST)🧠 VolanX Earnings Strategy: Short-Term Bearish Bias
🎯 Goal:
Capitalize on downside or neutral reaction to earnings with defined risk and IV crush protection.
🔻 Primary Trade: Bear Put Spread
Strategy: Buy Put at ATM, Sell Put at lower strike
Expiration: July 25, 2025
Structure:
Buy 330 Put
Sell 315 Put
Max Risk: Premium paid (e.g., $5–6 per spread)
Max Profit: ~$15 if TSLA closes ≤ 315
Breakeven: ~$325
📈 Why This Works:
Aligns with DSS projection ($317.74 30-day)
Short expiry captures earnings move + IV crush
Profits if stock stays below ~325 post-earnings
🟨 Alternative Trade: Neutral-to-Bearish Iron Condor
If expecting rangebound post-earnings:
Sell 340 Call / Buy 345 Call
Sell 315 Put / Buy 310 Put
Credit: ~$3.50–4.00
Max Risk: ~$1.50–2.00
Profit Zone: 315–340
Best if TSLA volatility collapses and price stays in a channel.
🧨 High-Risk, High-Reward: Put Ratio Backspread
Buy 2x 320 Puts
Sell 1x 330 Put
Cost: Small debit or credit
Profit: If TSLA tanks → big delta gain
Risk: Small near expiry if TSLA closes near 320–330
Use this only if expecting a big bearish surprise.
🔧 Risk Management:
Position size = max 1–2% of account
Avoid holding spreads past Jul 25 if IV collapses
Use alerts around 330 / 325 / 317.5 for exits
🧠 DSS-Backed Tagline:
"With DSS projecting a controlled pullback and flow confirming overhead hedging, we favor bearish verticals and vol crush plays going into earnings."
TSLACL trade ideas

$TSLA Bad earnings reactionI was lucky to sell before earnings. Rebuying here. NASDAQ:TSLA had a bad earnings reaction, but otm calls getting bought at the open today 8/8 315c @8.3 for $2 million

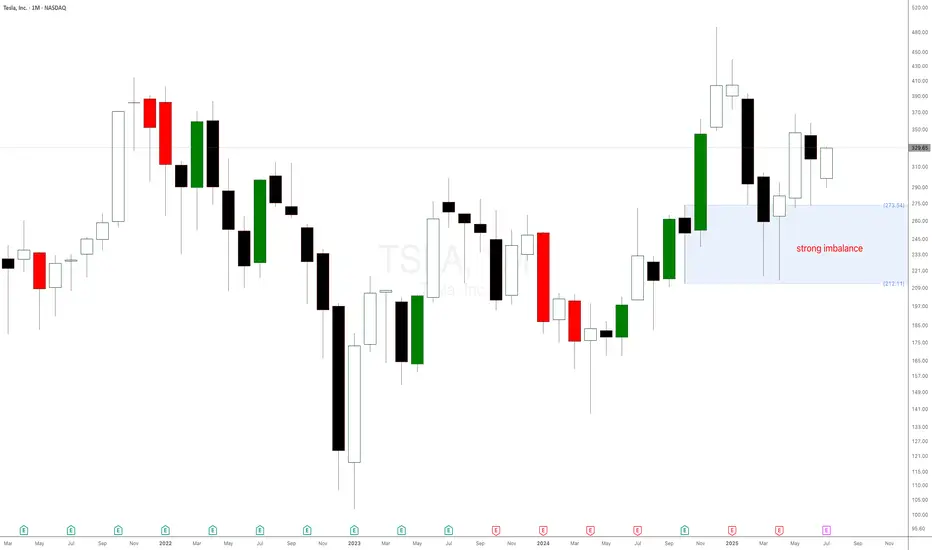
Don’t Listen to Elon Musk – Tesla Stock Chart Tells the REAL StoTesla Stock Set to Break Records: The Power of Monthly and Weekly Demand Imbalances at $273 and $298. Welcome back, traders! In today’s supply and demand breakdown, we’re diving deep into Tesla Inc. (NASDAQ: TSLA) — not from the noisy headlines or what Elon Musk just tweeted, but strictly from raw price action, demand imbalances, and the truth on the charts. Forget the fundamentals, forget the hype, because that’s already been priced in.
This is all about supply and demand, price action, and the power of patience.
The $273 Monthly Demand Imbalance: The Big Fish Made Their Move
A few weeks ago, Tesla stock pulled back to a significant monthly demand imbalance at $273. This level wasn’t just any zone—it was carved out by a strong impulsive move made of large-bodied bullish candlesticks, the kind that only institutions and whales create when they're loading up.
What happened next?
Boom. The market reacted exactly as expected, validating that monthly imbalance and setting the stage for higher prices. This is why we always trust the bigger timeframes—they hold the truth of what the smart money is doing.
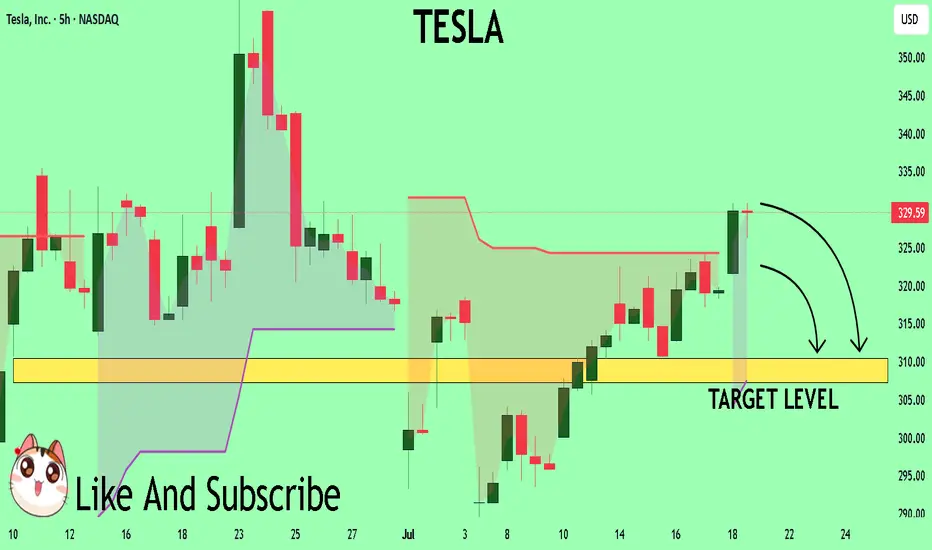
TESLA POST EARNING 24 JULY 2025This is Post earning analysis for Tesla . I have clearly explained all the levels. Please trade carefully & try to stick to your plan.
NOTE: FOLLOW THE LEVELS

Unpack the Range, How to buy TeslaHello, I’m The Cafe Trader.
As part of our MAG 7 series, I’m going to show you how to find good pricing on TSLA for your long-term portfolio.
There’s a lot of hype surrounding Tesla right now — and for good reason. From a long-term investment standpoint, the future looks promising. But we still want to enter at the right price.
In my previous article, I gave TSLA a strong buy at $210–$220, and there were multiple opportunities in that range. But that was a few months ago. Let’s take a look at what the charts are telling us today.
⸻
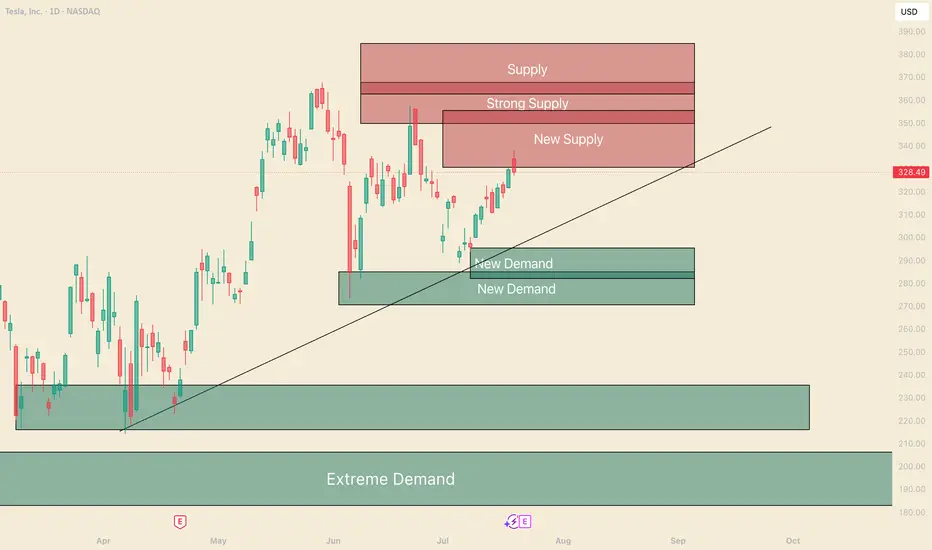
🔲 In the Middle of a Big Range
With a range from $212 to $488, Tesla offers plenty of opportunity for traders — but for investors, it can stir up anxiety.
If you’re holding shares around $330+ and considering selling just to break even, here are three reasons you may want to reconsider:
⸻
1. 🚀 Future Prospects
Tesla is packed with upcoming catalysts:
• Grok AI release
• The highly anticipated Model Q
• Megapack energy storage scaling on an industrial level
These innovations, along with strong brand momentum, could drive the stock 2x, 3x, even 5x over the next few years.
⸻
2. 📈 Trending Up
While some may argue we’re forming a double top, a deeper look at the weekly or monthly chart shows no real signs of weakness. If you’re investing — not just trading — you need that longer-term perspective.
Tesla remains in an uptrend with healthy structure and plenty of strength in the larger timeframes.
⸻
3. 🛡️ Learn to Hedge Your Position
Even if we see 20–30% downside from supply zones, there are ways to protect yourself.
Hedging with options — such as buying puts — can reduce downside risk without selling your shares. If done correctly, you can turn a large drawdown into a smaller loss or even a profit on the hedge.
⚠️ Only do this if you understand how options pricing and time decay work.
⸻
🧠 Passive vs. Aggressive Sellers
Today (July 21st), TSLA tapped into a supply zone and rejected quickly — a sign that sellers are still active around $330, while buyers lack confidence to push through.
🔹 Passive Selling
These are quiet, standing orders — often from large sellers who don’t want to move the market. They sell gradually to avoid spooking buyers.
🔹 Aggressive Selling
This is intentional unloading — where sellers push to exit their position quickly, even at the cost of driving the stock down.
What we saw today looked like passive selling — I’ll cover this in more detail in my short-term TSLA article.
⸻
📊 My Buy Zones for TSLA
Fair Price: $296–$310
• $296 is the top of recent buying liquidity
• $310 is the bottom of the current uptrend
• This is where aggressive buyers may show up if sellers ease off
Good Price: $270–$284
• $284 is a strong support level where reinforced buyers have stepped in
• This has been a hot zone and a likely area for long entries to return
Steal Price: $220–$235
• Not marked on the chart, but this zone is high-demand territory
• Even with bad press or short-term issues, this would be a great long-term value buy
⸻
That's All for TSLA Long Term. Follow and stay tuned for a short term analysis.
@thecafetrader
Tesla Shares (TSLA) Drop Following Earnings ReportTesla Shares (TSLA) Drop Following Earnings Report
Yesterday, after the close of the main trading session on the stock market, Tesla released its quarterly earnings report. While both earnings per share (EPS) and gross profit slightly exceeded analysts’ expectations, the results reflected a negative trend driven by declining sales. This decline is being influenced by intensifying competition from Chinese EV manufacturers as well as Elon Musk’s political activity.
According to Elon Musk:
→ The company is facing “a few tough quarters” due to the withdrawal of electric vehicle incentives in the US;
→ The more affordable Tesla model (mass production expected in the second half of 2025) will resemble the Model Y;
→ By the end of next year, Tesla's financials should become "highly compelling".
Tesla’s share price (TSLA) fell by approximately 4.5% in after-hours trading, clearly reflecting the market’s reaction to the report. Today, the stock is likely to open around the $317 level, down from over $330 just the day before.
Technical Analysis of TSLA Stock Chart
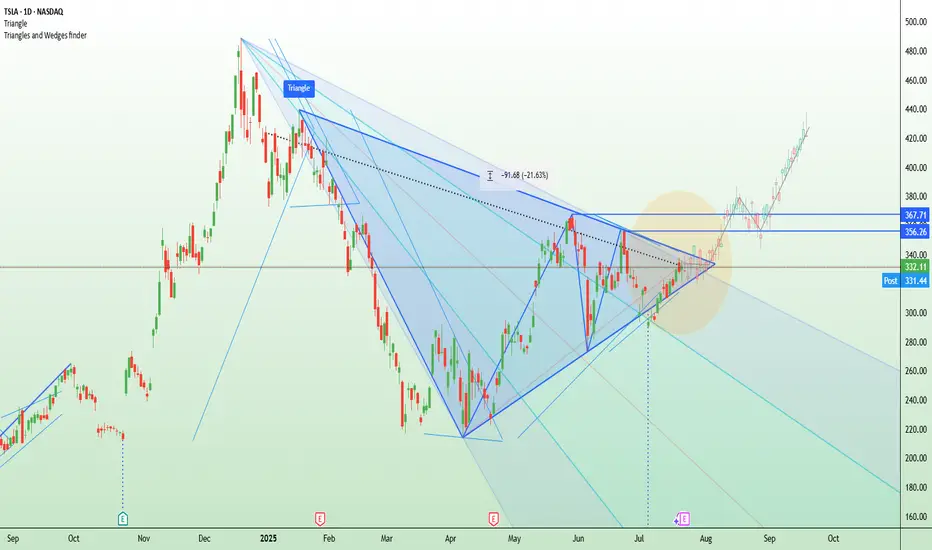
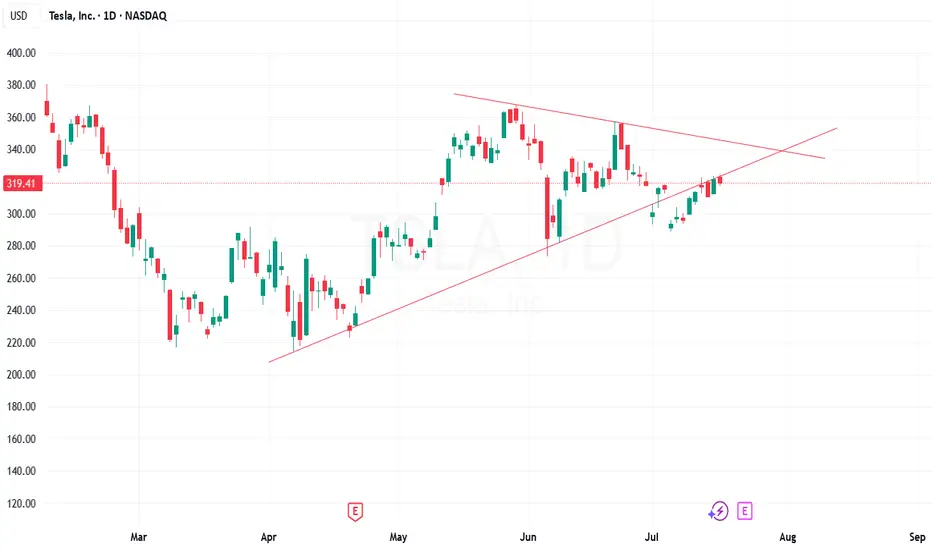
In our analysis of TSLA charts dated 2 July and 8 July, we outlined a scenario in which the stock price could form a broad contracting triangle, with its axis around the $317 level.
The new candlesticks that have appeared on the chart since then have reinforced the relevance of this triangle, as the price rebounded from the lower boundary (as indicated by the arrow) and headed towards the upper boundary. However, yesterday’s earnings report disrupted this upward move.
Thus, while the broader stock market is trending higher (with the S&P 500 reaching a historic high yesterday), TSLA may remain "stuck" in a consolidation phase, fluctuating around the $317 level—at least until new fundamental drivers shift market sentiment.
This article represents the opinion of the Companies operating under the FXOpen brand only. It is not to be construed as an offer, solicitation, or recommendation with respect to products and services provided by the Companies operating under the FXOpen brand, nor is it to be considered financial advice.
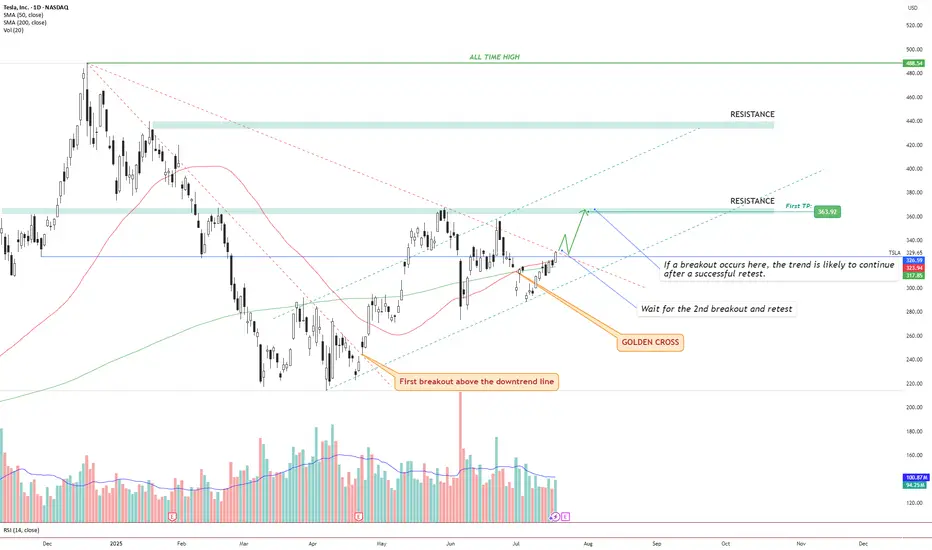
TSLA – Golden Cross + Dual Breakout Structure Targeting $363 andIdea Text:
Tesla NASDAQ:TSLA has recently printed a powerful Golden Cross , where the 50 SMA has crossed above the 200 SMA — signaling a potential long-term bullish shift in trend.
But price action shows more:
We’re observing a dual-breakout structure, where the first breakout above the long-term downtrend line has already occurred (see orange label), and the price is now approaching a critical horizontal resistance zone.
Let’s break it down step-by-step:
🔸 Step 1: Golden Cross
The 50 SMA crossed above 200 SMA — a classic signal for trend reversal. This often attracts institutional interest, especially if followed by breakout confirmation.
🔸 Step 2: First Breakout (Already Confirmed)
Price broke above the descending trendline, retested it, and maintained higher structure. This breakout initiated a shift in market sentiment from bearish to neutral-bullish.
🔸 Step 3: Second Breakout (Setup Forming)
Price is now testing horizontal resistance around $330–$335 zone. This zone also coincides with dynamic resistance from prior failed swing attempts. A successful breakout above this level, followed by a clean retest, can serve as confirmation for a bullish continuation.
🔸 Step 4: Target Setting
🎯 First TP is set at $363.92, a well-defined resistance level. If the breakout holds, next potential targets may develop around key zones such as $395 and $440, depending on price strength and continuation.
🔸 Risk Management
✅ Ideal entry after retest of breakout above ~$335.
❌ Stop-loss below the breakout level or below 50 SMA (~$315 area), depending on entry style.
🔄 Monitor volume: breakout without volume = weak move.
Conclusion:
We are watching a classic price action + moving average confluence setup. Golden Cross, breakout + retest structure, clean resistance level, and defined targets all align.
This setup is valid only with confirmation. No breakout = no trade.
⚠️ Not financial advice. DYOR.
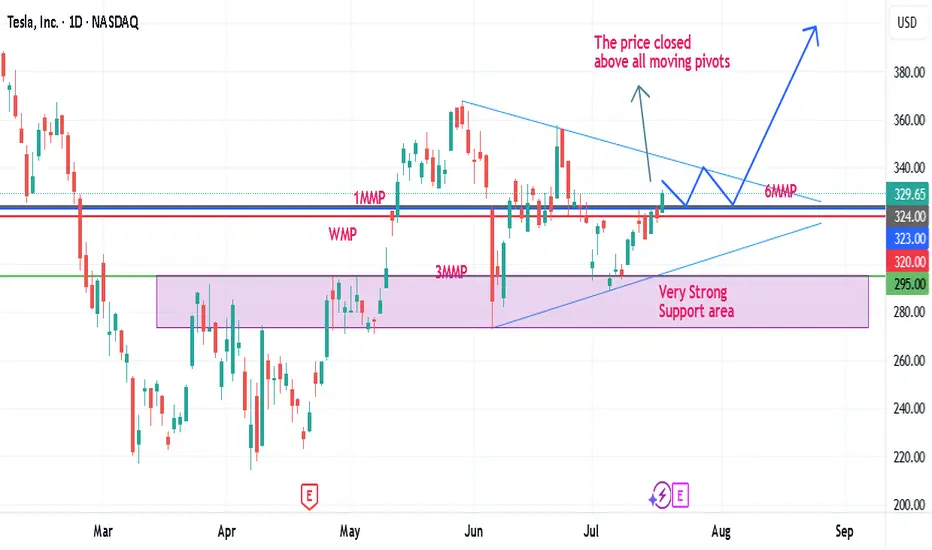
TESLA IS COMPLETELY READY TO SKYROCKET TOWARDS 400$-HERE IS WHYDear traders, based on the daily chart, the price experienced a very important daily as well as weekly close above all its moving pivots, i.e., weekly, monthly, 3 months and 6 months. Besides the price is well above all of its important moving averages supporting by positive 9D, 14D, 20D, 50D and 100D macds as well. These all confirm a great potential for a massive move towards 400$ and beyond in coming days/weeks. The support area is well established between 280-300$ and this area will hold the price for a decisive upward movement. Let's See!
TSLAJust another observation to see if this will play out? I’m not in the market, this just for my own play tracking to see how things work out
Tesla Stock Returns to the $300 ZoneShortly after reporting earnings, Tesla stock fell more than 9% in the final hours of trading. This new bearish move is mainly due to the company’s earnings per share (EPS) of $0.40, which missed expectations of $0.43, and revenue of $22.5 billion, below the projected $22.74 billion. These figures indicate that Tesla failed to meet market expectations, triggering a sustained downward trend in the stock. This move could extend further unless new catalysts emerge to restore investor confidence.
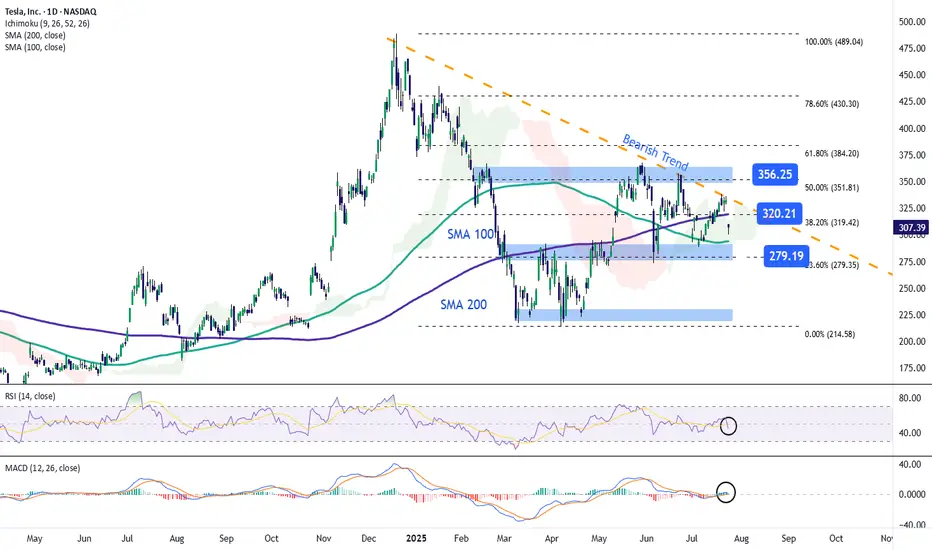
Downtrend Remains Intact
Recent price action has been clearly bearish and continues to reinforce a downtrend that began forming in late December. So far, there has been no significant bullish correction to challenge this structure, making the bearish pattern the dominant technical setup in the short term.
Technical Indicators
RSI: The indicator remains below the neutral 50 level, suggesting that selling momentum continues to build. If the downward path persists, bearish pressure may grow stronger in upcoming sessions.
MACD: The MACD histogram is currently hovering around the zero line, showing signs of technical indecision. However, if it crosses clearly below zero, it would confirm a more sustained bearish momentum.
Key Levels to Watch:
$356 – Major Resistance:
This level corresponds to the 50% Fibonacci retracement. A break above this zone could threaten the current downtrend.
$320 – Nearby Resistance:
Aligned with the 200-period simple moving average and the 38.2% Fibonacci level, a close above this point could reignite bullish sentiment and trigger a short-term upward move.
$280 – Key Support:
This is a critical support level, aligned with the 23.6% Fibonacci retracement. A breakdown here could extend the ongoing bearish trend.
Written by Julian Pineda, CFA – Market Analyst
TSLA squeezes into resistance ahead of earnings Tesla is set to report Q2 earnings after the closing bell on Wednesday, covering the quarter ending June 2025.
The stock has been highly volatile this year, amid concerns about tariffs, Elon Musk’s politics (and nazi salutes), and his public clashes with President Donald Trump.
Tesla bulls Wedbush think, “We are at a 'positive crossroads' in the Tesla story,” suggesting that investors will look past the current numbers and focus on Tesla’s long-term AI potential.
Technically, Tesla is now testing a major descending trendline that’s capped every rally since December. The current price action resembles an ascending triangle pattern — a bullish structure — with resistance around $356 and a series of higher lows from May through July. This tightening formation suggests building pressure ahead of the earnings release.
Retested Wedge Bullish Breakout = New Highs?
NASDAQ:TSLA
NASDAQ:TSLL
Tesla has currently showcased two very bullish setups with one already taking place.
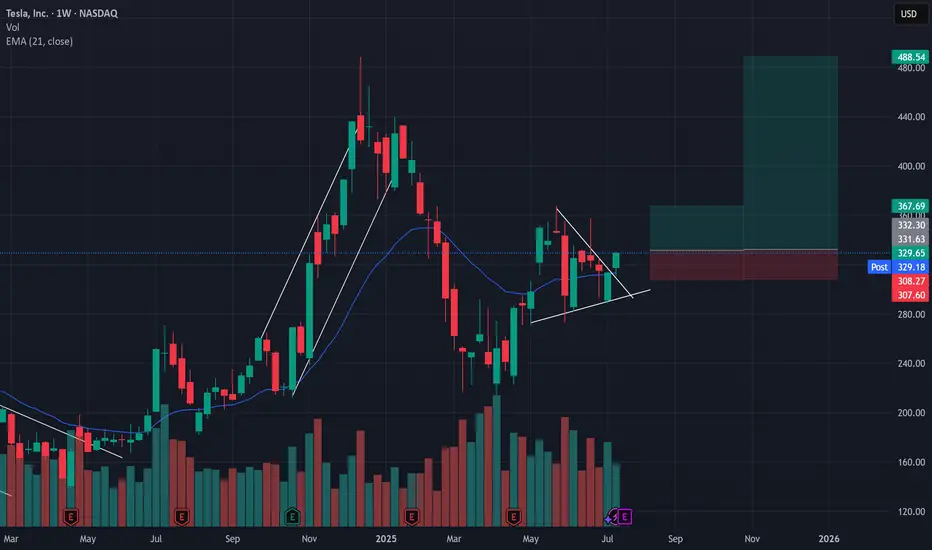
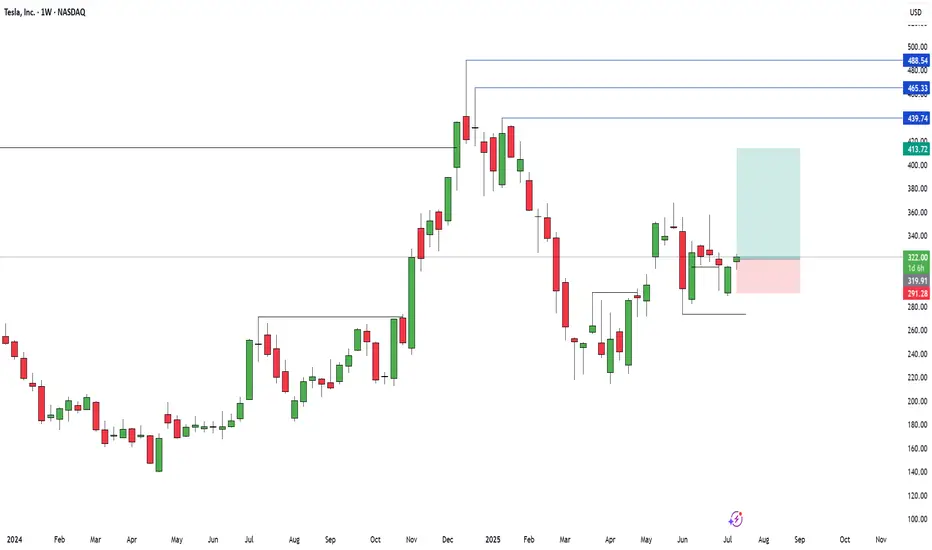
Over the past 2 month we've seen TSLA swing dramatically from a high of $368 to a low of $278 while producing lower highs and higher lows AKA a wedge formation.
Wedge formations are a low probability set up and typically produce a 50/50 breakout, however there are a couple of bullish signals on the weekly chart that have kept me in my TSLL position expecting a retest of either the $368 high and/or $490.
Bullish insights -
1 - After a strong push above the 21d EMA, TSLA had a 2 legged pull back with last week being a short failure and closing above the 21d EMA
2 - this week's candle retested the breakout trendline and closed in a very bullish candle.
3 - Tesla's $488 high was an overshoot which produced a strong breakout to the low end, however there was no new high formed meaning there is a high probability chance that we will revisit ~$500.
Trade set up Idea:
If next week's candle forms higher than this weeks bullish candle, target is $368, Stop loss is set at $306 for a 1:1.5 Risk vs reward.
Or
If next week's candle forms higher than this weeks bullish candle, target is $348, Stop loss is set at $306 for a 1:6.5 Risk vs reward.
I'm holding for the second one ;)
Current position - 7400 shares of TSLL
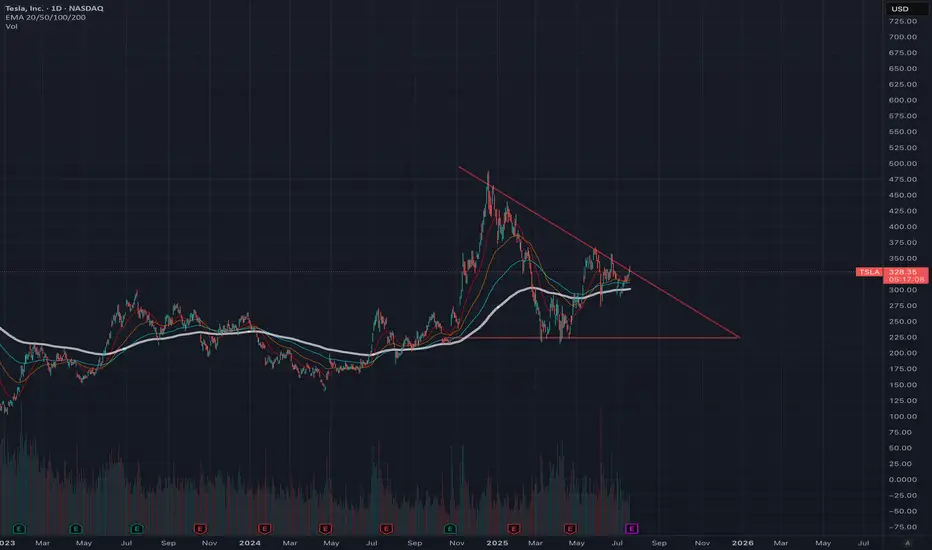
Descending triangle pattern - Major correction possibleAll the recent news regarding Tesla has severely impacted stock confidence. While Tesla's development pipeline appears strong in the short and long term, Elon Musk's politically divisive antics have been difficult to ignore. The EU and the UK, in particular, have been very critical of the CEO and his behavior, causing tensions and reluctance to support Tesla products.
I am confident that this negativity will eventually pass now that Elon has refocused on Tesla and is addressing the fallout; however, it will take some time. Earnings are expected to be affected this quarter and likely next quarter as well. The new Y-model has reportedly not made the significant impact that was anticipated based on media articles/reviews. Although it is a healthy update.
Investing in this stock is a gamble on Tesla's long-term potential, especially regarding both the automated robot taxi aspect and AI development. Personally, I remain very bullish on Tesla's long-term prospects. However, the charts currently tell a concerning story. First, daily trading volume is declining, and there is the formation of a potentially significant descending triangle pattern on the daily chart, which is worrisome. If this pattern breaks to the downside, we could see prices drop into the $136 range or even lower, possibly even to 98 USD.
I plan to set a limit order in the coming weeks within this range, depending on how Apple and other Magnificent Seven stocks perform, as I expect capital to flow from Tesla to those stocks. After all, Tesla has been a profitable stock for a long time, and many holders are currently in profit.
In the short term, I expect Tesla to retest the range of 219 USD and then remain below 295 USD, potentially dropping lower as the pattern completes before re-testing 219, unless a new positive announcement is made. Trade safely..
CUP AND HANDLE $TSLA TO $515 MINIMUMThe cup and handle is a bullish chart pattern commonly used by traders to spot potential buying opportunities. It features a rounded "cup" formation followed by a slight downward drift forming the "handle." This pattern typically signals a continuation of an upward trend once the handle completes its consolidation phase.
ROBOTAXI BOOM
BUY NOW NASDAQ:TSLL NASDAQ:TSLA

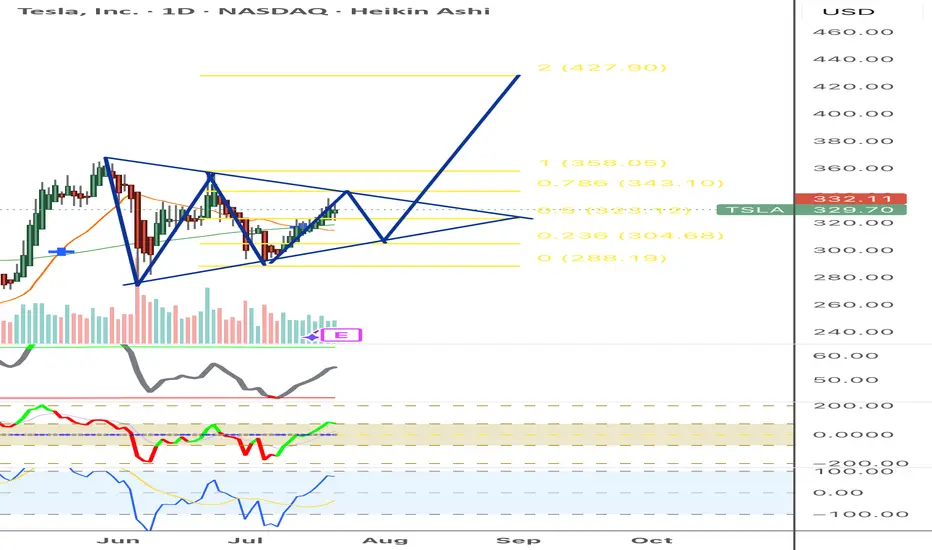
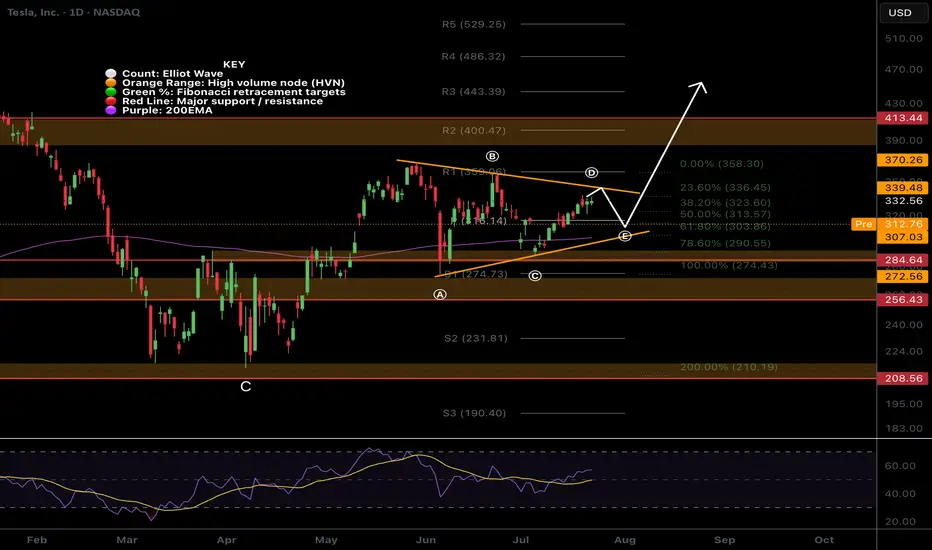
$TSLA Triangle?NASDAQ:TSLA triangle has presented itself with the recent price action. Triangle pattern target is $443 at the R3 daily pivot.
Wave e is expected to end at the daily pivot and wave d break is the signal to go long.
Analysis is invalidated below wave c.
Cup & HANDLE + Mini Double Bottom: $TSLA to $610 ScenarioI maintain a bullish stance on Tesla ( NASDAQ:TSLA ), supported by a compelling combination of technical patterns and strong fundamental drivers. The current chart setup reveals a Cup and Handle formation complemented by a Mini Double Bottom, both of which are classic bullish continuation patterns. These suggest a potential breakout scenario that could drive NASDAQ:TSLA to $610 by year-end.
Technical Roadmap:
Gap Fill to $408: Anticipated earnings momentum, particularly from the Robotaxi segment, is likely to propel the stock to fill the previous gap at $408.
Consolidation at $450: Following the gap fill, I expect a consolidation phase forming a “box” around the $450 level.
Breakout to $610: A decisive breakout above $450 could trigger a strong rally toward the $610 target.
***Current Key Catalysts Supporting the Bullish Thesis:
Robotaxi Expansion: Tesla’s autonomous driving initiative is gaining traction, with Robotaxi developments expected to significantly boost revenue and margins.
India Market Entry: Tesla’s upcoming launch in India opens access to one of the world’s largest and fastest-growing EV markets.
In-House Chip Development & Dojo 2 Expansion: Continued investment in AI infrastructure and custom silicon enhances Tesla’s competitive edge in autonomy and robotics.
Tesla Diner Launch: The near-completion of Tesla’s themed diner adds to brand visibility and customer engagement.
Global EV Adoption: Tesla continues to benefit from rising EV demand across multiple international markets.
Optimus Robot Hype: Growing interest in Tesla’s humanoid robot project could unlock new revenue streams and investor enthusiasm.
Favorable Macro Trends: A declining interest rate environment supports higher valuations for growth stocks like Tesla.
Institutional Accumulation: Recent trading activity suggests that institutional investors are accumulating shares within the current range.
Grok AI Integration: The integration of Grok AI into Tesla vehicles could enhance user experience and differentiate Tesla’s infotainment ecosystem.
Investment Strategy:
I recommend initiating or increasing exposure to NASDAQ:TSLL (leveraged Tesla ETF) ahead of the upcoming earnings report. This could offer amplified returns if the bullish scenario plays out. Consider accumulating further on any dips, particularly during the consolidation phase around $450.
BUY NOW NASDAQ:TSLA NASDAQ:TSLL

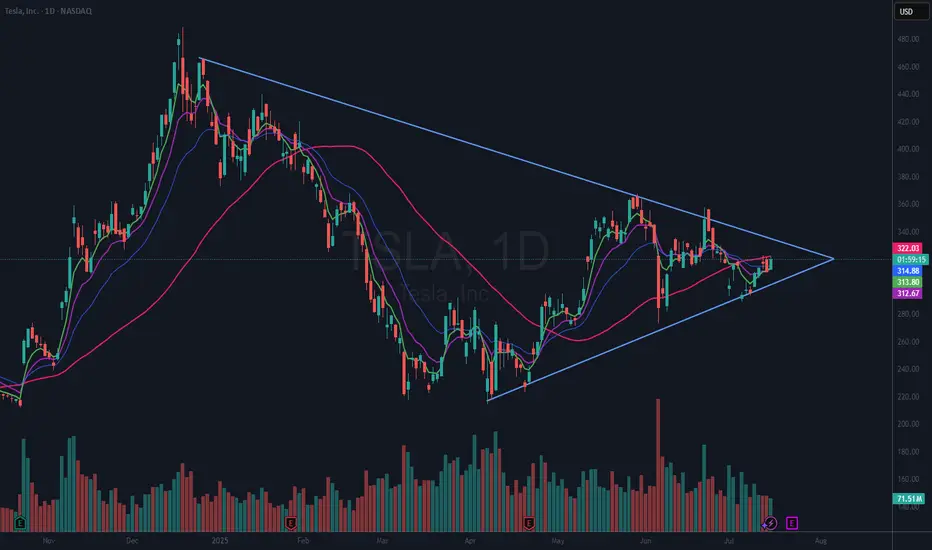
$TSLA Giant Wedging Pattern (VCP)NASDAQ:TSLA is in a giant 7 month wedging pattern. It can be seen as a VCP (Volatility Contraction Pattern) as well. These types of patterns can break either way. However, in this case we have a rising 50 DMA (red). That suggests to me that this will break to the upside.
I already have a small position in TSLA and I will look to add if or when it breaks above the 50 DMA and again if or when it breaks above the upper downtrend line. If it breaks the lower line, I am out.
Be aware that Tesla reports earnings in 7 days, Wednesday, July 23rd, after the bell.
Expected to go in Bearish Mode - Keep watchDaily candle clearly says, retracement from the triangle breakout line completed. It showing as reversal.
Next Volatility Period: Around August 21
Hello, traders.
Please "Follow" to get the latest information quickly.
Have a nice day today.
-------------------------------------
#TSLA
We need to see if it is rising along the rising channel.
The key is whether it can rise with support near 311.48 to break out of the downtrend line.
The key is whether it can rise along the short-term uptrend line and break through the short-term downtrend line after passing through this volatility period around July 25.
Therefore, we need to see whether it can rise above the 347.21-382.40 range with support near 311.48.
The next volatility period is expected to be around August 21.
-
The important thing is to maintain the price above the M-Signal indicator on the 1M chart.
If not, there is a possibility of a long-term downtrend.
Therefore, if it shows support in the 268.07-311.48 range, it is a time to buy.
-
Thank you for reading to the end.
I hope you have a successful trade.
--------------------------------------------------

TSLA Earnings Play (Bearish Bias)
🚨 TSLA Earnings Play (Bearish Bias) 🚨
Earnings Date: July 23, 2025 (AMC)
🧠 Confidence: 75% Bearish | 🎯 Target Move: -10%
⸻
🔍 Key Takeaways:
• 📉 TTM Revenue Growth: -9.2% → EV demand weakness
• 🧾 Margins Under Pressure: Gross 17.7%, Operating 2.5%, Net 6.4%
• ❌ EPS Beat Rate: Only 25% in last 8 quarters
• 🐻 Options Flow: High put volume at $330 strike
• 🧊 Low Volume Drift: Trading above 20/50MA but losing steam
• 📉 Sector Macro: EV competition + cyclical headwinds
⸻
🧨 Earnings Trade Setup:
{
"instrument": "TSLA",
"direction": "put",
"strike": 300,
"expiry": "2025-07-25",
"entry_price": 2.02,
"confidence": 75,
"profit_target": 6.06,
"stop_loss": 1.01,
"entry_timing": "pre_earnings_close",
"expected_move": 7.1,
"iv_rank": 0.75
}
⸻
🛠️ Trade Details:
Parameter Value
🎯 Strike Price $300 PUT
💰 Premium Paid $2.02
📅 Expiry Date 2025-07-25
🛑 Stop Loss $1.01
🚀 Profit Target $6.06
📏 Size 1 Contract
⏱ Entry Timing Pre-Earnings
📊 IV Rank 75%
🕒 Signal Time 7/23 @ 14:14 EDT
⸻
📈 Strategy Notes:
• 🧯 IV Crush Risk: Exit within 2 hours post-earnings
• 🎲 Risk/Reward: 1:3 setup | Max Loss: $202 | Max Gain: $606+
• 🧭 Volume Weakness & put/call skew signal downside
• 🧩 Macro + Tech + Flow Alignment = Tactical bearish play
⸻
🧠 “Not all dips are worth buying — this might be one to short.”
📢 Drop your thoughts — would you take the trade or fade it?

TESLA My Opinion! SELL!
My dear subscribers,
My technical analysis for TESLA is below:
The price is coiling around a solid key level -329.59
Bias - Bearish
Technical Indicators: Pivot Points High anticipates a potential price reversal.
Super trend shows a clear sell, giving a perfect indicators' convergence.
Goal - 310.44
About Used Indicators:
By the very nature of the supertrend indicator, it offers firm support and resistance levels for traders to enter and exit trades. Additionally, it also provides signals for setting stop losses
Disclosure: I am part of Trade Nation's Influencer program and receive a monthly fee for using their TradingView charts in my analysis.
———————————
WISH YOU ALL LUCK
Long entry TSLA - Weekly Time FrameIt seems price failed to make a lower low that reversed the most "immediate" uptrend. Therefore, trying to play the entry against those who went short.
Lets see how it plays ouy
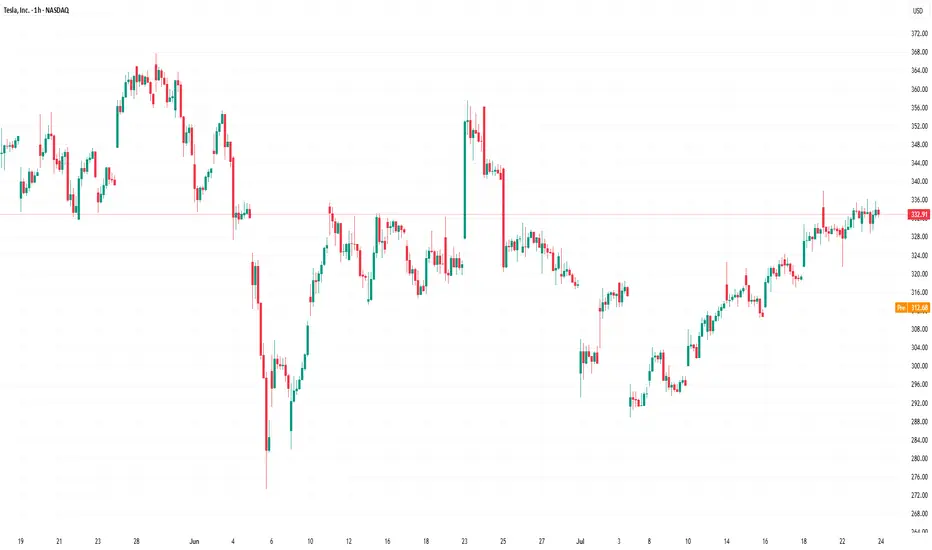
Tesla 1H chart showing room for a 10% upside - Bullish setup This Tesla 1H chart showcases a falling wedge breakout with strong volume support, followed by a steady uptrend. The price has respected a rising support line, with a clean re-entry zone and a defined stoploss for trade protection. As long as the price holds above the trendline, the chart remains bullish with a target around $357.
"Tesla 1H chart showing room for a 10% upside — bullish setup unfolding."
