TSLACL trade ideas
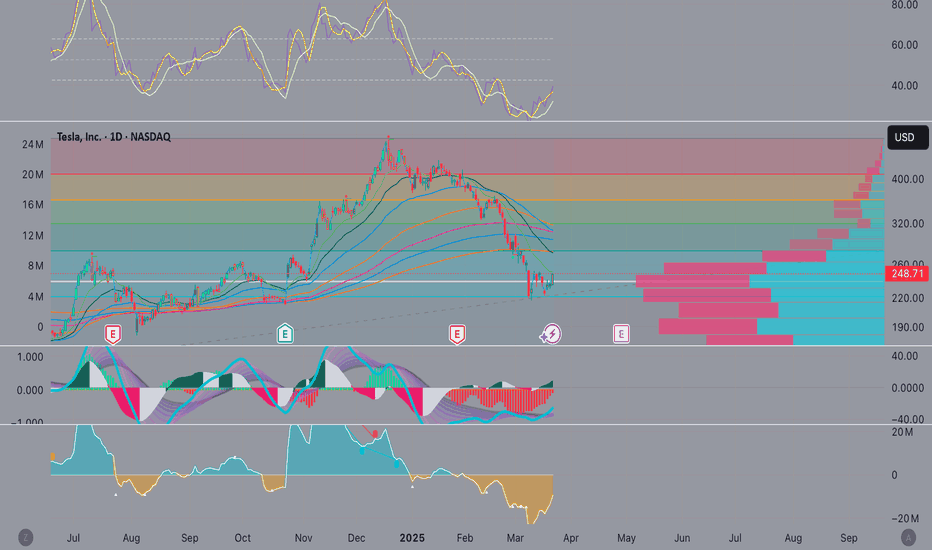
Tesla Approaching Key Support: Potential Long Setup in PlayTesla has recently experienced a strong bearish expansion, retracing toward previous value areas and currently trading below the value area high. It is finding support at a key daily support/resistance (SR) level of $217.
At this stage, Tesla is approaching a potential reversal zone, but for a long trade setup to be confirmed, we need to see consolidation on the daily timeframe, signaling exhaustion of selling pressure.
The next major technical support lies at $176, which aligns with multiple confluences:
1. 0.618 Fibonacci retracement level
2. Daily SR support at $176
3. VWAP (golden line) acting as support
4. Value area low of the previous range
This confluence increases the probability of a reaction in this zone, making it a key area to monitor for a potential long entry.
Trade Execution Considerations:
• Patience is key—we may see a bounce on lower timeframes before Tesla trades toward the $176 entry zone.
• Entry trigger should be established on lower timeframes, confirming bullish structure or a shift in momentum.
• Technical target: The key swing high once bullish confirmation is in place.
Until then, monitoring price action and waiting for confirmation will be crucial before taking a long position.
TESLA Trading Opportunity! SELL!
My dear followers,
I analysed this chart on TESLA and concluded the following:
The market is trading on 249.11 pivot level.
Bias - Bearish
Technical Indicators: Both Super Trend & Pivot HL indicate a highly probable Bearish continuation.
Target - 240.93
About Used Indicators:
A super-trend indicator is plotted on either above or below the closing price to signal a buy or sell. The indicator changes color, based on whether or not you should be buying. If the super-trend indicator moves below the closing price, the indicator turns green, and it signals an entry point or points to buy.
Disclosure: I am part of Trade Nation's Influencer program and receive a monthly fee for using their TradingView charts in my analysis.
———————————
WISH YOU ALL LUCK
Bullish TESLA prediction and bullish theoriesBullish triggers for this event to potenially happen. (I think)
1.If the macro landscape will calm down. (QE/ Lower interest rates / Tariff peace talks)
2.Musk returns to focus on TSLA.
3.Improvements or any new news regarding the optimus robots development.
4.Bitcoin breaking out (to the upside).
5.Retirement funds coming back as investors in TSLA. (Danish funds have left the stock).
6.Peace talks between Russia and Ukraine.
NASDAQ:TSLA
Why I think JP Morgan Predicts a $120 price for Tesla1) The price channel (white) reveals that we’re only halfway to the next major bounce on the daily chart. With boycotts gaining traction and sales projections looking bleak, the stage is set for more downward pressure.
2) Looking back at the last significant downward swing ( purple ) within this channel, history could repeat itself with a drop of similar magnitude. The pattern is hard to ignore.
3) A critical support zone ( green ) lies beneath an unresolved price imbalance, still waiting to be tested. It’s like a magnet pulling the price lower.
4) When you weave these factors together—channel dynamics, past swings, and untouched support—they converge ominously around the $120 mark. Coincidence? I think not...
Let me know what you guys think.
It will be a bumpy ride downhillTesla's fanboys would not like it.
The company is facing turbulent times ahead and is still failing to provide what was promised years ago.
1. The legislators won't approve SDC also known as autonomous cars in the near future, because a human supervision is required. So the robotaxi is just a fiction.
2. Robots development is way behind the competitors. We all see the Boston Dynamics' Atlas, Mercedes-Benz project and some other projects. Comparing the Optimus project with the best out there is non-sense, because it fails on all fronts. Considering NVidia now open-sourced their project and collaboration with Google and Disney, IMO Tesla is out of the robo market now.
3. We see clear signs of a distribution phase at the top, fuelled by a lot of insider sells.
*Support levels are shown on the chart as green boxes. .
It is NOT a TRADING ADVISE .
There is a HIGH RISK of losing money when trading.
TSLA stock might be considered UNSAFE right NOW.
Tesla Wave Analysis – 21 March 2025
- Tesla reversed from support level 220.00
- Likely to rise to resistance level 280.00
Tesla recently reversed up from the support zone surrounding the multi-month support level 220.00 (which has been reversing the price from September).
The upward reversal from the support level 220.00 stopped the previous impulse wave 5 of the intermediate impulse wave (C) from January.
Given the oversold daily Stochastic, Tesla can be expected to rise to the next resistance level 280.00.
$TSLA The Banks Stole My Stonkz..While NASDAQ:TSLA is quite good at manipulating their own shares, there are questions that need to be answered.
It has always been suspected that NASDAQ:TSLA has defrauded their investors and cooked the books. Finally there is evidence. 1.5 Billion missing from their balance sheet!?!?
Given Elon Musk's supreme affection for Hitler and his morbid stupidity, he continues to wage a psychological war against the public by executing high risk marketing ploys that finally bit him in the ass (Zieg Heil). This man should be fired.
None-the less we have technical to discuss here!
As you have seen we called the drip drop from the tippy top and pocket many dollars on this TSLA short. Right now what we are looking at a variety of targets NASDAQ:TSLA will hit one way or the other.
Not only are his own share holders against him, but Donald Trump decided to Implode the Economy and the stock market at a critical stage for his new Crony Musk. It is not a coincidence but all by design.
Last years open is 250.08 and we failed to close above that level today. While we can gap over this level it is more likely since we filled the gap and turned around that NASDAQ:TSLA in prime NASDAQ:TSLA fashion will reject and gap down right soon.
The market maker has left a wide open space to fill that ends at the trendline, thus wiping out all of the longs.
Then the banks foreclose on Musk NASDAQ:TSLA shares and Twitter below 110$ and this social media company will go back into the hands of the Deep State.
Lastly we have a quarterly gap fill and final target where NASDAQ:TSLA will find demand and resurge after Elon ahs been wiped from the face of the Earth around 20$.
With monthly momentum fiercely going negative and CCI breaking fresh into negative momentum territory it is sure to be a daaaaaaaam good show..
Get your popcorn ready boys. He fucked himself.
Tesla ready to bounce - Target 265Tesla formed a baby candle in the weekly. 252 is the previous resistance, but last 2 weeks had good lower wick and slightly bullish closing, indicating not much selling pressure. Price breaking 252 and sustaining shows a bullish reversal with short term target of 265.
The larger trend is still bearish, so I don’t expect another rally, but with Tesla, you never know
TSLA Tesla 24hr potterbox.TSLA Tesla 24hr potterbox. Tesla is above the 50 percent line or cost basis. $229.43ish . it seems to be making small gains and it is making little accomplishments. lol this is just what I see with these potterboxes and other indicators I use to make trades. I usally go out 90 to 120 days. it just depends. I would like to see it make it to the roof $270.38 ish. the floor being 188.27ish. well lets hope it continues this little uptrend. It's $249.83 Ish. as I am writing this, and it could also go lower. This is just my opinion. Happy Trading.
TESLA pricing its long-term bottom. $450 rebound highly likely.Nine months ago (June 26 2024, see chart below), we signaled the start of an enormous rally on Tesla (TSLA), which eventually hit our minimum Target ($400), based on a fractal from 2014 - 2016:
Since the upper 1.382 Fib Target wasn't achieved, the model is readjusted and this count makes better sense. Based on the 1W RSI we are on a bottom similar to October 30 2017 around the 4.0 Time Fib extension. That past sequence initiated a rebound towards the market Resistance before the next decline headed to the 5.0 Fib extension.
As a result, we believe Tesla will find a bottom here and target $450 just below the Resistance level.
-------------------------------------------------------------------------------
** Please LIKE 👍, FOLLOW ✅, SHARE 🙌 and COMMENT ✍ if you enjoy this idea! Also share your ideas and charts in the comments section below! This is best way to keep it relevant, support us, keep the content here free and allow the idea to reach as many people as possible. **
-------------------------------------------------------------------------------
💸💸💸💸💸💸
👇 👇 👇 👇 👇 👇
TESLA - EYES ARE LOCKED! TESLA - We are currently keeping a close eye here on Tesla, being at a key support level and seeing large Bullish Rejections. The market has been crashing for a while now and we've all heard the news regarding Trump investing into the company we can make a safe assumption TESLA will be a safe sturdy stock this year going to make new highs. For a Long Term Investment I would be investing into Tesla now. If you're looking for a swing then Im holding out until we get a break in Trend. This possible swing "could" be a potential 11,000 Point move. Could give you life change returns. EYES ARE LOCKED HERE GUYS! DO NOT MISS OUT
TSLA near-term Elliott wave projections(looks promising)If this is incorrect, i may have to restart learning from the beginning.
And if it does happen, it will happen in a matter of 2-3days time, at the same time get the stop loss ready.
Even if this wave analysis turns out to be completely wrong, we will still manage to find an entry on the uptrend.
Let's go!!
Tesla Near Term SpeculationBuilding on the flag formation from the past 3 years, its possible an rising wedge could form. Very early days and highly speculative, but if price plays out somewhat like my chart, an ascending wedge could form. Indicating that Tesla may have hit a near/mid term high and can't won't break through for a few years, with several implied price crashes going into 2026 and 2027.
Economic conditions and the apparent slow down in sales, would also support the technical analysis with macro fundamentals.
Very curious to see how things play out, again, highly speculative, just wanted to post to remind myself to keep and eye on this. The potential volatility is presenting interesting trades ahead.
TESLA GOLDEN CHART ANALYSISI have analyzed Tesla with price & time square. I have considered Trend , chart pattern & Gann techniques. There is like chance that it will hit the low by 22-April 2025. Tesla is weak in Sales in last quarter. And in this quarter also number will be coming poor. Target is apple. This is for study purpose.
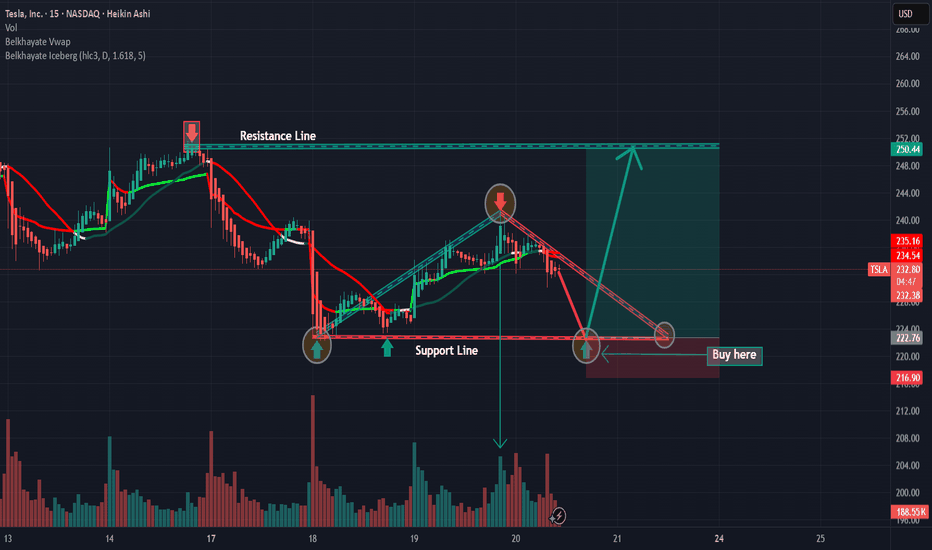
TSLA: Buy opportunityOn TSLA, we have a great opportunity to develop a strong uptrend after the rebound off the support line, as you can see on the chart.
Furthermore, you can strengthen your long position after the breakout of the VWAP and Belkhayate Iceberg.
You should wait until all the analysis conditions are met before entering a position.


