Downtrend breakout at daily Chart
6-month downtrend breakout on Daily Chart
Clear double top reversal pattern at 0.0113 followed by the breakout
Trading near strong support level at 0.0165 that at this moment is acting like a resistence for the comeback after the breakout
Last time we had a double top reversal pattern in a downtrend, we went +50% up in 5 days.
Great entry point here with first target at 0.0222 (+30% gains downside of a 13% SL)
T2 at 0.0294
BEAMXUSDT trade ideas

$BEAM TREND BASIC OVERVIEW
Operating in a downtrend on the daily chart since the end of March 2024.
Broke a strong support at the 0.016 region.
Open avenue all the way down to 0.010 - 0.007.
Waiting for the consolidation of this break:
If it returns to trading above 0.016, buy.
Strong indicator and buy: 0.017 - 0.020.
If it doesn't hold, enter again at 0.007.

BEAMXUSDT.PBEAMXUSDT.P is in reversal mode.
Bearish divergence also shown in RSI.
First LH also made.
We wait and watch for the breakout of last LL.

#BEAMX: 200% Potential Gain Ahead!Hello everyone, I’m Cryptorphic.
I’ve been sharing insightful charts and analysis for the past seven years.
Follow me for:
~ Unbiased analyses on trending altcoins.
~ Identifying altcoins with 10x-50x potential.
~ Futures trade setups.
~ Daily updates on Bitcoin and Ethereum.
~ High time frame (HTF) market bottom and top calls.
~ Short-term market movements.
~ Charts supported by critical fundamentals.
Now, let’s dive into this chart analysis:
BEAMX has recently broken above the resistance trendline and is hovering near our accumulation range between $0.01399 and $0.01698. A retest is likely after a clean breakout above the 50 EMA, which could present a buying opportunity within the accumulation range.
The dotted horizontal lines represent the resistance levels that BEAMX will test as the price rises.
Key levels:
- Confirmation: Breakout above 50EMA & Resistance trendline.
- Accumulation Range: $0.01399-$0.01698.
- Lower Support: $0.01093.
- Primary Resistance: $0.01964.
- Targets: $0.01964, $0.02355, $0.03067, $0.04350.
DYOR, NFA.
Please hit the like button to support my content and share your thoughts in the comment section. Feel free to request any chart analysis you’d like to see!
Thank you!
#PEACE

SHORT BEAMLooking at CoinMarketCap's top losers list you can see that the cryptocurrency by the name of BEAM is present.
Losing over 8% in the last 24hours I still see more downside for this crypto.
BEAM lost 24.52% of its trading volume in the last 24hours.
What Is Beam? (Beam)?
The NASDAQ:BEAM token serves as the native crypto asset for the Beam network, a gaming network empowered by the Merit Circle DAO. Beam is an ecosystem where gamers and developers come together to shape the future of the gaming industry. One of its core components is the Beam SDK, which is a flexible software development kit that enables game developers to choose between a variety of tools that can be used to fuel and structure their in-game blockchain elements.
To interact with Beam, NASDAQ:BEAM is required. This is the native crypto asset used within the Beam network to pay for transactions. This not only includes transfers of assets but also involves all interactions with smart contracts on the Beam network, facilitating a seamless, immersive gaming experience.
Besides functioning as a gas token that fuels the Beam network, NASDAQ:BEAM is the heart of the governance of the Merit Circle DAO. This decentralized autonomous organization (DAO) was brought to live in early 2021 to revolutionize the gaming industry. The NASDAQ:BEAM token allows its holders to participate in governance of this DAO.
Also looking at price performance for BEAM, its current price is 69% below its all time high.
My price point for BEAM is at 0.010325$.
My stoploss is at 0.015348$.
It gives us a 1.89 risk/reward which is a high risk move.

BEAM is showing potentialNASDAQ:BEAM is showing strong potential.
After a period of downtrend, it has now entered a phase of sideways price action, which is likely to form a base at this level.
I have already bought in, and I believe NASDAQ:BEAM could be a game-changing coin for the gaming narrative!

Trade Setup: BEAM Long PositionMarket Context:
BEAM is currently testing the top of the range support level. A break and retest of this zone could provide a strong opportunity to enter a long trade.
Trade Setup:
Entry: Spot trade at the break and retest of the $0.0138 - $0.0140 level.
Take Profit:
First target: $0.019 - $0.021
Second target: $0.029 - $0.0318
Stop Loss: Just below $0.0135.
📊 Wait for confirmation of the break and retest before entering the trade. #BEAM #CryptoTrading #TradeSetup 🎯

BEAM scalp - August scalping journey trade Nr. 6Another setup from the livestream is coming into play. Shorting some BEAM here at the retest of this range. Looking for the imbalances to be filled on the downside. Maybe even going under MDay-Mid but let's see. Important news later on so keep that in mind.
Analysis of the Chart:
Retest of the Range:
The chart shows BEAMUSDT retesting a previously established range. This level acts as a potential resistance where the price might reverse.
Break of Structure (BOS):
Several Breaks of Structure (BOS) indicate where the market sentiment has shifted. These points are crucial in identifying the potential continuation or reversal of the trend.
Imbalances and Fair Value Gaps (FVG):
The price has created imbalances or Fair Value Gaps (FVG) on the way up. These gaps represent areas where the price moved quickly without much trading, often revisited by the price to achieve equilibrium.

BEAM 12h Breaker Support LevelThere's a Bullish Breaker Block on the 12 hour chart that could be major support.
The Bullish Breaker B is at the old range point of control at .018430.
The macro fibonacci retracement creates a zone between the 618 level and the 786 level.
This fib zone sits nicely with the old range from the intitial token release range formed Jan - March 2024.
I believe there's a good chance to find support here. If not then the 786 bottom of the fib zone looks like support number 2.
Targets above would be the Macro global 618 of .021650 and then the Yearly vwap 618 level of .027367 ish.
Notice NAMI (momentum and moneyflow)- indicator on the bottom - looks like we could range a bit before getting a nice move.
Not Ever Financial Advice.

Beamx potential pumpBeamx flash pump potential with 3 price targets. Also Stop loss at 0.53%
This is done using an experimental method. This is not financial advice and it`s for observation.

Beamx chartBeamx chart.
This is done using an experimental method inspired by Da Vinci.
The arches represent bull and bearish trends. Those also represent support and resistance.
In order for the price to go up it needs to be contained in the green trends up. Once those are broken the price tends to dump.
Also the intersection of trends will act as a spring for the price.
This is not financial advice.

$BEAM future doom or gloom?Take a look at $BEAM. Looking for an opportunity to add to my spot bags. Interested to see if it pulls back to a 618 on the one hour. I have heard decent projections for this token from several different crypto guru's. What are your thoughts?

BeamX chartThis is a chart using a method inspired by Da Vinci.
The circles are price targets and also these act like support and resistance trying to contain the price inside until it breaks out on the up side or down side. Also the diagonal lines are trend lines and they act the same.
This is not financial advice.
I can teach the method for those who see the benefit of it.

Beamx chartBeamx chart Price is contained in the yellow sideways cell, that acts as a chop zone. Once the price leaves that area and breaks the blue level it has a chance of going bull to T1. If the price breaks under the yellow cell, the higher chances are that the price will go to T1 bear.
This is done using an experimental method that I developed based on Da Vinci.
This is not financial advice.

BEAMX buy/long setupAfter the heavy drop, it has now broken the trigger line and created a bullish iCH.
There is a support area close below the price, on which we will look for buy/long positions if the price reaches this range.
The targets are clear on the chart.
Closing a daily candle below the invalidation level will cause analysis.
Note that the financial market is risky, so:
Do not enter any position without confirmation and trigger.
Do not enter a position without setting a stop.
Do not enter a position without capital management.
When we reach the first TP, save some profit and try to move the stop continuously in the direction of your profit.
If you have any comments please post them, comments will help us improve our performance
Thanks

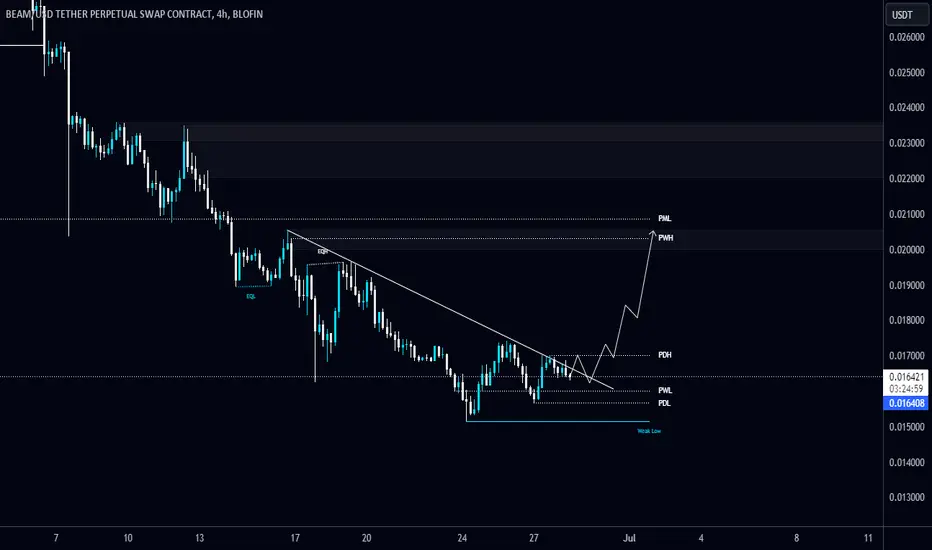
#BEAM/USDT is rejecting from Diagonal Trendline in 4-Hour TF!#BEAM/USDT is rejecting from Diagonal Trendline in 4-Hour TF!
Wait for Trendline breakout to open a long position. NASDAQ:BEAM is holding PWL $0.016 as a support level. The local resistance level is $0.017.
BEAMX 13% UP AND MORE TO GOBEAMX previous trade idea was given and it did 13% pump and more to go from here.

Beamx can do 2x from hereBeamx coin is very best coin to buy now in spot which can go 2x easily from here.

BEAM - trading setupWe're going to try this one on BEAM for a possible short-term scalp. We grabbed the liquidity and surged 80% in just two weeks. We believe the bullish pattern should continue and move higher. This coin is highly volatile, so don't forget to use a hard stop and make sure to take profits on the way up if it hits. 🤝

Long signal for BEAM/USDTThis technical analysis is based on the daily chart of BEAM/USDT on the Bybit exchange. This analysis draws two price channels and evaluates support and resistance levels.
Price Channel Analysis:
The previous bearish channel is broken out, and a bullish channel is formed.
The suggested entry point is around 0.027905 USDT.
Entry and Exit Points:
Entry: 0.027905 USDT
Take Profit: 0.036855 USDT (32.08%)
Stop Loss: 0.025362 USDT (9.10%)
R/R Ratio: 3.53
Conclusion:
This analysis suggests that by adhering to the specified take profit and stop loss levels, a successful trade can be achieved. The Reward/Risk Ratio for this trade is approximately 3.53, indicating a highly favorable risk-to-reward scenario. To manage risk effectively, it is recommended to strictly follow the stop loss level.

BEAMUSDT | SWING TRADE (FALSE BREAK)Yesterday, BEAMUSDT saw the bulls making a bold attempt to break the 8H high with impressive volume, only to face a swift rejection on the second candle—classic false break! Using my trusted false breakout strategy, I set my order at the previous 8H high with a 1.5 ATR, targeting the 4H low.
With the weekend approaching and volume likely to dip, it's a thrilling setup to watch. Will the trade hit the target or hold steady in the low-volume weekend? Stay tuned for the outcome!

I hope this idea is the best I have publish so far,up2 40%profitI hope this opinion is the best I have offered so far, with up to 40% profit.
Through technical indicators, I have suggested three entry points. I admit that I tried to make them two entries, but I could not. Therefore, the suggestion will be to enter in three stages for the medium-term trader. If it's scalping, entering in five stages might be better, between the first and the last.
Exiting in two stages, each stage 40% of the trades. Note that I will keep 20% for the long term.
Remember that this is my opinion and not financial advice at all.

BEAMX LongRejected 3 times from green box previously but finally managed to flip it into support.
Breakout retest of trendline + retest of green box successful.
targets marked.
