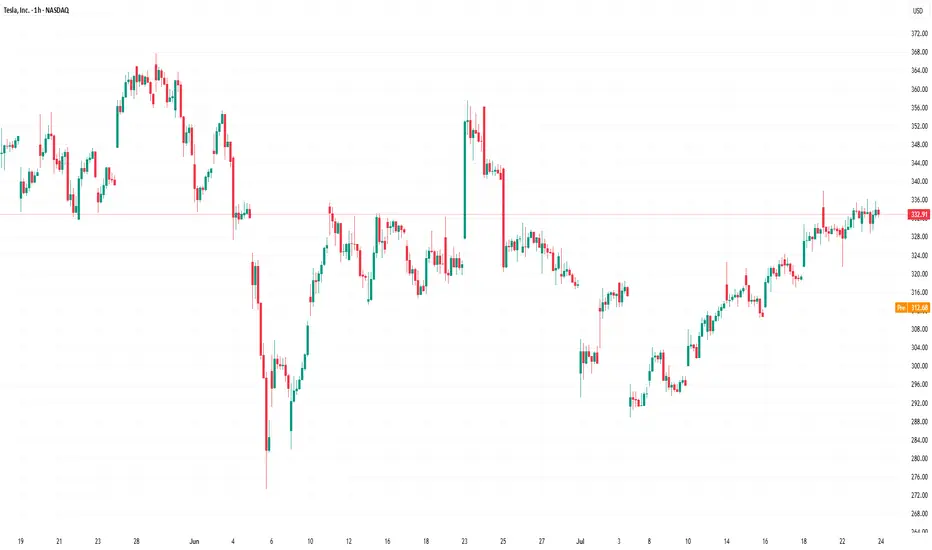
Expected to go in Bearish Mode - Keep watchDaily candle clearly says, retracement from the triangle breakout line completed. It showing as reversal.
TL0 trade ideas
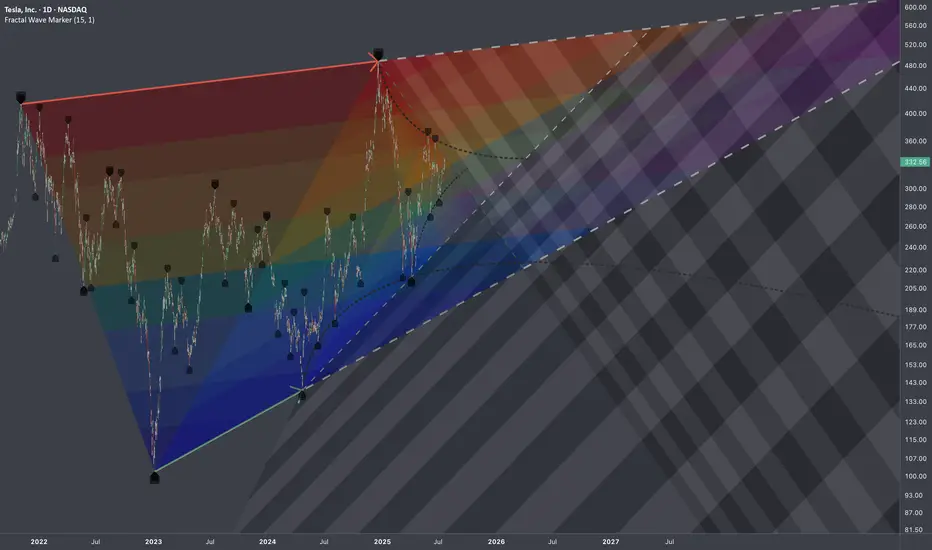
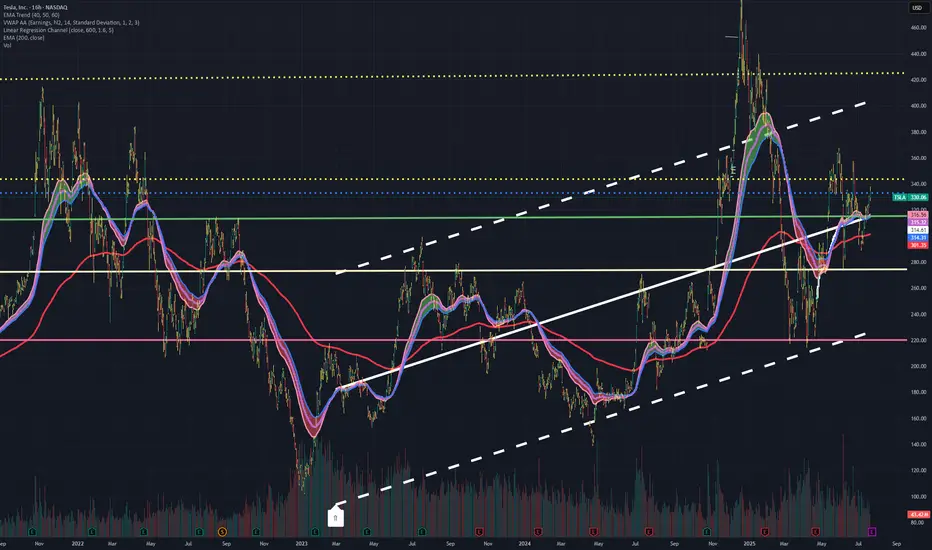
$TSLA: Multi-Scale DensityResearch Notes
Identified structural compressions happening within two periods:
This set has provided a perfect opportunity to study exponential fibs with growth rate starting from phi^1/4 applied to area of expression of squeeze.
Geometrically, gives a better sense of a continuity than regular fibs.
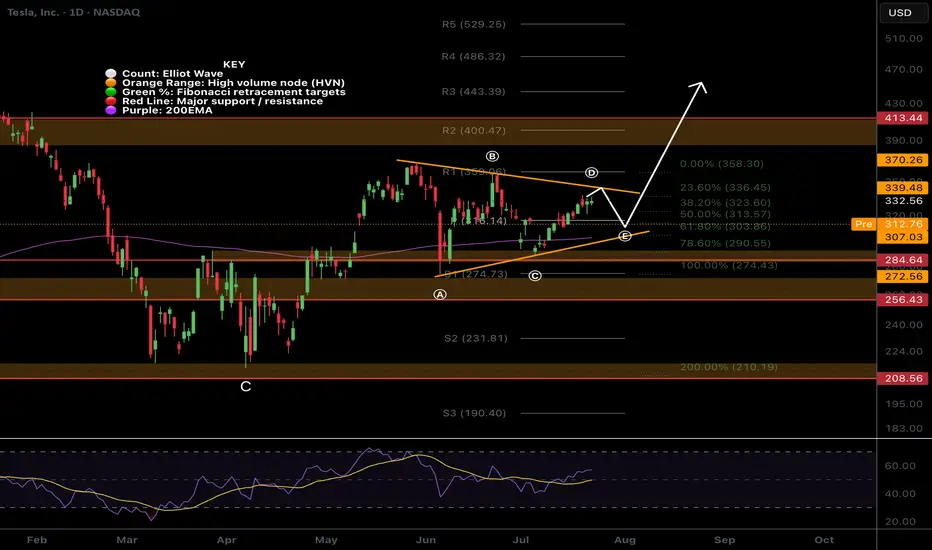
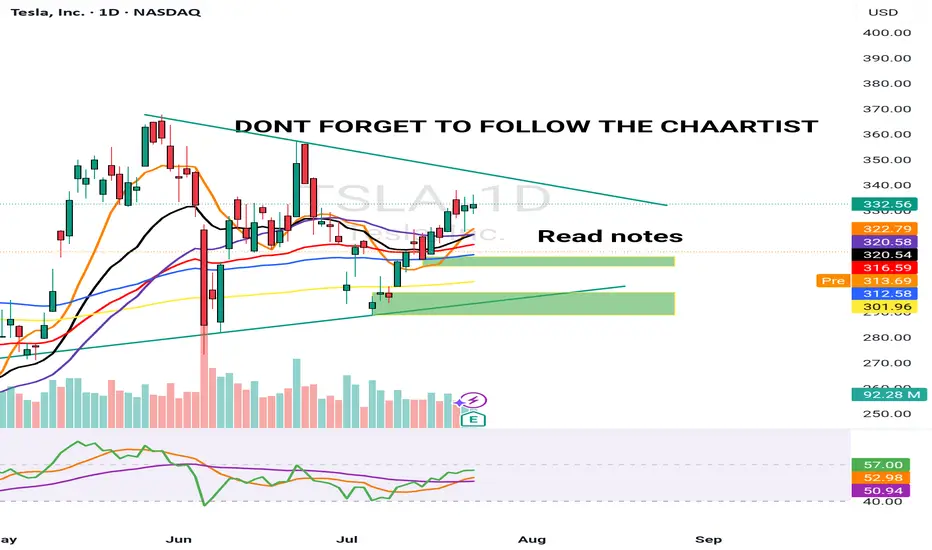
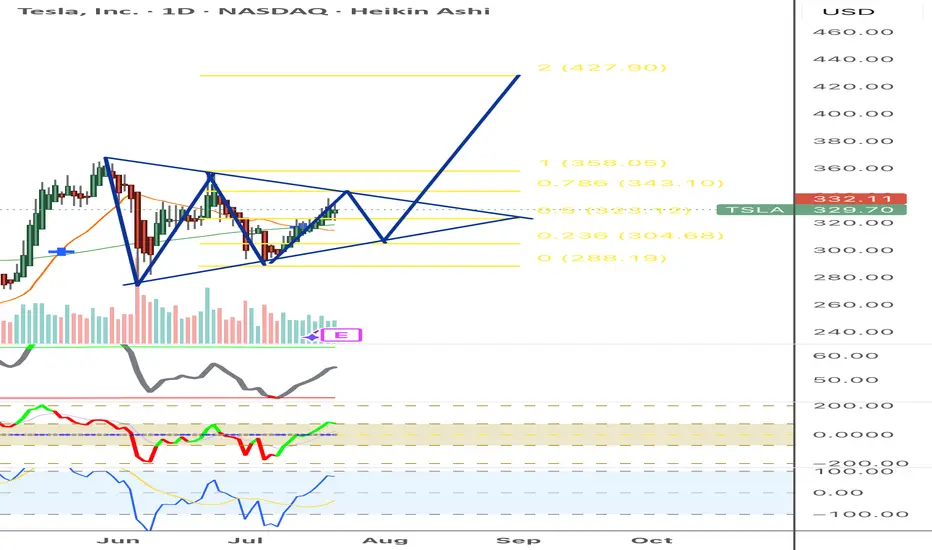
$TSLA Triangle?NASDAQ:TSLA triangle has presented itself with the recent price action. Triangle pattern target is $443 at the R3 daily pivot.
Wave e is expected to end at the daily pivot and wave d break is the signal to go long.
Analysis is invalidated below wave c.
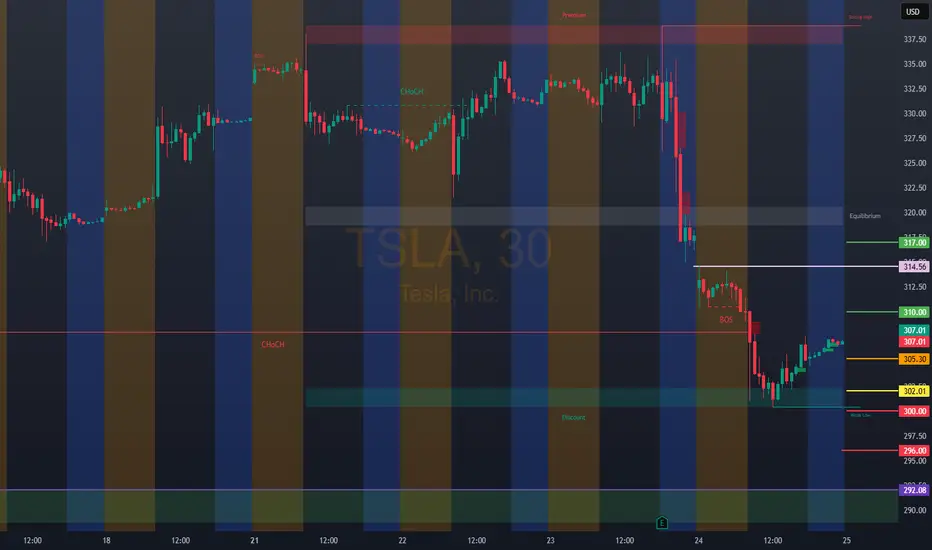
TSLA: 305.30
This idea is supported by entry price and institutional rebound.
Strong institutional breakout. Bullish Entry 2 — Institutional breakout + momentum.
Entrada: 310.00/317.00
SL: 308.00
TP1: 314.00
TP2: 316.00
Bearish Entry 2 — Strong institutional breakout
Entry: 300.00
SL: 302.00
TP1: 296.00
TP2: 292.00
TSLA to $420 - $454 areaTSLA is ready and primed to move into the $420 - $454 area over the coming quarter. This is a good options play.
We will encounter a little expected resistance at the $360 area, then an aggressive move to the $420 area.

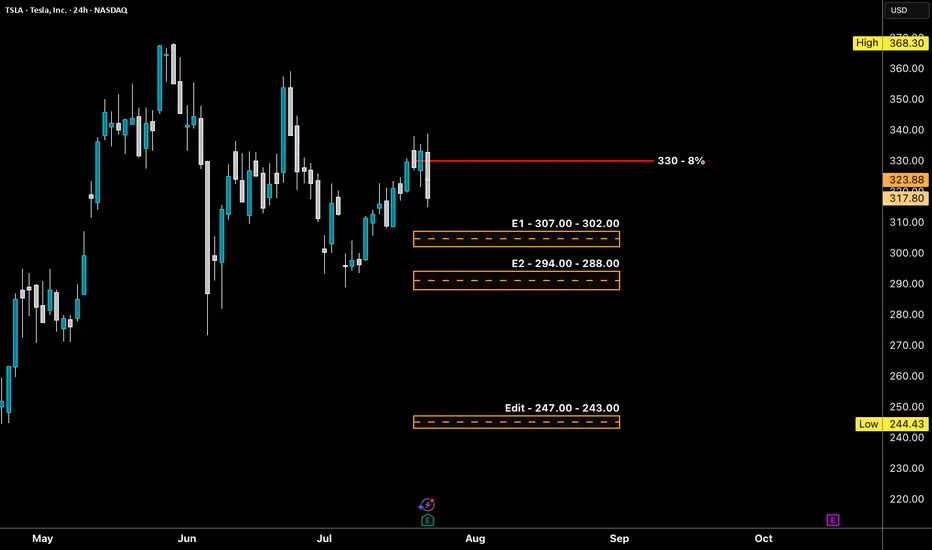
TSLA - LONG Swing Entry Plan NASDAQ:META - LONG Swing Entry Plan
Entry Zone 1: $307.00 – $302.00
→ Open initial position targeting +8% from entry level.
Entry Zone 2: $294.00 – $288.00
→ If price dips further, average down with a second equal-sized entry.
→ New target becomes +8% from the average of Entry 1 and Entry 2.
Edit Zone (Aggressive Demand): $247.00 – $243.00
→ If reached, enter with double the initial size to lower the overall cost basis.
→ Profit target remains +8% from the new average across all three entries.
Risk Management:
Stop Loss:
Risk is capped at 12% below the average entry price (calculated across all executed positions including the Edit Zone).
Position Sizing Approach:
Entry 1: 1x
Entry 2: 1x
Edit Zone: 2x
→ Total exposure: 4x
→ Weighted average determines final TP and SL calculations.
______________________________________
Legal Disclaimer
The information provided in this content is intended for educational and informational purposes only and does not constitute financial, investment, or legal advice or recommendations of any kind. The provider of this content assumes no legal or financial responsibility for any investment decisions made based on this information. Users are strongly advised to conduct their own due diligence and consult with licensed financial advisors before making any financial or investment decisions.
Sharia Compliance Disclaimer: The provider makes no guarantees that the stocks or financial instruments mentioned herein comply with Islamic (Sharia) principles. It is the user’s responsibility to verify Sharia compliance, and consultation with a qualified Sharia advisor is strongly recommended before making any investment decisions
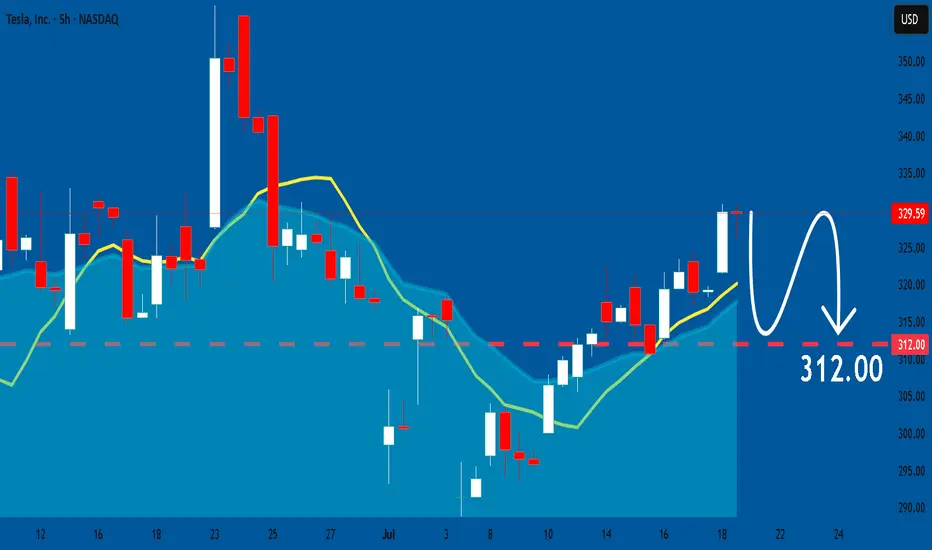
TSLA: Sell ideaHigh probability of a decline in TSLA according to the pattern shown on the chart. Target 271.62.

$TSLA Bad earnings reactionI was lucky to sell before earnings. Rebuying here. NASDAQ:TSLA had a bad earnings reaction, but otm calls getting bought at the open today 8/8 315c @8.3 for $2 million

TESLA'S BEST CASE SCENARIO, $1100 BY DECEMBER?The sequel to my last long-term Tesla video: The Worst Case Scenario, but this time, we look at the best case scenario to determine where NASDAQ:TSLA could go from here

TESLA: Bearish Continuation is Expected! Here is Why:
The charts are full of distraction, disturbance and are a graveyard of fear and greed which shall not cloud our judgement on the current state of affairs in the TESLA pair price action which suggests a high likelihood of a coming move down.
Disclosure: I am part of Trade Nation's Influencer program and receive a monthly fee for using their TradingView charts in my analysis.
❤️ Please, support our work with like & comment! ❤️
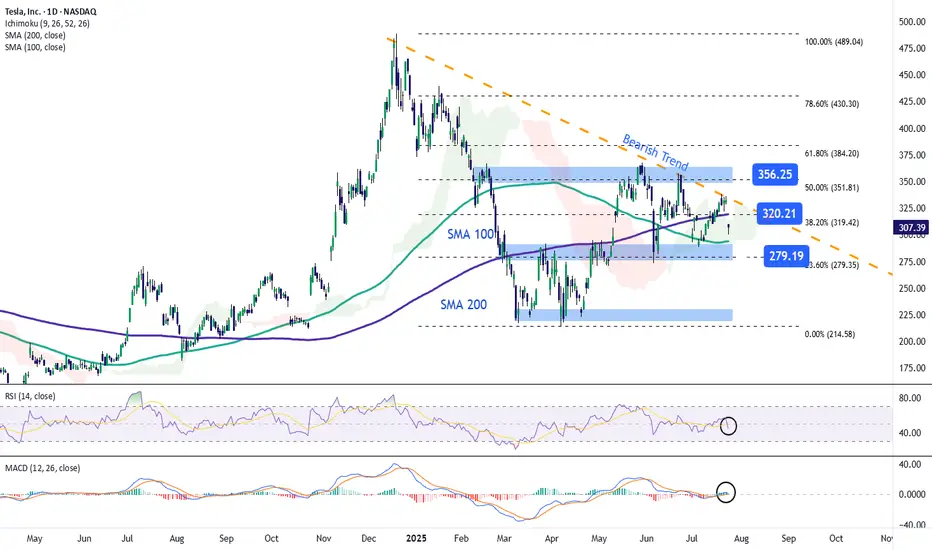
Tesla Stock Returns to the $300 ZoneShortly after reporting earnings, Tesla stock fell more than 9% in the final hours of trading. This new bearish move is mainly due to the company’s earnings per share (EPS) of $0.40, which missed expectations of $0.43, and revenue of $22.5 billion, below the projected $22.74 billion. These figures indicate that Tesla failed to meet market expectations, triggering a sustained downward trend in the stock. This move could extend further unless new catalysts emerge to restore investor confidence.
Downtrend Remains Intact
Recent price action has been clearly bearish and continues to reinforce a downtrend that began forming in late December. So far, there has been no significant bullish correction to challenge this structure, making the bearish pattern the dominant technical setup in the short term.
Technical Indicators
RSI: The indicator remains below the neutral 50 level, suggesting that selling momentum continues to build. If the downward path persists, bearish pressure may grow stronger in upcoming sessions.
MACD: The MACD histogram is currently hovering around the zero line, showing signs of technical indecision. However, if it crosses clearly below zero, it would confirm a more sustained bearish momentum.
Key Levels to Watch:
$356 – Major Resistance:
This level corresponds to the 50% Fibonacci retracement. A break above this zone could threaten the current downtrend.
$320 – Nearby Resistance:
Aligned with the 200-period simple moving average and the 38.2% Fibonacci level, a close above this point could reignite bullish sentiment and trigger a short-term upward move.
$280 – Key Support:
This is a critical support level, aligned with the 23.6% Fibonacci retracement. A breakdown here could extend the ongoing bearish trend.
Written by Julian Pineda, CFA – Market Analyst
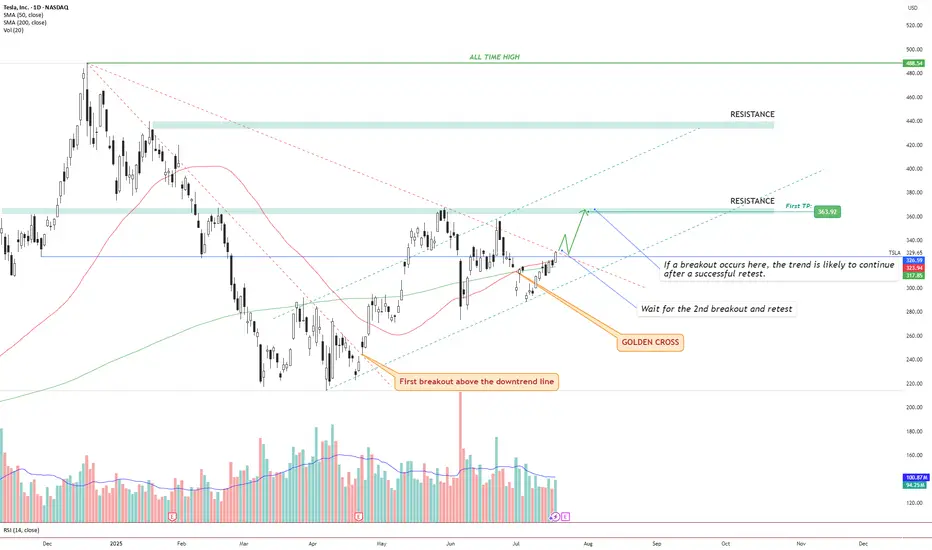
TSLA – Golden Cross + Dual Breakout Structure Targeting $363 andIdea Text:
Tesla NASDAQ:TSLA has recently printed a powerful Golden Cross , where the 50 SMA has crossed above the 200 SMA — signaling a potential long-term bullish shift in trend.
But price action shows more:
We’re observing a dual-breakout structure, where the first breakout above the long-term downtrend line has already occurred (see orange label), and the price is now approaching a critical horizontal resistance zone.
Let’s break it down step-by-step:
🔸 Step 1: Golden Cross
The 50 SMA crossed above 200 SMA — a classic signal for trend reversal. This often attracts institutional interest, especially if followed by breakout confirmation.
🔸 Step 2: First Breakout (Already Confirmed)
Price broke above the descending trendline, retested it, and maintained higher structure. This breakout initiated a shift in market sentiment from bearish to neutral-bullish.
🔸 Step 3: Second Breakout (Setup Forming)
Price is now testing horizontal resistance around $330–$335 zone. This zone also coincides with dynamic resistance from prior failed swing attempts. A successful breakout above this level, followed by a clean retest, can serve as confirmation for a bullish continuation.
🔸 Step 4: Target Setting
🎯 First TP is set at $363.92, a well-defined resistance level. If the breakout holds, next potential targets may develop around key zones such as $395 and $440, depending on price strength and continuation.
🔸 Risk Management
✅ Ideal entry after retest of breakout above ~$335.
❌ Stop-loss below the breakout level or below 50 SMA (~$315 area), depending on entry style.
🔄 Monitor volume: breakout without volume = weak move.
Conclusion:
We are watching a classic price action + moving average confluence setup. Golden Cross, breakout + retest structure, clean resistance level, and defined targets all align.
This setup is valid only with confirmation. No breakout = no trade.
⚠️ Not financial advice. DYOR.
TSLA 24 JULY 2025I have marked 2 levels in green boxes. Price is inside this box pre market and TSLA is down -8.5% from the highs of $338 post market till $310 & -7.5% down from yesterday's close
A better level is the lower demand zone but its not the best. Price has not hit any major resistance.
My job is to read the data & trade. I am still bullish & 10% up down move is normal for Tesla &
This could be a "BEAR TRAP".
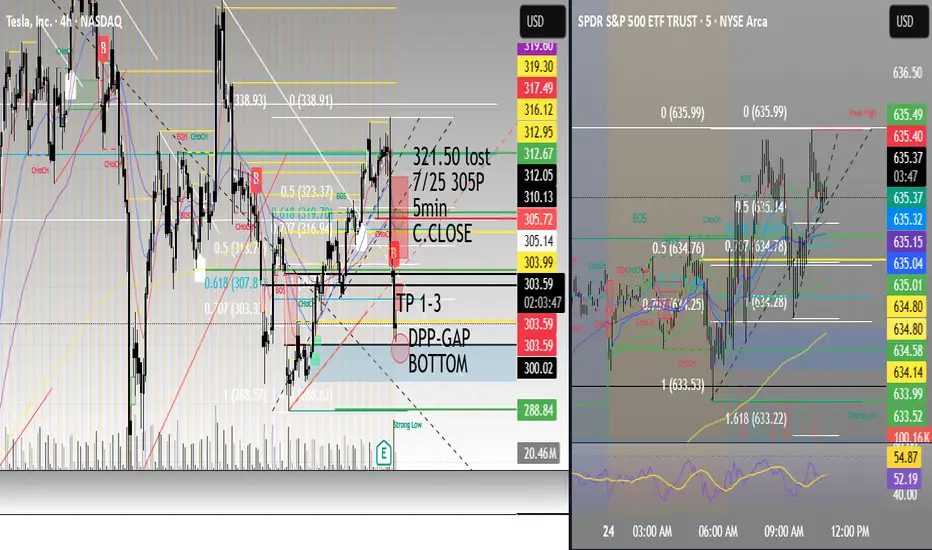
TSLA Earnings Play (Bearish Bias)
🚨 TSLA Earnings Play (Bearish Bias) 🚨
Earnings Date: July 23, 2025 (AMC)
🧠 Confidence: 75% Bearish | 🎯 Target Move: -10%
⸻
🔍 Key Takeaways:
• 📉 TTM Revenue Growth: -9.2% → EV demand weakness
• 🧾 Margins Under Pressure: Gross 17.7%, Operating 2.5%, Net 6.4%
• ❌ EPS Beat Rate: Only 25% in last 8 quarters
• 🐻 Options Flow: High put volume at $330 strike
• 🧊 Low Volume Drift: Trading above 20/50MA but losing steam
• 📉 Sector Macro: EV competition + cyclical headwinds
⸻
🧨 Earnings Trade Setup:
{
"instrument": "TSLA",
"direction": "put",
"strike": 300,
"expiry": "2025-07-25",
"entry_price": 2.02,
"confidence": 75,
"profit_target": 6.06,
"stop_loss": 1.01,
"entry_timing": "pre_earnings_close",
"expected_move": 7.1,
"iv_rank": 0.75
}
⸻
🛠️ Trade Details:
Parameter Value
🎯 Strike Price $300 PUT
💰 Premium Paid $2.02
📅 Expiry Date 2025-07-25
🛑 Stop Loss $1.01
🚀 Profit Target $6.06
📏 Size 1 Contract
⏱ Entry Timing Pre-Earnings
📊 IV Rank 75%
🕒 Signal Time 7/23 @ 14:14 EDT
⸻
📈 Strategy Notes:
• 🧯 IV Crush Risk: Exit within 2 hours post-earnings
• 🎲 Risk/Reward: 1:3 setup | Max Loss: $202 | Max Gain: $606+
• 🧭 Volume Weakness & put/call skew signal downside
• 🧩 Macro + Tech + Flow Alignment = Tactical bearish play
⸻
🧠 “Not all dips are worth buying — this might be one to short.”
📢 Drop your thoughts — would you take the trade or fade it?

Next Volatility Period: Around August 21
Hello, traders.
Please "Follow" to get the latest information quickly.
Have a nice day today.
-------------------------------------
#TSLA
We need to see if it is rising along the rising channel.
The key is whether it can rise with support near 311.48 to break out of the downtrend line.
The key is whether it can rise along the short-term uptrend line and break through the short-term downtrend line after passing through this volatility period around July 25.
Therefore, we need to see whether it can rise above the 347.21-382.40 range with support near 311.48.
The next volatility period is expected to be around August 21.
-
The important thing is to maintain the price above the M-Signal indicator on the 1M chart.
If not, there is a possibility of a long-term downtrend.
Therefore, if it shows support in the 268.07-311.48 range, it is a time to buy.
-
Thank you for reading to the end.
I hope you have a successful trade.
--------------------------------------------------

Bitcoin, SPX, Ethereum, Tesla: Whats Next? BTC appears to be showing distribution signs.
I do believe BTC local top is in, but alt coins like Ethereum can still push a bit higher.
Ethereum short around 3900-4000 looks promising
Tesla fell sharply on the back of cash flow burn and expenditures.
Investors are also fearful of sales decline and loss of EV credits.
SPX hit major long term resistance today. Coupling this with a depressed Vix we are likely setting up for a pullback in the market.
Small caps saw distribution today on the back of rising yields. A failed breakout observed on IWM chart.

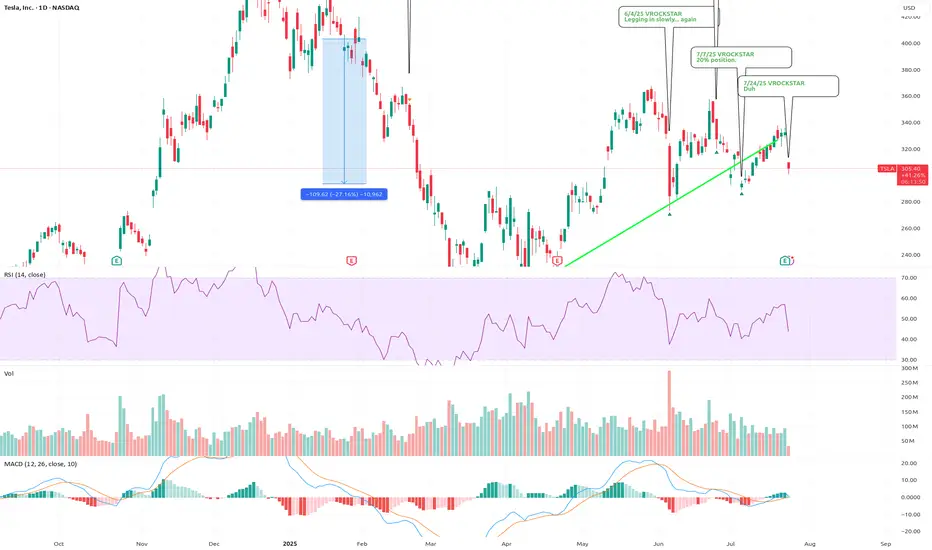
7/24/25 - $tsla - Duh 7/24/25 :: VROCKSTAR :: NASDAQ:TSLA
Duh
- ppl focused on ST FCF (all over X!) is 100% of the reason why when you put the pieces together, you realize that while ST this might not behave like anyone expects... LT, TSLA is v likely going to in, elon's own words, be the largest cap in the history of capital markets
- two leading robots with leadership position in IRL AI
- profitable, is all that matters
- have not yet hit the S-curve
was super lucky to trim some of this last week
now i'm back to sizing into a full position, not yet there like on that silly political dump, but i'm nearly 10% (20% is my max size).
V
TSLA squeezes into resistance ahead of earnings Tesla is set to report Q2 earnings after the closing bell on Wednesday, covering the quarter ending June 2025.
The stock has been highly volatile this year, amid concerns about tariffs, Elon Musk’s politics (and nazi salutes), and his public clashes with President Donald Trump.
Tesla bulls Wedbush think, “We are at a 'positive crossroads' in the Tesla story,” suggesting that investors will look past the current numbers and focus on Tesla’s long-term AI potential.
Technically, Tesla is now testing a major descending trendline that’s capped every rally since December. The current price action resembles an ascending triangle pattern — a bullish structure — with resistance around $356 and a series of higher lows from May through July. This tightening formation suggests building pressure ahead of the earnings release.
tsla heading higherWith the expansion of robo taxi we will be heading higher soon, don't miss this move. If we pull back a little at earnings that's ok. I don't believe it will go any lower then 315. It should be upside from here. Tsla is not just a car company, its AI, energy, autonomous driving. Its a engineering company that changing the way the world does everything. It will be one of the top stocks for a long time. Easily going to 1000 by next year. That my prediction.
TSLA VolanX Earnings Strategy: Short-Term Bearish Bias (TEST)🧠 VolanX Earnings Strategy: Short-Term Bearish Bias
🎯 Goal:
Capitalize on downside or neutral reaction to earnings with defined risk and IV crush protection.
🔻 Primary Trade: Bear Put Spread
Strategy: Buy Put at ATM, Sell Put at lower strike
Expiration: July 25, 2025
Structure:
Buy 330 Put
Sell 315 Put
Max Risk: Premium paid (e.g., $5–6 per spread)
Max Profit: ~$15 if TSLA closes ≤ 315
Breakeven: ~$325
📈 Why This Works:
Aligns with DSS projection ($317.74 30-day)
Short expiry captures earnings move + IV crush
Profits if stock stays below ~325 post-earnings
🟨 Alternative Trade: Neutral-to-Bearish Iron Condor
If expecting rangebound post-earnings:
Sell 340 Call / Buy 345 Call
Sell 315 Put / Buy 310 Put
Credit: ~$3.50–4.00
Max Risk: ~$1.50–2.00
Profit Zone: 315–340
Best if TSLA volatility collapses and price stays in a channel.
🧨 High-Risk, High-Reward: Put Ratio Backspread
Buy 2x 320 Puts
Sell 1x 330 Put
Cost: Small debit or credit
Profit: If TSLA tanks → big delta gain
Risk: Small near expiry if TSLA closes near 320–330
Use this only if expecting a big bearish surprise.
🔧 Risk Management:
Position size = max 1–2% of account
Avoid holding spreads past Jul 25 if IV collapses
Use alerts around 330 / 325 / 317.5 for exits
🧠 DSS-Backed Tagline:
"With DSS projecting a controlled pullback and flow confirming overhead hedging, we favor bearish verticals and vol crush plays going into earnings."

TSLAJust another observation to see if this will play out? I’m not in the market, this just for my own play tracking to see how things work out
TSLA, revenue decline/textbook technical setup.TSLA, revenue decline/textbook technical setup.
Confluence of major levels, how to take a well defined short trade with puts.
Clean as it gets.
Tesla Shares (TSLA) Drop Following Earnings ReportTesla Shares (TSLA) Drop Following Earnings Report
Yesterday, after the close of the main trading session on the stock market, Tesla released its quarterly earnings report. While both earnings per share (EPS) and gross profit slightly exceeded analysts’ expectations, the results reflected a negative trend driven by declining sales. This decline is being influenced by intensifying competition from Chinese EV manufacturers as well as Elon Musk’s political activity.
According to Elon Musk:
→ The company is facing “a few tough quarters” due to the withdrawal of electric vehicle incentives in the US;
→ The more affordable Tesla model (mass production expected in the second half of 2025) will resemble the Model Y;
→ By the end of next year, Tesla's financials should become "highly compelling".
Tesla’s share price (TSLA) fell by approximately 4.5% in after-hours trading, clearly reflecting the market’s reaction to the report. Today, the stock is likely to open around the $317 level, down from over $330 just the day before.
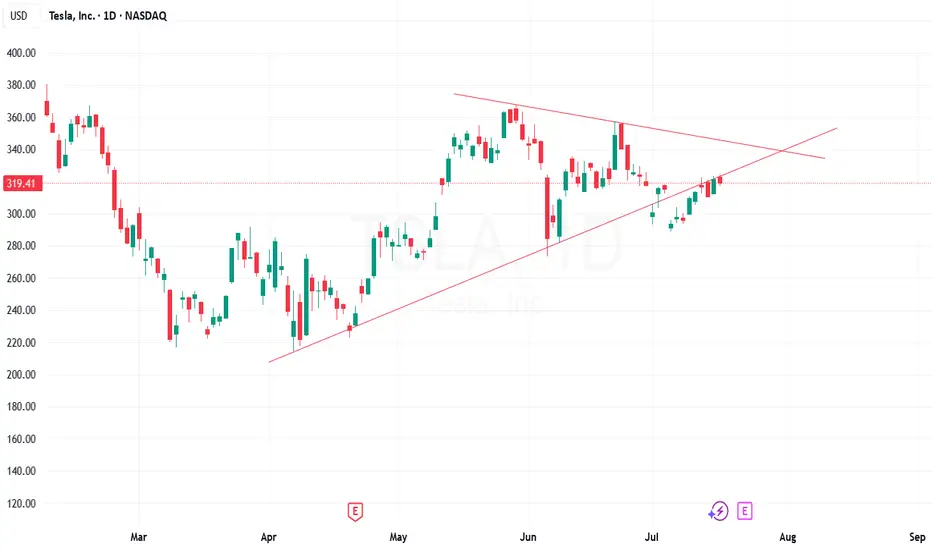
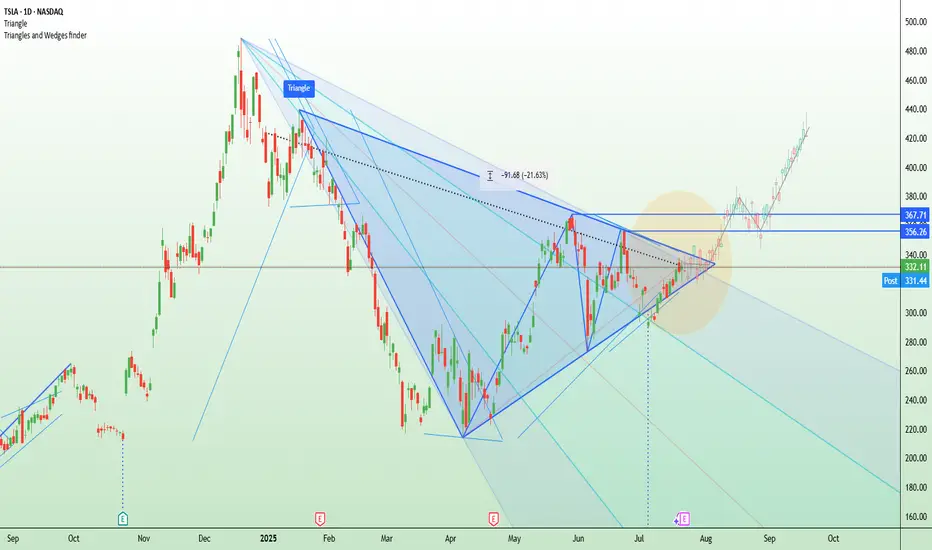
Technical Analysis of TSLA Stock Chart
In our analysis of TSLA charts dated 2 July and 8 July, we outlined a scenario in which the stock price could form a broad contracting triangle, with its axis around the $317 level.
The new candlesticks that have appeared on the chart since then have reinforced the relevance of this triangle, as the price rebounded from the lower boundary (as indicated by the arrow) and headed towards the upper boundary. However, yesterday’s earnings report disrupted this upward move.
Thus, while the broader stock market is trending higher (with the S&P 500 reaching a historic high yesterday), TSLA may remain "stuck" in a consolidation phase, fluctuating around the $317 level—at least until new fundamental drivers shift market sentiment.
This article represents the opinion of the Companies operating under the FXOpen brand only. It is not to be construed as an offer, solicitation, or recommendation with respect to products and services provided by the Companies operating under the FXOpen brand, nor is it to be considered financial advice.