TRVC trade ideas

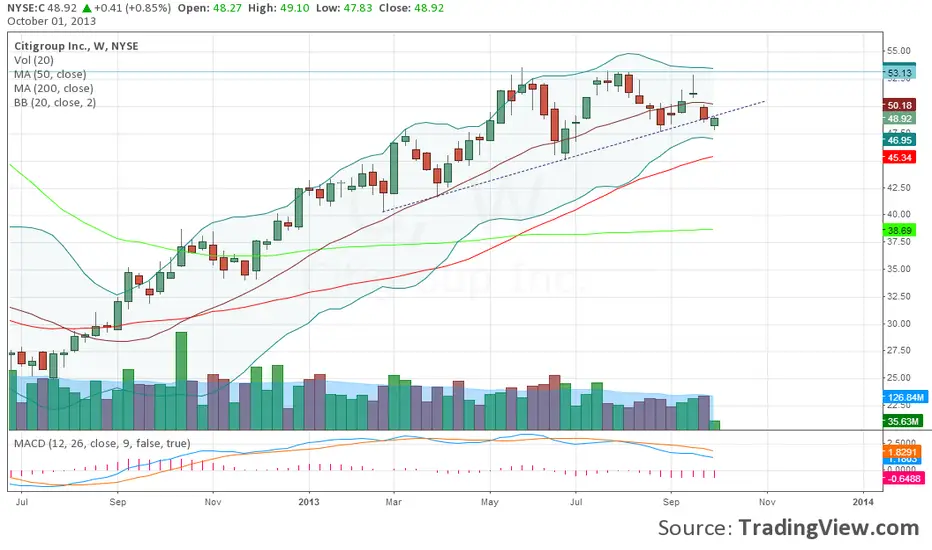
Learn MACD with C Historical PriceThere is 2 Signal that MACD made
Golden cross and deadth Cross
you can see in the chart,
Golden cross is a buy / long signal
when Blue line cross the red line, it is Golden cross, and it is a buy/long signal
when red line cross the blue line, it is deadth cross, and it is a sel/short signal
in C Chart, MACD is quite accurate to predict the trend

C break high target 56 C break high
i think this is a bull rally signal
buy/long on break 54 target 56
Stop loss 53


$C Citi on the verge of a big breakoutAs rotation continues, Citi and JPM have a long ways to catch up to $BAC and the big breakout it just had.


CCall option buy at price stock 52$ strike price 53@0.16, And sell at price stock 53$ strike price 53@ 0.55 Take profitrun = +243% in 4 days.


Citigroup Ready to Move?Shares of Citigroup have been trading in the $48-$52 range for close to the last 6 months. With the stock currently trading at $50, Citigroup has YTD performance greater than 25%. Despite the above average returns, I think the stock is getting ready for a breakout very soon. The $52.5 January options are trading at 5:1 call to put ratio and the $55 January option right now has a 3.5:1 call to put ratio.

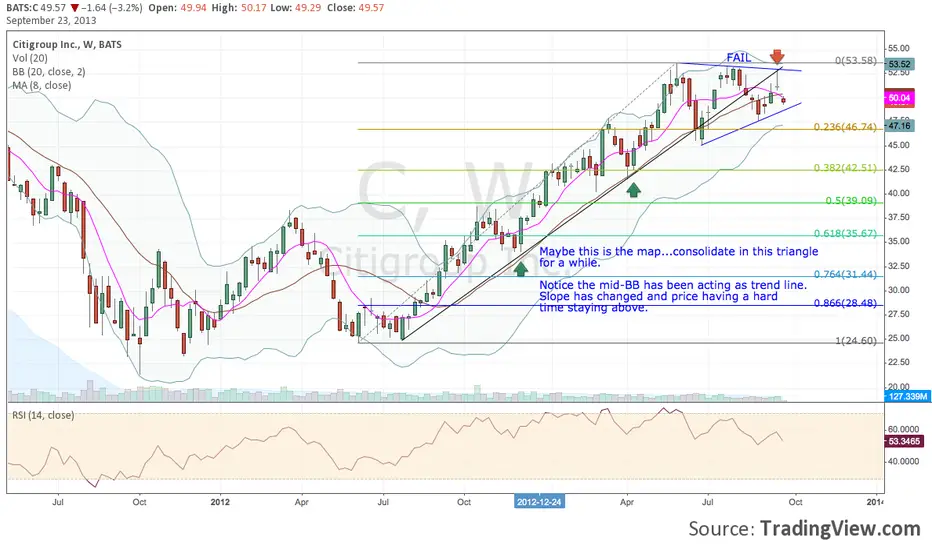
CityGroupElliott Wave Bullish Contracting Triangle.
For the reason C wave was already complex, D should be finished & impulse wave up to act with daily TF.
E finished either X wave or IV wave. First Alternation comes with 51 $ tick, note that once & if reached contracting triangle can be drawn as bearish pattern & scenario ie. to end B wave !


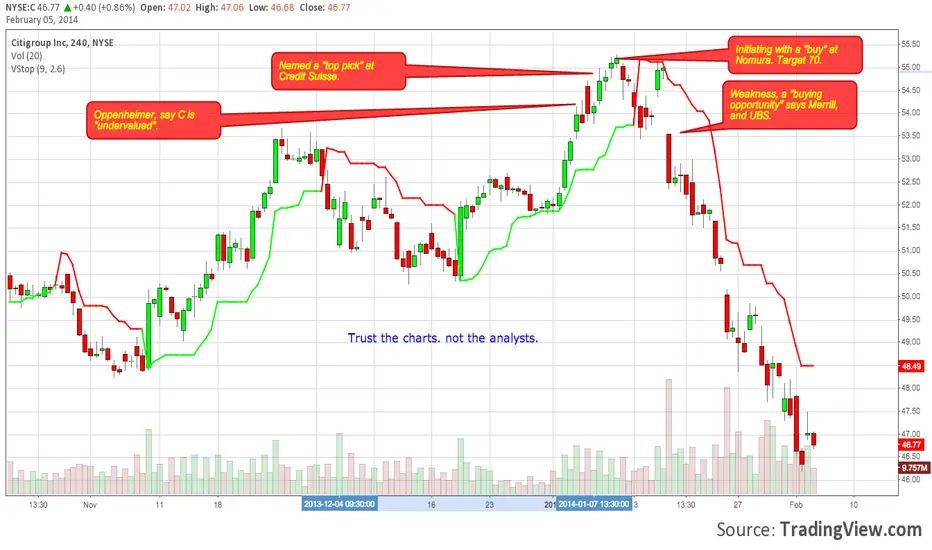
Citigroup outlookIf we get a retest of prior highs, there is a big chance to get short for a long-term move down.
This pattern is based on long covering at an important price level. Wait for a false break or any kind of weakness.
For further information about my trading style, live trading videos and analyses, subscribe to my YouTube Channel: bit.ly

Triple Top Nick Line broke ...whats Next 45.40Triple Top Nick Line broke ...whats Next 45.40 ,,, this caused of broken nike line with low volume re- test we think this the best place to go bearish