TKUK1! trade ideas

Short corn The March 31 report could be ugly with lots of corn to be planted. No good news for corn unless we see a weather scare.

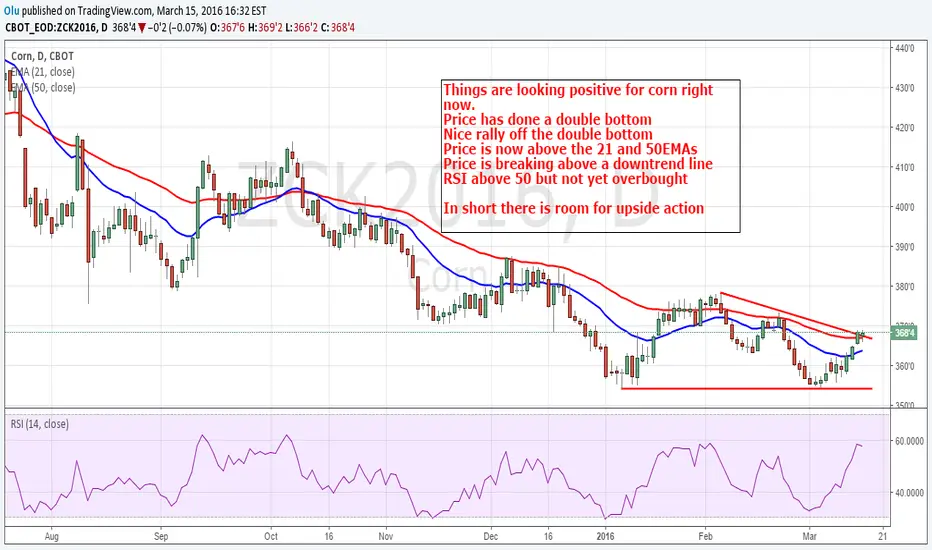
Corn: Not A Trade Idea Just A ReactionI was looking for some upside action in corn as it appeared all the grain complex have turned the corner. Then this! This business is no an easy one by any means

While positionning is record short, price action is...... rather bullish.
Weekly:
- Ichimoku is more neutral. Price stil below Kijun and Kumo (bearish), but all averages has been flat line for long time now.
- Triangle
- Heikin-Ashi is bullish biased now, but haDelta is still sround zero line. Needs more momentum.
- EWO ticking back to zero -> neutral
- Strategic key reversal level is: 395
Daily:
- Bullish Kumo breakout gets validation as Tenkan and Chikou moving above Kumo too!
- Heikin-Ashi bullish continuation: candle and haDelta gives a buy signal after 2 days of consolidation-
- EWO is bullish
- ATR is still extremely low! If record short positions get squeezed, price action can turn really agressive, with volatility to jump.
Hold/increase longs. Stop below 360. Trail stops with PSAR and/or Kijun Sen. Initial target 390-395.

Watch CORN...Grains market is interesting right now. DBA, agriculture etf, broke out of daily cloud and I am looking at corn here.
Weekly:
-Bearish Ichimoku
-But you can make a case of double bottom with rsi and ha osc divergence
-Prices trying to get over TS, for move to KS first as it is first hurdle.
Daily:
-Weak TS and KS cross and prices currently at cloud and 100 wma
-HA osc is above 0
-Break of cloud should bring acceleration for move up.
Sugar already broke out. So corn and wheat are getting interesting now.. My bias is bullish here.

May CornMomentum building for a rally. Looking for profits near 100 Day MA. Remember to lock in profits when price gets far enough into the green

Short OpportunityFutures trading is not for everyone. Please be advised that future contracts involve substantial risks.


GIANT TRIANGLE IN CORN ABOUT TO POP - ZC1!It's close to spring and corn is about to break out of a triangle.
I could see how people will be flocking to Corn in March-April-May-June as you can clearly see that Corn hasn't had the excessive volatility that stocks and bonds have had this year so far.
Corn looks like a peaceful lake compared to a tsunami and a typhoon over in the equity and bond markets.
Either way, look for "planting intentions" and lots of forecasts to make corn POP in the next few weeks.
All the best,
Tim
364'2 front month Corn ZC1!

Possible short set up on Corn May contractThere is a possibly short play opportunity developing on the Corn MAY16 contract that, if valid, should materialize some time between March 15 and 18.
Price has been trading within an ascending channel that started March 3 and price is currently at the higher boundaries of same channel.
There is a longer term and rather wide descending price channel that started on October 7 and of which price tested the upper line during Feb 2-4 and during Feb 18-23. Price is now heading to same upper boundary again and should arrive there by Mar 15-16, provided that price continues to follow its current short term ascending channel. The 50DMA is clustering with same upper channel boundary and should add to resistance on price. Doing nothing yet but keeping an eye on it for next week.


Corn - Flat bottom, short potential in case of breakoutCorn is showing a flat bottom triangle pattern. The period of the wave is getting shorter and shorter and the wave is getting enclosed at the end of the triangle. We may see a breakout before March and that would provide a clear signal for selling. For increased confirmation, we may wait for a level that was present just below the triangle and defined by the SSB of Nov 2014. Ichimoku: we see that the cloud provides a strong resistance. Breaking of the Kijun will be the first alert before the breakout, patience is required.
Two scenarios for the short: either use the supports as main targets or rely upon the height of the triangle as guideline. Both could be combined with 50% closing at 344 and the rest at 306. I put the SL at the Kijun for the moment on the chart but as soon as the breakout occurs, it can be tigher. Ichimoku cloud SSB could be used for that purpose.

Corn SHORT with hidden divergence & Stoch crossover in dailyThis is my first trade in the project 1000x. Both monthly and weekly views show that there is still place for the bears to push the price lower. We had a good red candle with bearish Stoch crossover at a key TL. Hidden divergence is in play, too. Thus, I risked somewhat $500 for this is my first trade in the series where I take the challenge of turning a grand into a million. In each trade, I will risk half of the capital I reserve for this project, finally reaching $1M with trades having at least 1:2 RR. For the details of the project, you may visit project1000x.blog.com.


ZCH16Elliot wave to ABC correction/possible trend reversal. I like a long position at the "B" leg support level.


Major bearish trendbreak? Strategic reversal in 2016?Weekly:
- We need some more bullish momentum to get validation for the major trendline break. If that thick red line breaks, that means the end of a 2,5-3 years volatile bear market.
- Strategic reversal would really be confirmed above 395!
Daily:
- Ichimoku neutral with bullish bias. Forward Kumo 26 days ahead is about to deliver a bullish Senkou cross. (Bullish Kumo twist)
- haDelta/SMA3 may deliver a sustainable bullish cross above zero. Heikin-Ashi looks positive
- EWO is bullish
- Key for bullish continuation is a break and close above 372-375

Corn is about to head north dramatically. Here's why.....Looking for entry, small until 380 broken (full size if 357 is revisited with a stop below 347)

Corn weekly TAI am not sure if seeing the last price action within a triangle is a legitimate technical stance, but it seems the triangle break is imminent. Bullish targets for this breakout is so close, so let's hope it's going to break the support. I will not trade this until the weekly picture is cleared.

Corn monthly TASome lines I see important are in the chart. It seems the downtrend is paused for a while, and will probably continue to eat more beef until the ML. We will see how far this consolidation will last. In-range opportunities might occur on both sides.

