BICO expectation (1D 1H)
In my previous post about BICOUSDT, I've watched the market for the entry opportunity but unfortunately it slipped. Click above to check.
The price is now below the resistance line of the weekly downtrend again, but is refusing to continue the downtrend - normally when the breakout fails, price drops without hesitation.
Look at what happened in July, for example, we see price being immediately pulled back after touching the resistance line.
It did show some price action around 0.2978 after the touch, but eventually continued with the downtrend.
So what's the difference between then and now?
There are several differences, first one being the breakout. Previous touches did not break through the resistance line - price reversed as soon as they touched it. This time, however, the price managed to breakout and stayed above the line for a while. This is significant because the price finally managed to breathe fresh air after several failed attempts.
The second difference is consolidation after the breakout.
We already see two respectful bounces after the pullback. I say 'respectful' because the bullish reversal is very strong. As soon as the price touches the level, it almost immediately bounces back up with strong momentum.
The third difference is the most important: volume.
Have a look at the volume here. Previous highs do not have any significant volume spikes.
By my calculation, average daily volume was around 4 - 5 million USDT during the downtrend.
Last 5 days had volume of 420+ million USDT in total. This is a significant spike we cannot overlook. Volume does not lie.
Let's look at July 17th when the breakout happened. We see the initial breakout, pullback, second breakout and an uptrend.
These two points would be where we would've entered.
First entry is where we confirm the breakout and the break of structure,
second is where we confirm the reversal of trend after touching the resistance line.
The uptrend unfortunately stopped and reversed in 0.3643.
Similarly, if we see a break of structure where the green arrow points at, this will be our first entry for LONG.
Even better entry would be here where the price pulls back to the BoS level and shows reversal.
Where would we set our TP and SL?
For TP, there are five different levels we can expect a resistance.
I would sell most of my position by 0.3643. I will leave some to possibly sell at 0.4.
If the price fails to reach 0.4, I will exit then.
SL would be where the price pulls back to the resistance line.
However, if we confirm a reversal there, we might shoot for a new entry.
If not, new opportunity will knock at our door for SHORT!
BICOUSDT trade ideas

#BICO(SPOT) entry range( 0.1900- 0.2390) T.(0.6399) SL(0.1790)BINANCE:BICOUSDT
entry range (0.1900- 0.2390)
Target1 (0.3899) - Target2 (0.6399)
1 Extra Targets(optional) in chart, if you like to continue in the trade with making stoploss very high.
SL .1D close below (0.1790)
*** collect the coin slowly in the entry range ***
*** No FOMO - No Rush , it is a long journey ***
**** #Manta ,#OMNI, #DYM, #AI, #IO, #XAI , #ACE #NFP #RAD #WLD #ORDI #BLUR #SUI #Voxel #AEVO #VITE #APE #RDNT #FLUX #NMR #VANRY #TRB #HBAR #DGB #XEC #ERN #ALT #IO #ACA #HIVE #ASTR #ARDR #PIXEL #LTO #AERGO #SCRT #ATA #HOOK #FLOW #KSM #HFT #MINA #DATA #SC #JOE #RDNT #IQ #CFX #BICO ****

BICOUSDT possible uptrend!In my previous post about BICO,
I suggested that BICO might stop the months old downtrend and switch to an uptrend.
We now see a strong bull candle breaking through the resistance line - great evidence of a possible uptrend.
It might be too risky to enter now, but if the trend reverses back to the BOS line and bounce back, that might be a good entry point for LONG.
The volume also suggests strong signal for the start of an uptrend.
I expect a pullback as low as 0.2265.

BICO/USDT: Looking Promising for a Breakout!BICO/USDT: Looking Promising for a Breakout!
BICO/USDT is showing signs that it may be on the verge of a strong upward move. This setup is creating excitement as traders watch for a potential rally in the coming days. Here’s a detailed look at what to keep in mind to maximize your breakout trading strategy:
Breakout trading tips 💡
1. Confirm the breakout: A true breakout happens when the price pushes above the resistance level with solid momentum. Look for a strong candle close above this level, backed by increasing volume. This indicates that buyers are committed and less likely to reverse. Avoid jumping in on weak moves, as “fake-outs” can trap traders who enter too early 📊
2. Watch for retests: Breakouts often come with a “retest” where the price dips back to test the old resistance level as support. This is a crucial area to watch, as successful retests can confirm the strength of the breakout. This can also offer a better entry point with reduced risk, allowing you to take advantage of the trend without chasing the price 🔄
3. Set smart stop-losses: Protecting your capital is key. For breakout trades, placing a stop-loss slightly below the breakout level or retest point is a smart way to limit losses in case the breakout fails. A well-placed stop helps you stay in control even if the move doesn’t hold up 🛡️
4. Track market sentiment: Breakouts are often influenced by the overall market environment. Keep an eye on Bitcoin and other major cryptocurrencies, as sentiment shifts in these can impact smaller assets like BICO. Strong bullish or bearish trends in the market can either boost or stall breakout momentum, so always stay aware of the bigger picture 🌐
5. Set realistic targets: Map out potential resistance levels above the breakout point. These can act as targets for your trade. Taking partial profits at these levels allows you to lock in gains while leaving some position open if the trend continues 📈
Trade with caution and keep these tips in mind to make the most of BICO/USDT’s promising move. This isn’t financial advice—always DYOR! 🔥

BICOUSDT analysis (1H, 1D)I've done a NEIROETHUSDT analysis in the recent past,
and one thing I learned from it was that we should never overlook the volume .
We look at the BICOUSDT chart here and similarly we see a big volume in recent hours.
The red line represents the resistance line of the downtrend from 1D chart.
The downtrend has been continued for last 6 months ,
and we can see that this line has had a lot of price actions since this March - making it very important & historical.
And now, we see the price approaching the line again,
but this time it is exceptionally aggressive - the candle is tall, the volume is nothing like we've seen in past 2 months.
Going back to the 1H chart, we can identify the supply zone just before the aggressive climb takes place.
We can rely on this zone because it has shown numerous price actions in the past - whenever the price steadily declined down to the zone, it has shown reversal of trend.
The only time it did not respect the zone was this - a massive bearish candle delivered by the volume spike - almost 50 times higher than the previous one.
When the price moves aggressively like this, we cannot expect reversal to happen: this is why we always enter AFTER confirming the reversal.
The price is now being retested in 0.22 - 0.23 zone.
One strategy we might use here is good old 'liquidity grab' strategy.
The principle of this strategy is catching the false breakout of the liquidity grab line and enter short when we confirm reversal of the trend.
Momentum Oscillator will help us in confirming the reversal.
HOWEVER, the unusual volume spike in recent candles could make such approach risky.
Although it might be profitable temporarily, it is definitely not in long term. (At least we cannot expect it to be.)
Considering two factors - one, price is very close to the resistance line of the downtrend with high volume and two, BTC is on an uptrend as US election nears:
these could mean that BICO is ready to stop the 6-months downtrend and reverse into an uptrend.
When price is being this aggressive, it might not respect any zones, lines or levels.
BTC movements are also very unusual.
Back to BICO:
And just as it shows in its history, it doesn't mess around in an uptrend.
Stay tuned!

BICOUSDTBICO ~ 1W ✅
#BICO If you have Conviction on this coin,. Maybe you need to pay attention to this support block to start buying gradually, at least for a profit of 20%+

BICO's Situation: What Shall we Expect !!!BINANCE:BICOUSDT
BICONOMY hit a new ATL at $0.163, and now holding at $0.230 above the support zone
If support holds, we could see a potential 300%-500% rally in coming months ,Targets: $0.98 to $1.3 .
✨Traders, if you liked this idea or have your opinion on it, write in the comments, We will be glad.
_ _ _ _ _ _ _ _ _ _ _ _ _ _ _ _ _ _ _ _ _ _ _ _ _ _ _ _ _ _ _ _ _
✅Thank you, and for more ideas, hit ❤️Like❤️ and 🌟Follow🌟!
⚠️Things can change...
The markets are always changing and even with all these signals, the market changes tend to be strong and fast!

BICO Technical Analysis in a Weekly TimeframeHello everyone, I’m Cryptorphic.
I’ve been sharing insightful charts and analysis for the past seven years.
Follow me for:
~ Unbiased analyses on trending altcoins.
~ Identifying altcoins with 10x-50x potential.
~ Futures trade setups.
~ Daily updates on Bitcoin and Ethereum.
~ High time frame (HTF) market bottom and top calls.
~ Short-term market movements.
~ Charts supported by critical fundamentals.
Now, let’s dive into this chart analysis:
BICO recently hit a new all-time low at $0.1631. With the current price at $0.2497, BICO is holding the support trendline, and it's likely to bounce back if it maintains this support.
If a rebound materializes, we could see a 300%-500% rally in BICO in the coming weeks.
Note: BICO needs to maintain the support trendline to stay in the game. A weekly close below the support trendline could have negative consequences for BICO.
Key levels:
- Crucial Support/Accumulation: $0.21.
- Target: $0.97 to $1.3,
- Invalidation: A weekly close below $0.21.
DYOR, NFA.
Please hit the like button to support my content and share your thoughts in the comment section. Feel free to request any chart analysis you’d like to see!
Thank you!
#PEACE

#BICOUSDT Ready for Bullish Breakout from Descending ChannelYello Paradisers, could #BICO be gearing up for a breakout or further downward movement? Let's look at the latest analysis of #BICOUSDT:
💎#BICO is currently trading within a descending channel, but it’s nearing a key demand zone that could ignite a significant move. We’re eyeing a potential bullish breakout from this pattern.
💎#Biconomy ( OMXSTO:BICO ) has been sticking to a descending resistance line, but the price is inching closer to a crucial demand level at $0.20–$0.22. This zone could be a game-changer. If the price taps into this level and gains momentum, a bullish breakout could be on the horizon.
💎A break above the descending resistance could propel #BICOUSDT toward the major supply area at $0.49. This is a critical zone—if we see a successful breach, expect a strong bullish move targeting the next resistance zone.
💎However, we must stay cautious. If #BICO fails to sustain momentum and gets rejected at the supply area, the price could pull back. A bullish rebound might occur from the lower strong support at $0.178.
💎But be aware—if OMXSTO:BICO drops below this level, it could signal a prolonged bearish trend, keeping the price trapped within the descending channel.
The market can turn quickly, and those who are disciplined will be the ones to capitalize.
MyCryptoParadise
iFeel the success🌴

BICO targets for 2023BINANCE:BICOUSDT
✅Before we start to discuss, I would be glad if you share your opinion on this post's comment section and hit the like button if you enjoyed it. Thank you.
Possible Targets and explanation idea
➡️Fib relevant. Always when we under 0.27 zone its time for accumulation
➡️We are in accumulation stage over 296 days
➡️Most crucial level from sellers at 0.56
➡️To reach 0.23lvl we need to see with current circulation supply 2.76 B market cap.
➡️First target 3.17 its a weekly imb
➡️Draw white line theory when we will see resistance and form downtrend line.
➡️Hard to say about timing but most likely we will see drop again around September
Hope you enjoyed the content I created, You can support with your likes and comments this idea so more people can watch!
✅Disclaimer: Please be aware of the risks involved in trading. This idea was made for educational purposes only not for financial Investment Purposes.
---
• Look at my ideas about interesting altcoins in the related section down below ↓
• For more ideas please hit "Like" and "Follow"!

BICO - LONG - is it an inverz Head and shoulders?The element has already accumulated.
30 min. golden cross.
The form similar than an inverz Head and shoulders (crypto is noisy enough)!
Just notice and don't forget check the TOTAL and the BTC's sentiment!
Good luck for everyone!

BICOUSDT going lower?EnF Breakout Strategy signaled SELL on BICOUSDT
See idea for breakout entry, targets and stoploss
Only enter the trade when the price breaks below entry
Check out more on the script:
To get access to this script, DM me

BICOUSDT | New High Soon?Market Context
Is BICOUSDT gearing up for a new daily high? The charts are looking promising!
Weekly Analysis
On the weekly timeframe, we've finally broken above and retested the 20 EMA—a classic signal for a move higher. With altcoin season just around the corner, BICO is poised for a significant upward move.
Strategy
I'm jumping in and longing the market now! The stars are aligning for BICO, and we could be on the brink of an exciting rally.
Let’s ride this wave to new heights!

Biconomy (BICO)On the above 4-day chart price action has corrected by 95% since January 2022. Today is great long opportunity. Why?
1) RSI and price action resistance breakout.
2) Multiple oscillators print bullish divergence across a 3-month period.
3) Seller weakness. Notice the long candle wick into seller territory?
4) Price action prints support on past resistance. Look left.
Is it possible price action falls further? Sure.
Is it probable? No.
Ww
Type: trade
Risk: <=6% of portfolio
Timeframe: Now, don’t sit on your hands.
Return: Will say elsewhere.

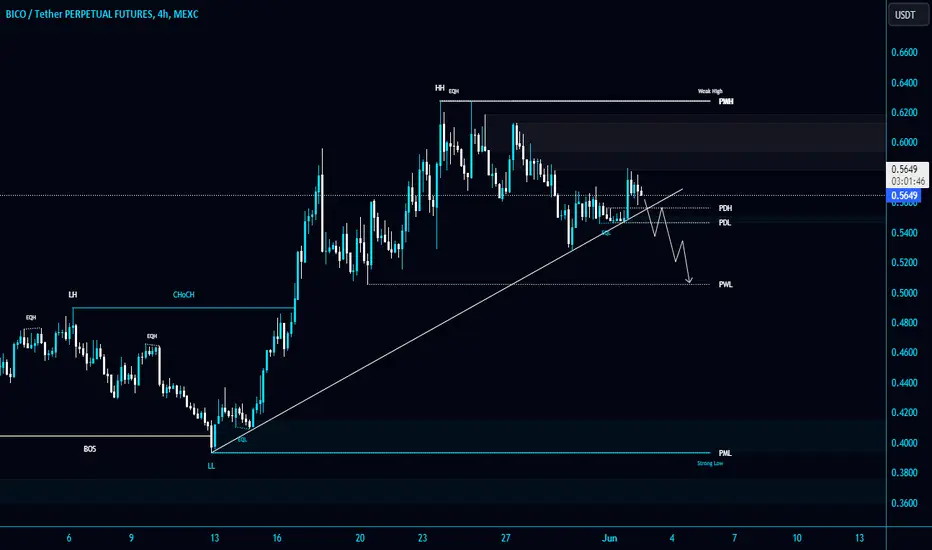
#BICO/USDT is trying to hold the Diagonal Trendline in 4-Hour TF#BICO/USDT is trying to hold the Diagonal Trendline in 4-Hour TF!
OMXSTO:BICO needs to hold this level to remain bullish. If it breaks down and retests, we can short it. The local support level is PWL $0.506.
BICOUSDT.4HBICO/USDT 4-hour chart, several critical technical indicators and levels stand out, providing insights into potential price movements.
Trend and Resistance Analysis:
The chart shows that Biconomy (BICO) has been experiencing some volatility, with the current price around 0.5710 USD. The price is currently attempting to break above the immediate resistance level marked as R1, around 0.5966 USD. A successful breakout above this level could lead the price to test the next significant resistance at R2, which is around 0.7554 USD. The recent upward movement suggests increasing bullish sentiment.
Support Levels:
On the downside, the primary support level is identified as S1 at 0.3904 USD. This level has shown strong buying interest previously and could act as a floor if the price starts to decline. Below S1, the next significant support level is at 0.3448 USD, which has been a critical support zone in the past.
Volume Analysis:
The volume pattern indicates that the recent price increases were accompanied by substantial trading volume, reinforcing the bullish sentiment. High volume on price increases typically suggests strong market participation and confidence in the upward trend.
Conclusion:
In conclusion, the BICO/USDT pair is currently showing signs of a potential bullish breakout if it manages to stay above the R1 resistance level. The key resistance levels to watch are 0.5966 USD and 0.7554 USD. A break above these levels would confirm continued bullish momentum. On the downside, the support levels at 0.3904 USD and 0.3448 USD are critical for maintaining the bullish outlook. A failure to hold these support levels could lead to a deeper retracement.
Overall, the market sentiment for BICO remains optimistic, with critical attention needed at the aforementioned levels and indicators to make informed trading decisions.

BICO ANALYSIS (12H)BICO appears to be inside a diametric or large expansion triangle. For wave e is pumping.
The targets are clear on the chart.
Touching the invalidation level will cause the analysis to be violated
For risk management, please don't forget stop loss and capital management
When we reach the first target, save some profit and then change the stop to entry
Comment if you have any questions
Thank You

📈 BICOUSDT approaches resistance level.📈 BICOUSDT approaches resistance level. 🎯 potential breakout. 🚀 Stay tuned for updates! #CryptoTrading #BreakoutAlert 📊

BICONOMY (BICO)Biconomy (BICO) is a multi-chain infrastructure platform aimed at simplifying the user experience in decentralized applications (DApps) by enabling gas-efficient transactions and improving interaction between blockchain infrastructures. This platform addresses the complexities of transactional processes on the blockchain, thereby enhancing usability and accessibility for both developers and end-users.
Currently, the price of Biconomy (BICO) is $0.44 with a 24-hour trading volume of $25 million. BICO has experienced a surge of 22% in the last 24 hours, which signals strong investor interest and confidence in its multi-chain transaction solutions.
Given Biconomy's role in facilitating seamless blockchain interactions and its impressive recent price performance, the next potential price targets for BICO might be set at $0.70, $0.80, $0.90 and $1.20. Traders could consider initiating positions at the current level. This trade idea is based on the anticipation of continued growth in demand for user-friendly blockchain interaction solutions, with Biconomy well-positioned to benefit from this trend.


THE RETURN OF BICO Thank you for reading our update. Please keep in mind that this is not trading advice.
It appears that BICO is poised for a significant return. The upcoming period will be crucial for observing new confirmations within the given timeframe for the important target of $0,50 and up.

