BigTime chartBigTime if it holds support at the green line might pump Big Time. It`s similar to the HNT setup, but HNT when the chart was made it broke out from the resistance already. This is on support / stop loss , right now that means we don`t know for sure unless the resistance is broken. But if it does it the potential is huge
BIGTIMEUSDT.P trade ideas

BIGTIMEUSDTshort idea on BIGTIMEUSDT.P
taking a sell on the marked supply order block after price takes out inducement (marked as xxx).

BIGTIMEBYBIT:BIGTIMEUSDT.P
Keep eye on it!
Cipher SMC is a trading strategy that involves understanding market structure, supply and demand concepts, and liquidity concepts. It is a mechanical strategy that helps traders identify potential trends and reversals by providing insights into the buying and selling pressure in the forex, stock and crypto market. The strategy allows traders to locate imbalances in the market and provides more information about the market when it opens and when it closes. It is recommended to have a solid foundation with regards to market structure before using this tool. Use these concepts alongside other concepts such as Order Flow, Structure, Liquidity etc to build your overall story! As always, keep it Simple and Systematic and you will be just fine ;)
Kindly note that engaging in FX, stock, crypto investments, and other financial instruments entails inherent risks. We strongly recommend seeking advice from a financial advisor or conducting extensive research before finalizing any investment choices.

Bigtime again bigtime Bigtime/usdt
Buyer's are looking strong again, We can expect a good bullsh mive soon, let's see
Not financial advice (DYOR)

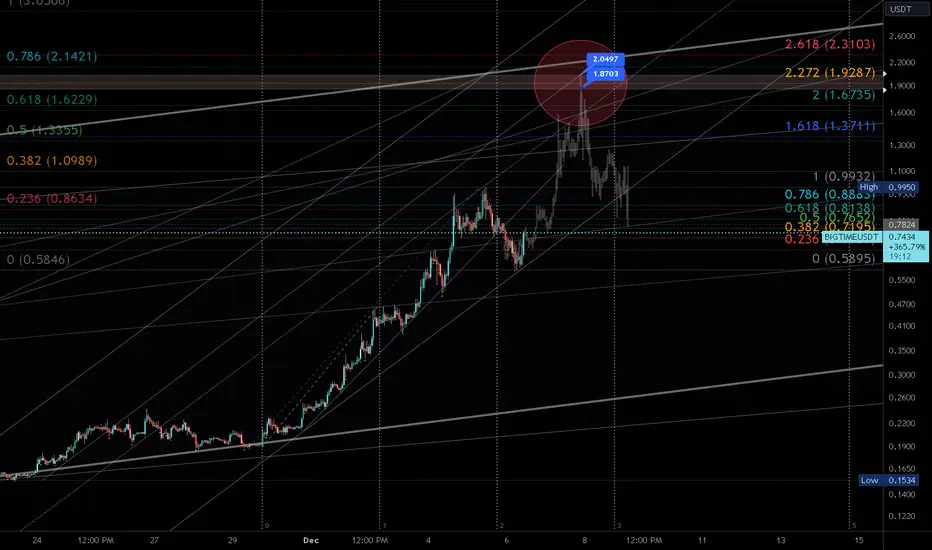
BIGTIME December first bubbleThis is the example of bubble phase,
Bigtime already bullish with more than 500% to $1 at all time high only in 14 days,
you can see that bigtime already finish "bulltrap phase"
and right now we are in "return to normal phase"
next phase is fear, capitulation, despair, and return to the mean.

BIGTIMEUSDTmy entry on this trade idea is taken from a point of interest BELOW an inducement (marked as xxxx).. I extended my stoploss area to cover for the whole swing as price can target the liquidity there before going as i anticipate.. same idea Ive always been using.. just a trade idea, not financial advise

BIGTIMEUSDTshort idea on BIGTIMEUSDT.P
taking a sell on the marked supply order block after price takes out inducement (marked as xxx).

BUT WHICH DIRECTION IS THE TREND HEADED?It's not a simple question and REALLY matters ALL of the time, so, finding a simple answer is a neat tool to have in the snuff-toolbox..
Here's the quickest, easiest down-n-dirry method for getting closer to an answer.
If you look at the ranging areas of the chart. The in-between, sideways, messy, wish-it-didn't-exist areas and draw a rough shape tracing the progression, then you'll likely notice either a "U" shape or an "n" shape (not everywhere, but at least one prominent one per section/timescale). You'll know if when you see it. Keep practicing and don't force it.
The U Shape can be reliably trusted to identify a Bullish trend, whilst the n Shape does the same when there's blood about.
Sound silly, right..
But it works.
And now you know..

BIGTIME breakout...BIGTIME is compressed between the 4H Time frame trendline and Support zone,in the case of breakout we may see a good pump 🚀

BIGTIME/USDT$BIGTIME broke out of falling wedge and has now formed a horizontal channel and has been ranging for almost 3 days!
I have set alerts on the upper mid and low channel, this is a volatile coin and I will pull the trigger when I am confident on direction


Bigtime next leg upBigtime ready for next leg up
Stoch RSI Bullish
RSI Neutral
Macd Neutral / Bullish

Bigtime ready for next leg upBigtime ready for next leg up
Stoch RSI Bullish
RSI Neutral
Macd Neutral / Bullish

BigTime is having a big time
Big time has recently broken its ATH as for KuCoin, and is testing the level multiple times on the 1H TF. no confirmation yet from higher TFs, but it may rocket to the way up.

BIGTIME breakoutBIGTIMEUSDT chart suggests a bullish trend, with the CMF above zero indicating buying pressure. The price is forming higher lows toward resistance, hinting at potential breakout.

BIGTIME/USDT Risky Long Position IdeaBigtime is making a nice formation and if it stays about that red box support and breaks that resistance line then we can open a long position at 0.6433
Good luck ;)

Mock Up Price Action for BIGTIME | Mid Term (12HR)Mock Up Price Action for BIGTIME | Mid Term (12HR)
- This is what I'm hoping for!
Bigtime ready to short1/5 risk reward ratio
Bigtime ready to short
just be carefull
if btc cross 45K otherwise in the correction the

Bigtime waiting to buy Big time waiting to buy
The trend to continutes
Keep calm and fair
Dont short its bro
Its gaming trend
so risk

BIGTIME Support and press the rocket to cheer me up
Observe the ten percent loss limit
Stay away from Bitcoins
Feel free to buy and sell and post your comments

Mock Up Price Action for BIGTIME | Mid Term (12HR)Mock Up Price Action for BIGTIME | Mid Term (12HR)
- Watching and waiting for opportunity to enter short

Bearish Market structure for $BigtimeBigtime looks bearish to me looking at the market structure in the 1H timeframe

SHORT BIGTIMEthis time to Short Bigtime
wallet "0xd8d6" sent 2M $BIGTIME ($1.526M) to 🏦 OKX: Deposit" and Chart is having very strong selling force
