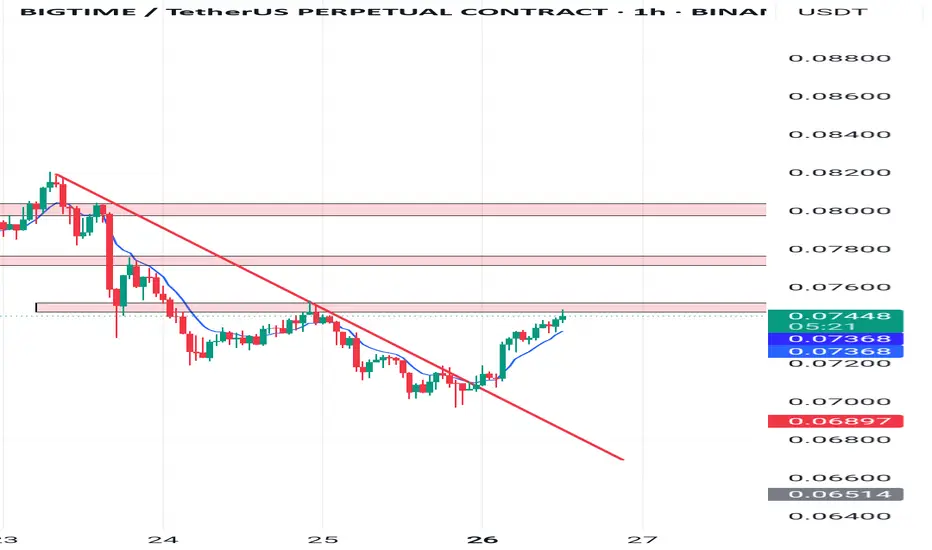
BIGTIME/USDT Analysis (1H Timeframe)Price has successfully broken the descending trendline, signaling a trend reversal from bearish to bullish. The market is now testing a key supply zone around $0.07450 – $0.07550.
Trend Shift: A bullish breakout from the downtrend line indicates buyers are gaining control.
Support: Previous resistance near $0.07370 may now act as strong support on any pullback.
Resistance: Price is currently at resistance; if broken, next key zones are around $0.07650 and $0.07850.
Bias: Bullish, as long as price holds above the broken trendline and EMA. However, short-term rejection from current resistance is possible before continuation.
BIGTIMEUSDT trade ideas
$BIGTIME LONG TRADE
**🎯 Entry:** 0.1625 – Entering at a strategic level for potential upside.
**📈 Targets:** 0.1694, 0.181, 0.1937 – Key levels to watch for profit-taking.
**🛑 Stop Loss:** 0.1568 – Manage risk by sticking to this stop to limit downside.
💡 *Always manage your risk and adjust your position size accordingly to protect capital.*

BIGTIME/USDTKey Level Zone: 0.07500 - 0.07690
HMT v8.1 detected. The setup looks promising, supported by a previous upward/downward trend with increasing volume and momentum, presenting an excellent reward-to-risk opportunity.
HMT (High Momentum Trending):
HMT is based on trend, momentum, volume, and market structure across multiple timeframes. It highlights setups with strong potential for upward movement and higher rewards.
Whenever I spot a signal for my own trading, I’ll share it. Please note that conducting a comprehensive analysis on a single timeframe chart can be quite challenging and sometimes confusing. I appreciate your understanding of the effort involved.
Important Note :
Role of Key Levels:
- These zones are critical for analyzing price trends. If the key level zone holds, the price may continue trending in the expected direction. However, momentum may increase or decrease based on subsequent patterns.
- Breakouts: If the key level zone breaks, it signals a stop-out. For reversal traders, this presents an opportunity to consider switching direction, as the price often retests these zones, which may act as strong support-turned-resistance (or vice versa).
My Trading Rules
Risk Management
- Maximum risk per trade: 2.5%.
- Leverage: 5x.
Exit Strategy
Profit-Taking:
- Sell at least 70% on the 3rd wave up (LTF Wave 5).
- Typically, sell 50% during a high-volume spike.
- Adjust stop-loss to breakeven once the trade achieves a 1.5:1 reward-to-risk ratio.
- If the market shows signs of losing momentum or divergence, ill will exit at breakeven.
The market is highly dynamic and constantly changing. HMT signals and target profit (TP) levels are based on the current price and movement, but market conditions can shift instantly, so it is crucial to remain adaptable and follow the market's movement.
If you find this signal/analysis meaningful, kindly like and share it.
Thank you for your support~
Sharing this with love!
HMT v2.0:
- Major update to the Momentum indicator
- Reduced false signals from inaccurate momentum detection
- New screener with improved accuracy and fewer signals
HMT v3.0:
- Added liquidity factor to enhance trend continuation
- Improved potential for momentum-based plays
- Increased winning probability by reducing entries during peaks
HMT v3.1:
- Enhanced entry confirmation for improved reward-to-risk ratios
HMT v4.0:
- Incorporated buying and selling pressure in lower timeframes to enhance the probability of trending moves while optimizing entry timing and scaling
HMT v4.1:
- Enhanced take-profit (TP) target by incorporating market structure analysis
HMT v5 :
Date: 23/01/2025
- Refined wave analysis for trending conditions
- Incorporated lower timeframe (LTF) momentum to strengthen trend reliability
- Re-aligned and re-balanced entry conditions for improved accuracy
HMT v6 :
Date : 15/02/2025
- Integrated strong accumulation activity into in-depth wave analysis
HMT v7 :
Date : 20/03/2025
- Refined wave analysis along with accumulation and market sentiment
HMT v8 :
Date : 16/04/2025
- Fully restructured strategy logic
HMT v8.1 :
Date : 18/04/2025
- Refined Take Profit (TP) logic to be more conservative for improved win consistency

$BIGTIME LONG TRADE
**🎯 Entry:** 0.1625 – Entering at a strategic level for potential upside.
**📈 Targets:** 0.1694, 0.181, 0.1937 – Key levels to watch for profit-taking.
**🛑 Stop Loss:** 0.1568 – Manage risk by sticking to this stop to limit downside.
💡 *Always manage your risk and adjust your position size accordingly to protect capital.*

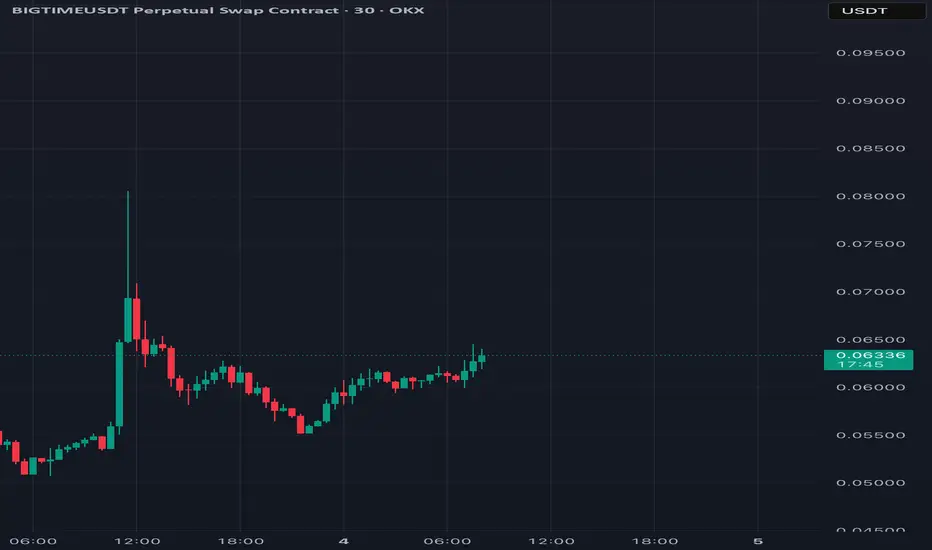
BIGTIME/USDT Analysis – 30-Minute Chart (OKX)BIGTIME/USDT Analysis – 30-Minute Chart (OKX)
Key Support Levels:
Immediate support: 0.06043 USDT
Stronger support: 0.05960 – 0.05515 USDT (Potential entry zone)
Stop-loss (SL): Below 0.04916 USDT (-12.19% risk)
Key Resistance Levels:
First resistance: 0.06485 USDT (Take Profit 1)
Next resistance: 0.06902 – 0.07002 USDT (Major supply zone)
Higher targets: 0.07511 – 0.08055 USDT
Indicators & Market Structure:
Stochastic RSI is in an overbought zone, suggesting a possible short-term pullback.
EMA 20, 50, 100, 200 show bullish momentum, with the price above EMA 20 and EMA 50.
Bearish pressure is decreasing, as buy signals and TP targets are being triggered.
Trade Plan:
Bullish case: If BIGTIME/USDT holds 0.06043 USDT, it may continue towards 0.06485 – 0.07002 USDT.
Bearish case: If price falls below 0.05960 USDT, a deeper correction to 0.05515 USDT is likely.
📌 Summary:
BIGTIME is in a short-term uptrend, but Stochastic RSI suggests a possible pullback before continuation. Holding 0.06043 USDT is key for further upside toward 0.07002 USDT. If price loses support, a retest of 0.05515 USDT is possible. 🚀
Maybe $0.11!A strong rejection from $0.074 and a re-test of $0.060! If it could pump toward $0.074 once more and break it with a strong bullish candle, $0.109 will be reachable. Since it is fluctuating almost on the price that was launched at most exchanges, it's unlikely to be deeply corrected from here.

BIGTIMELiquidity entered the currency and it was maintaining the price in the past days, meaning it was oversold.

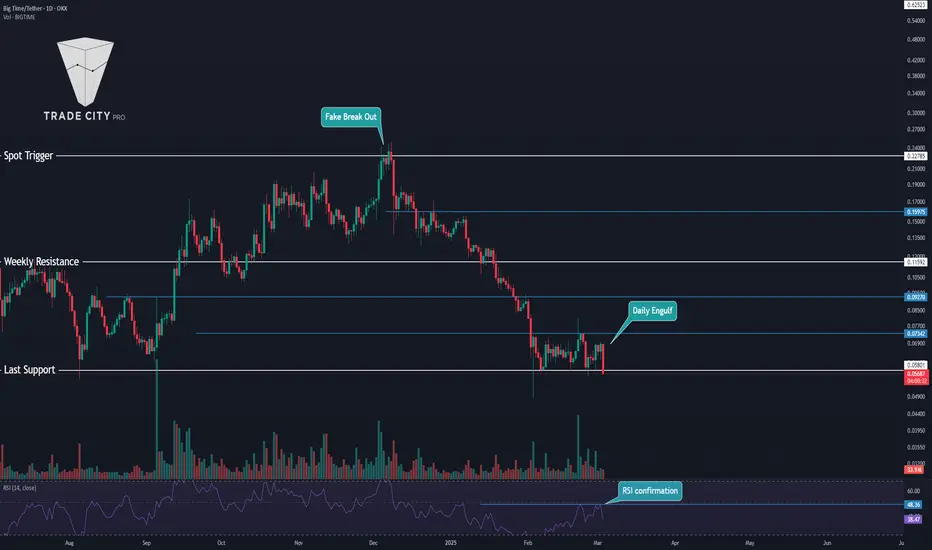
TradeCityPro | BIGTIMEUSDT Final Downtrend?👋 Welcome to TradeCityPro Channel!
Let's analyze and review the new gaming coin BIGTIME and see what the market is going to be like. I feel like we're going to see the final downtrend.
🌐 Bitcoin Overview
Before starting today's altcoin analysis, let's look at Bitcoin on the 1-hour timeframe. Since yesterday, Bitcoin experienced a correction, which was necessary for the market, and it pulled back to the 102135 range. The next trigger for a long position will be a breakout above 104714.
Yesterday's correction, coupled with an increase in Bitcoin dominance, caused noticeable declines in some altcoins. This highlights the importance of monitoring BTC pairs in your checklist these days.
📊 Weekly Timeframe
This coin is not in an interesting situation on the weekly time frame and after being rejected from the resistance of 0.22109, it is continuing its downward trend and is recording a lower high and low
If the weekly candle closes like this and we lose the support of 0.06479, the declines will continue and if you are holding this coin, I suggest you exit temporarily and if it enters again, you will simply enter with a smaller number of this coin and your number of Tethers will be preserved
They are not really in good conditions for buying right now, but if the support is faked, we can get a trigger from them, but normally the best trigger is after the failure of 0.22109, but I repeat, the fake of this support can form a new trend!
📈 Daily Timeframe
The situation is the same on the weekly time frame and the probability of a fall is higher than ever, and after the rejection of this important resistance at 0.22785, we have experienced a 75% drop so far!
After this drop, we went into the range box between 0.05801 and 0.07342, and it is natural to suffer a little until our RSI rejected the middle line of 50, which again increased the probability of a fall.
Also, today's daily candle is very important, and if it closes like this, we are engulfing a few of our previous candles and the probability of a support floor breakdown is higher than ever, so you can open a short position and exit the spot, and your second entry for the spot breakdown will be 0.09270!
📝 Final Thoughts
Stay calm, trade wisely, and let's capture the market's best opportunities!
This analysis reflects our opinions and is not financial advice.
Share your thoughts in the comments, and don’t forget to share this analysis with your friends!
Big Time (BYBIT-BIGTIMEUSDT.P): A Hidden Giant Poised for ActionThe Market's Crossroads: Ready for the Next Big Wave?
Imagine holding an asset that’s down over 90% from its historical highs yet brimming with subtle signs of revival. Big Time (BYBIT-BIGTIMEUSDT.P) is trading at $0.09929, a far cry from its $0.9995 peak, but its deviation creates a golden window for both opportunistic traders and long-term investors. With RSI hovering near a neutral 47, the market appears undecided, creating an atmosphere thick with potential.
Adding intrigue, the "VSA Buy Pattern Extra 1st" and other bullish patterns from recent trading sessions highlight momentum brewing below the surface. The asset seems primed to break past resistance levels of $0.11624 and higher, while the moving averages suggest this consolidation could be the calm before a storm.
Could this be the moment the market pivots? With fundamentals steady and technical signals aligning, Big Time may just be living up to its name. Are you ready to ride the wave? The clock is ticking.
Roadmap: Big Time's Pattern Analysis and Market Journey
January 23, 2025, 21:00 UTC: VSA Buy Pattern Extra 1st - The Setup The market flashed a VSA Buy Pattern Extra 1st with a main_direction: Buy, aiming for a breakout above key resistance levels. However, the subsequent candle failed to align with the bullish projection as the price closed lower, nullifying the pattern’s expected trigger. This pattern was skipped as it did not deliver on its forecast.
January 24, 2025, 11:00 UTC: Increased Buy Volumes - A Bullish Signal Emerges This pattern signaled heightened buying pressure, with the price closing higher at $0.10378, a decisive move aligning with the bullish direction. The increased volume reinforced the strength of the move, setting the stage for a potential trend reversal. This pattern validated its signal and established a positive market tone.
January 24, 2025, 22:00 UTC: VSA Buy Pattern Extra 2nd - Momentum Builds As the price rallied from the earlier Increased Buy Volumes, this pattern continued to support the bullish narrative. The price hovered above the $0.09916 low, confirming the strength of the prior setup. The trend gained traction, with the next bars maintaining the upward trajectory—a textbook example of pattern validation.
January 25, 2025, 00:00 UTC: VSA Buy Pattern Extra 1st - The Breakout Play Closing at $0.09567, this pattern projected another main_direction: Buy. The subsequent movement saw the price stabilize, with no significant downward corrections, proving the resilience of the bullish momentum. As the price tested key levels without breaking the upward trendline, traders had a clear signal to ride the wave.
Takeaway
Big Time's recent patterns reflect a game of patience and precision. By sticking to validated setups like the Increased Buy Volumes and tracking the interplay of price and direction, traders can navigate with confidence. Whether you're looking for short-term pops or longer-term positioning, the roadmap above provides clarity on when to jump in and ride the action. Are you ready to capitalize on the next big move?
Technical & Price Action Analysis: Key Support and Resistance Levels
Support Levels
The current playbook for support shows price flirting with soft zones that could act as springboards if the market behaves. These include:
Support 1: $0.0727
Support 2: $0.0657
If the price slices through these levels without any bounce, they flip to resistance—tough barriers that could choke any upside attempts.
Resistance Levels
Where the bulls need to show up big to clear the air:
Resistance 1: $0.11624
Resistance 2: $0.12546
Resistance 3: $0.12934
Resistance 4: $0.13203
Resistance 5: $0.13467
If the market can't sustain above these levels, expect them to act as headwinds, keeping prices boxed in.
Powerful Support Levels
Stronger levels that could hold the fort if volatility spikes:
Powerful Support 1: $0.11475
Powerful Support 2: $0.3138
Powerful Support 3: $0.6463
Break these, and it’s game over for the bulls, with these levels flipping to powerful resistance zones.
Powerful Resistance Levels
Big dogs on the chart—the ones to break for a breakout run:
Powerful Resistance 1: $0.0727
Powerful Resistance 2: $0.0657
If these get tested and fail to crack, they’ll anchor the market to lower trading ranges.
Summary
These levels are your roadmap—play them right, and they’ll be your guide. But remember, in trading, what doesn’t hold as support becomes the wall to climb as resistance. The market doesn't owe anyone, so trade smart and stay nimble!
Concept of Rays: Trading Strategies and Scenarios
The "Rays from the Beginning of Movement" concept provides a unique approach to identifying dynamic levels where price interaction signals potential reversals or continuations. Built on Fibonacci principles, these rays adapt to new trends, offering traders actionable insights.
How Rays Work in Practice
Fibonacci Rays and Their Dynamic Role
Constructed from the start of movement patterns, rays provide dynamic support and resistance zones. Unlike traditional methods, rays adjust in real-time, defining boundaries for trend channels and helping traders anticipate movements.
Moving Averages as Dynamic Factors
Key MAs (e.g., MA50, MA100, MA200) interact with rays, confirming potential entry points. When price crosses a ray near a critical MA, it’s a signal for possible trend continuation or reversal.
From Ray to Ray Movement
Once price interacts with a ray, traders can expect movement toward the next ray, offering clear trade targets. Entry occurs after confirmation of interaction, with the first target being the next ray, followed by subsequent levels.
Optimistic Scenario: Bullish Trade Setup
Price is currently trading near MA50 ($0.10033) and a key ascending ray. If interaction occurs and the price breaks upward:
First Target: $0.11624 (Resistance Level)
Price interaction with this resistance may trigger further bullish momentum.
Second Target: $0.12546 (Next Resistance)
A continuation beyond the first ray indicates strengthening bullish sentiment.
Third Target: $0.12934 (Final Ray for Trade)
This would signal an extended move, reaching the boundary of the current bullish channel.
Pessimistic Scenario: Bearish Trade Setup
If price fails to hold above the MA50 and descends through the ray:
First Target: $0.0727 (Powerful Support)
A breakdown here could reinforce bearish pressure.
Second Target: $0.0657 (Next Support)
Price continuation toward this level suggests a deeper corrective phase.
Third Target: $0.0548 (Absolute Low)
A breach of this ray signals a potential long-term bearish trend.
Sample Trade Ideas
Long Trade
Entry: Upon confirmation of interaction with ascending ray and MA50.
Targets: $0.11624 (T1), $0.12546 (T2), $0.12934 (T3).
Stop Loss: Below the ray and MA50.
Comment: Bullish momentum driven by ray alignment and MA support.
Short Trade
Entry: After price breaks below descending ray and MA50.
Targets: $0.0727 (T1), $0.0657 (T2), $0.0548 (T3).
Stop Loss: Above the ray and MA50.
Comment: Bearish continuation fueled by interaction with descending rays.
Conclusion
These strategies are built on precise ray alignments and dynamic MA factors visible on the chart. Every level becomes a crucial step in managing trades effectively. By following the movement from ray to ray, traders can capitalize on high-probability setups while adapting to changing market dynamics. Let the rays guide your way!
Let’s Keep the Conversation Going!
Have questions or thoughts? Don’t hesitate—drop them in the comments! Your insights and ideas matter, and I’m here to discuss them with you. Whether it’s clarifying levels, refining strategies, or just sharing perspectives, let’s connect and grow together.
If you found this analysis helpful, hit Boost and save the post to revisit later. Watch how the price respects the rays and levels we’ve outlined—because nailing those key zones is what trading is all about.
For those curious about my indicator-strategy that automatically maps out all the rays and levels: it’s available privately. If you’d like access, just send me a direct message, and we’ll figure something out. It’s a game-changer for precise trading on any asset.
Need analysis for your favorite asset? Let me know in the comments or DM me. Some ideas I share openly, while others can be personalized if you prefer to keep them private. The rays work universally, and I can create a tailored setup for you, no matter the market.
Lastly, don’t forget to follow me here on TradingView. This is where all my updates, insights, and new strategies land first. Let’s build a trading community that thrives on knowledge and results. 🚀
Looking forward to your comments and boosts—let’s make trading smarter together!

BIGTIMEUSDT 4DBIGTIME ~ 4D
#BIGTIME If you still have Conviction on this coin, buy it gradually from here with a minimum target of 20%++
Bigtime breakout still eminent! I like the reaction I am seeing on the downtrends if u follow closely you see we broke out to 17cents then back test and still showing strength where I expected. Let’s go …below 10ce t invalidated

Bigitime macro move in play Bigtime has broken several trends on the weekly and has been consolidating at a critical support. Now breaking out these are my targets

BIGTIMEBIGTIME LONG w very tight invalidation
Under stored lQ as seen in the equal lows hides a ob that allignes 1h/30m/15m TF
My entry is .16200 using a 12x levarage
TP AND SL VISIBLE ON CHART
GOOD LUCK

Monthly Open swept - ATH next?BIGTIME looks good to me, Monthly open swept, now it is holding above.
First target around 30cent, then ATH!
Enjoy your weekend fam!
Let me know what you think.

Big Time (BIGTIME)Big Time is a multiplayer action RPG for PC that melds a fast-combat system with an open game economy where players have an active role in generating and exchanging game items.
Anyway, after the initial short upward wave, BIGTIME went into a correction phase, a long one. Just recently, BIGTIME broke the big inverted descending triangular correction pattern. This confirms the end of the correction and the start of the next upward phase. Let's see how high BIGTIME can go.

Bigtime/Usdt is good to go for LONGTrendline Support in 2H TF, Target is previous HIGH and SL is mentioned on chart. BINANCE:BIGTIMEUSDT.P

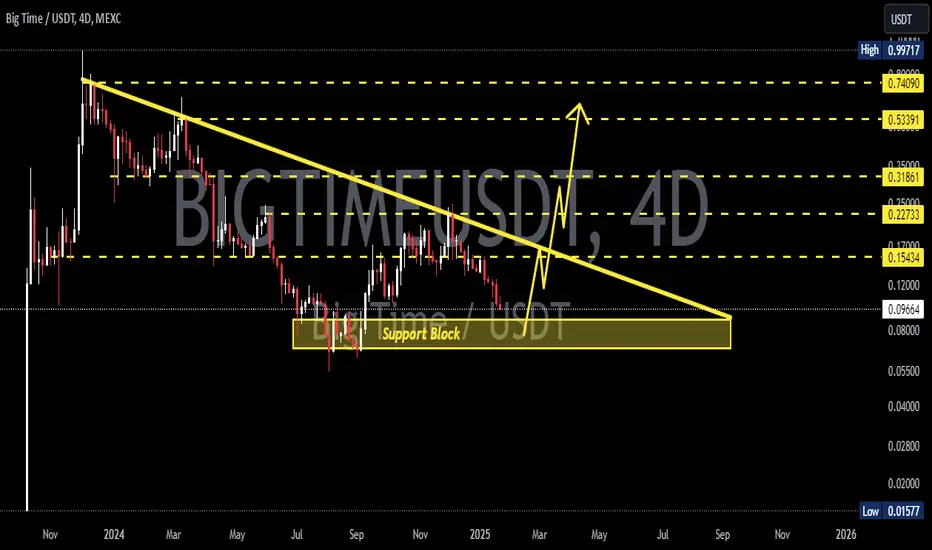
BIGTIME current chart and possible indicators (daily)MEXC:BIGTIMEUSDT is not the easiest chart to analyze - due to it's short story and thus lack of information. BIGTIME had a huge ralley to 1 dollar back in December 2023 and was, since then, in an downtrend.
That downtrend found its bottom in August 2024 at around 5 cent and consolidated out of the downtrend (bottomed out) at that time. Since then (or at least since september) we can see a steady climb with higher highs and higher lows towards the VAH (value area high) of the whole market at around 26 cents.
if we use fibonacci to evaluate the bottom as the low and the last higher high as the high, we see a 50% fib retracement level (if it retraces from here) at around 13 cents. given the current sentiment, the fact that bigtime is a very hyped game coin and that there is high potential to rip this bullmarket, given the steady climb since september - I see BIGTIME climb higher towards the 50% fib ob the all time high (52 cents) and further progression towards the Golden Pocket at 64-67 cents and a next hold at 79 cents (for now).
of course that doesn't mean that BIGTIME won't go higher, quite the contrary. it just shows the potential we face right now. I think BIGTIME could easily hit 3 $ this run - which would make it an 14x from here even tho we had a quite substantial run from the bottom (340%)
if the channel breaks, it doesn't invalidate the bullish sentiment.

$BIGTIME Breakout Alert!#BIGTIME has broken out of the inverse head & shoulders pattern and is currently retesting the neckline!
📈 Entry: Accumulate above $0.22
🎯 Targets:
Midterm: $0.40 (80% upside)
Long-term: $0.99 (300% upside)
🛡 Stop-loss: $0.18
Available for both spot and futures trading. Long with caution and proper risk management!
ABOUT $BIGTIME
Big Time is an action RPG combining fast-paced gameplay with a Web3 economy. Its seamless integration of blockchain elements ensures broad accessibility and entertainment.
🚨 DYOR, NFA.

BIGTIME CUP AND HANDLE PATTERN Key Points:
Cup and Handle Pattern:
The chart indicates the formation of a Cup and Handle pattern, a bullish continuation pattern.
The "cup" formation began around April 2024 and completed in November 2024.
The "handle" part is forming currently and has recently broken out, suggesting a continuation of the upward trend.
Support and Resistance Levels:
Current Price: The current price is $0.19273.
Immediate Support: Around $0.17397, which aligns with the previous consolidation area during the handle formation.
Major Support: Around $0.13341, which is the low point of the cup formation.
Resistance Level: The immediate resistance level is around $0.19230, which the price has just broken.
Target Price:
The Cup and Handle target price is calculated by measuring the depth of the cup and adding it to the breakout point.
The target price is around $0.32614, representing a significant upside from the current price.
Technical Indicators:
200 EMA: The 200-day Exponential Moving Average is currently at $0.16013. The price trading above this level indicates a bullish trend.
Volume: The recent breakout is accompanied by an increase in volume, which adds strength to the bullish signal.
Conclusion:
The Cup and Handle pattern suggests a bullish continuation, with a target price of $0.32614. The price has just broken out from the handle, supported by increased volume, and is trading above the 200-day EMA. Immediate support is at $0.17397, and major support is at $0.13341. This setup indicates a potentially strong bullish movement ahead for BIGTIME/USDT. However, it's essential to keep an eye on the support levels and ensure that the breakout is sustained.

#BIGTIME Market bought small size here, will add more to the position if we have breakout from the downtrend

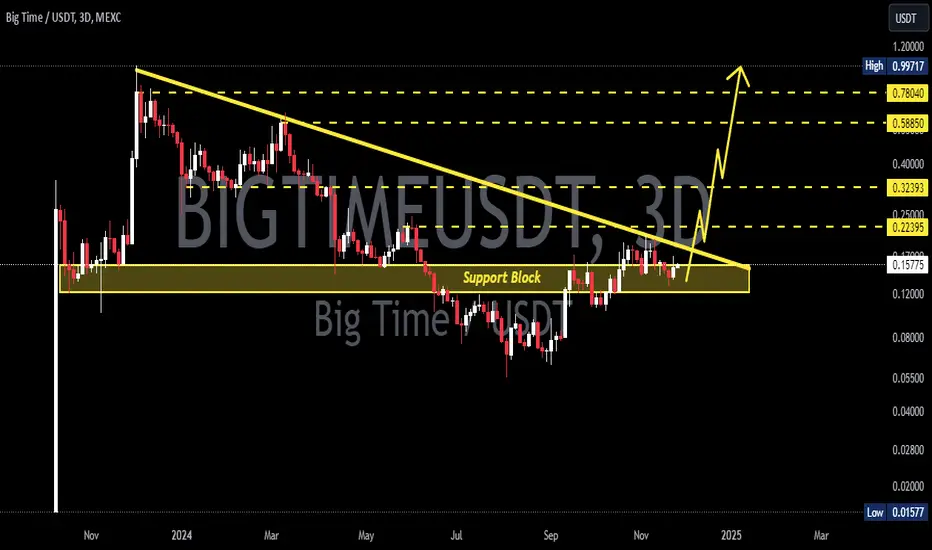
BIGTIMEUSDTBIGTIME ~ 3D
#BIGTIME If you still have Conviction on this coin,. This support block would be a very good buy spot for now,. Buy in stages with a minimum target of 20%++
Leading Diagonal BIGTIMEBIGTIME might be in a setup where wave 5 out of a 5 wave impulsive structure (Leading Diagonal) is about to be formed.
The price is also at the lower support of the parallel channel of the Leading Diagonal. Target is 1.618 out of wave 4

BIGTIME Long 15minBIGTIME Long Setup
Reason:
Broke out of trend line and triangle
All Price action Indicators suggesting strong Bullish Momentum.
looking for strong bullish move in short term
