BITCOIN Bitcoin’s price is rising higher due to several key factors:
Strong Institutional Demand and ETF Inflows:
Large inflows into US spot Bitcoin ETFs, led by firms like BlackRock, have injected billions of dollars into the market, supporting price gains and driving a breakout above previous highs. ETF inflows have been consistent, with $2.6 billion added over recent weeks, signaling growing institutional adoption.
Corporate Treasury Adoption:
Nearly 260 companies now hold Bitcoin on their balance sheets, collectively owning over 850,000 BTC worth around $96 billion. This corporate demand adds a structural layer of buying pressure.
Expectations of Federal Reserve Rate Cuts:
Market participants are pricing in a high probability of Fed interest rate cuts later in 2025. Lower rates tend to reduce the opportunity cost of holding non-yielding assets like Bitcoin, making it more attractive as a store of value and speculative asset.
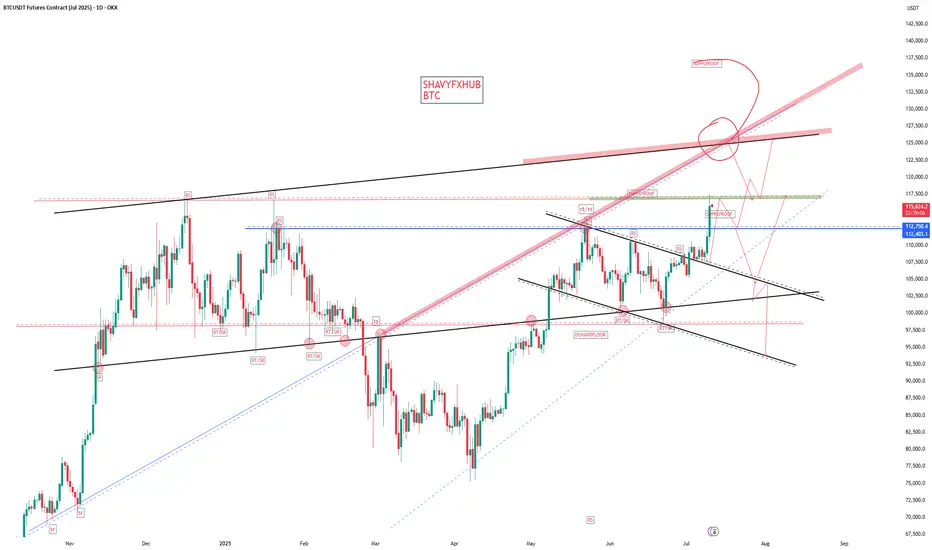
Technical Bullish Patterns:
Technical analysis shows bullish setups such as a bull flag breakout on daily which historically signals continuation of upward momentum.
Macro and Regulatory Environment:
Growing regulatory clarity, especially in the US, and ongoing geopolitical and inflation uncertainties reinforce Bitcoin’s appeal as “digital gold” and a hedge against traditional market risks.
Market Sentiment:
The Fear & Greed Index indicates growing investor confidence (“Greed” zone), and Bitcoin has experieced a majority of green trading days recently, reflecting positive momentum.
Summary
Factor Impact on Bitcoin Price
Institutional ETF inflows Strong buying support
Corporate treasury adoption Structural demand
Fed rate cut expectations Lower opportunity cost for BTC
Technical bullish patterns Momentum for further gains
Regulatory clarity & macro risks Increased trust and safe-haven appeal
#bitcoin #btc
BTCUSDT26U2025 trade ideas

BTCUSDT Bitcoin (BTC) has reached a new all-time high, trading around $111,000 to $112,000 per coin.
Key Highlights:
Bitcoin hit an intraday record high surpassing its previous peak of about $111,970 set in May 2025.
market capitalization exceeding $2 trillion.
The rally is attributed to a combination of factors including:
A weakening US dollar, which reduces opportunity cost for holding Bitcoin.
Increased demand from institutional investors, with nearly $1 billion net inflows into Bitcoin and Ethereum ETFs in early July.
Positive market sentiment following statements on monetary policy and expectations of potential Fed rate cuts.
Recent significant moves include the transfer of 20,000 BTC from wallets inactive for 14 years, highlighting long-term holder activity.
Price Data Snapshot:
Current Price: Around $111,000
Day’s High: Approximately $112,152
Market Cap: About $2.02 trillion
Volume (24h): Over $57 billion
Year High: $112,021 (intraday)
Summary:
Bitcoin continues its strong upward momentum in mid-2025, breaking new records amid supportive macroeconomic conditions such as a softer dollar and growing institutional adoption. The cryptocurrency remains volatile but shows robust demand as a digital asset and inflation hedge.
#BTC


$BTC 4H (locally) CRYPTOCAP:BTC 4H (locally)
Overnight again drained "out of nowhere", as it has become a tradition of the last month.
An ascending wedge is forming on 4H - a shorting pattern, confirmed by a breakdown of the lower boundary. However, this has been done many times before, and there was a deception: the market makes a shorting moove and sharply turns around.
They can repeat the same scenario or just knock out stops and fly upwards. Obvious figure = obvious stops, and above is a cluster of shorts.

Next move is comming..Bitcoin makes traingle pattern..#BitcoinHello traders.
here is fast update about bitcoin it's
buying or bull market is running here so trade when selling level
is breakdown ..
otherwise hold for buying
and accordingly to your analysis ..
This is only for learning purpose ...''
Trade smartly Guys..

BTC/USD 4H Short Trade Setup: Anticipating a Momentum ShiftThe trade seems to be based on a potential rejection or weakness in the current price action, with targets likely set to take advantage of a downward movhart setup:
Analysis:
1. Entry Point: The trade might have been triggered around the current price level, where the market shows signs of stalling or reversing.
2. Stop-Loss: Placing the stop-loss above the recent highs ensures protection against a false breakout or unexpected upward movement.
3. Take-Profit: The take-profit targets could be set at key support levels or based on Fibonacci retracement levels, considering the recent price action.
4. Risk Management: As always, managing risk properly is crucial, so partial profits can be taken along the way, and stop-loss levels can be adjusted to secure gains if the price moves in your favor.
5. Market Conditions: We may stay in a range before the anticipated move happens. This is going to be a short trade, aimed at catching some momentum for the start of the week. I might close it early depending on how the momentum develops, so it’s important to stay flexible and adapt to the market conditions.
This trade anticipates a possible range-bound movement before a momentum-driven shift occurs. Given the nature of the setup, it may be a brief trade aimed at capturing the initial momentum of the week. The position might be closed early, depending on how the momentum unfolds. Stay vigilant and be ready to adjust based on market conditions.
Note: Please remember to adjust this trade idea according to your individual trading conditions, including position size, broker-specific price variations, and any relevant external factors. Every trader’s situation is unique, so it’s crucial to tailor your approach to your own risk tolerance and market environment.

BTC/USDT Short Setup on 4-Hour Chart Bitcoin (BTC/USDT) is currently testing a key resistance level, presenting an opportunity for a short trade. The price has reached a significant downtrend line and resistance zone, which could lead to a reversal and continuation of the bearish trend. This setup aims to target the 52K area, where the next major support lies.
Technical Analysis:
• Resistance Zone: The chart shows BTC testing a critical resistance zone, marked by a confluence of the downtrend line and horizontal resistance. This area has historically acted as a strong barrier, increasing the likelihood of a rejection.
• Downtrend Confirmation: The overall trend remains bearish, with the price consistently making lower highs and lower lows. The current setup suggests the potential for a continuation of this downtrend.
• Target: The target for this short trade is the 52K area, which aligns with previous support levels and the next logical area for buyers to step in.
Risk Management:
• Stop-Loss Placement: Place the stop-loss above the resistance zone to protect against a potential breakout and trend reversal. A reasonable stop-loss could be set above the recent highs.
• Risk-Reward Ratio: This trade offers a favorable risk-reward ratio, with a significant potential downside if the price rejects the resistance level and continues downward.
Market Sentiment:
• Bearish Bias: The market sentiment appears to be leaning bearish, with BTC struggling to break through the resistance zone. This sentiment supports the short trade idea.
• Watch for Breakouts: If BTC breaks above the resistance level, it may invalidate this short setup, and the market could see a shift in momentum.
Note: Please remember to adjust this trade idea according to your individual trading conditions, including position size, broker-specific price variations, and any relevant external factors. Every trader’s situation is unique, so it’s crucial to tailor your approach to your own risk tolerance and market environment.

Bitcoin analysesBitcoin has not yet shown the necessary complementary signs of growth, but we had already come to the conclusion that Bitcoin should have another rise by early September. My price targets are initially 65k, then 68k and finally close to 70k. To continue to climb there and create an ath must show over seventy thousand very good moves.

Bitcoin in next weeksBINANCE:BTCUSDT
after a little bit correction, Bitcoin price can go to the at least $66k up to the $68k even $70k and maybe a new ATH.
but after that, in September , the situation of Bitcoin will not be interesting and we have the opportunity to see the increase in the price of Bitcoin until the beginning of September.

just a Standard and Typic trade.at least 1k~2k spot gain. BINANCE:BTCUSDT
its not a signal guys
its expired before
just for test

BTC Bear Move Is Far From Over!I don't endorse any entry or exit actions based on any kind of indicators, but one thing for sure is that MACD Daily on BTC is a fairly reliable monitor for BTC trend reversals on macro level. And accordingly, the bear movement is in fact far from its end. What one may expect at best for the next some weeks (until MACD and Signal lines cross on southern side of the MACD chart) is a sideways market.

BTCUSDT, Just Idea for its next Move!I dont trade BTCUSDT, but Just release my Idea on this.
Fri 21 Jun - 16:35
Good Luck!

$BTC performed Falling wedge in 2hr TF ** CRYPTOCAP:BTC performed Falling wedge in 2hr TF ** Keep eye on it
Trading a falling wedge breakout involves identifying a chart pattern called a falling wedge and executing trades when the price breaks out of this pattern. Here are the steps you can follow:
1. **Identify the Falling Wedge:**
- Look for a downtrend in the price movement.
- Identify converging trendlines where the upper trendline (resistance) slopes down at a steeper angle than the lower trendline (support).
- The pattern resembles a wedge pointing downwards.
2. **Confirm the Falling Wedge:**
- Confirm the pattern using other technical indicators like volume. Ideally, during the formation of a falling wedge, the trading volume should decrease.
3. **Wait for Breakout:**
- Patiently wait for a breakout to occur. Breakout refers to the point where the price moves above the upper trendline of the falling wedge.
- The breakout should ideally be accompanied by a noticeable increase in trading volume, confirming the strength of the breakout.
4. **Entry Point:**
- Enter a long (buy) position as soon as the price breaks above the upper trendline.
- Some traders prefer to wait for a confirmed close above the upper trendline to reduce the risk of false breakouts.
5. **Stop-Loss Placement:**
- Set a stop-loss order below the lower trendline or a recent swing low. This helps limit potential losses in case the breakout fails and the price moves back into the wedge.
Remember that trading always involves risks, and it's crucial to have a well-thought-out strategy, risk management plan, and the discipline to stick to your plan.

BTC CORRECTION???The sellers are sellin
.
It's shown at the liqudation area that shows the weakening of the BTC movement. As the catalyst for the halving in 2024, there's a big chance those whales have been hittin the first take profit area and want a lower price before pushin for a higher price.
.
.
Stay safe
X.CO

Christmas is coming sooner for BTC HODLER BTC USDT is going to hit 46K Before Christmas since the SEC minister is in favor of allowing Cryptocurrency and bringing a solid news to the spectrum.
What we might see is a reversal before the BTC Halving very soon and this can retrace to 36K after it hits it mark!
If breakout ever happens, that is going to be if its surpasses the level 48K which is highly anticipated.
