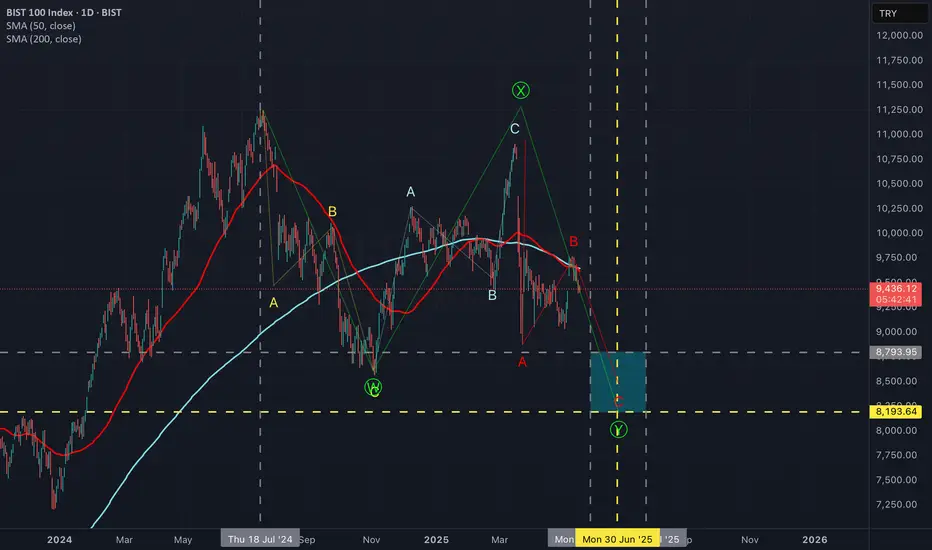
XU100 — BIST100 indexStarting from the assumption that the corrective movement which began on July 18, 2024, is a WXY pattern, I consider the current movement to be the final leg of this formation. Accordingly, I have marked in yellow on the chart what I see as the most likely reversal date and target price level. The overall potential reversal zone is indicated by the two vertical grey lines, while the target price area is marked in green.
XU100 trade ideas
Preparing for price correctionThe previous scenario is still valid, except that the price correction is taking time and is turning into a diametric.
We are currently in wave-(f) of the diametric
Good luck
NEoWave Chart

Get ready for a 20-25% price drop
The bearish scenario for the BIST 100 index remains valid. It seems that the next downward wave will begin after the formation of the contracting triangle.
Good luck
NEoWave Chart

Will BIST100 beat inflation?BIST100, which has been trending horizontally and falling for a long time, I think it can rise from here and the final rise phase will come. It is too early to say this before the new ATH comes, but I think the 10.9k region is the decision point. When it stays above it, after a move to the 11.8 region, the price should be watched carefully and be cautious. It will look like second BTC 69k ath. So in these times, I think it would be more logical to proceed with a shorter hit and run.

What to expect from bis on a downward breakIn USDTRY weakly graphic of BIST100 index as it is shown, if the index break down the recent head and shoulders resistance level it may easily go to 150 in USDTRY basis.

"BIST100: Triangle Signals 20-25% Drop"BIST100 (XU100)
In the monthly Cash Data, we see that a Reverse Neutral Triangle has formed and the post-pattern movement (the downward movement after wave-(e)) has also confirmed it and it seems that BIST100 is preparing for at least a 20-25% correction.
If the beginning of wave-(b) is broken, i.e. the number 7189, the correction of this index can continue to 5705.

XU100/USDTRY Wolfe and HS Formationi mentioned the Wolfe formation in August 2024. After nearly 7 months checked it. IMO it is on track.
Additionally there is also a Head and Shoulders formation nearly with the same target price taking timing in consideration.
NFA. DYOR.

Technical Analysis of BIST100 Index: Examining Trends and PriceIn this technical analysis, we have examined the Istanbul Stock Exchange Index (BIST100) with a special focus on trend lines and price channels. By precisely drawing trend lines, price channels, and linear patterns, key support and resistance levels have been identified. This analysis, using a simple approach without complex tools, provides investors with a clear perspective on the potential future movement of the BIST100 index in the near future.

BIST 100 WEEKLY PROFILESorry guys. But it has Huge bearish diveegences momentum. Large speculators opened many short positions. Also adding more...

XU100 MID TERM EWI expect that this correction is a WXY and we are on the second leg. After finalizing X, I do expect that trend will go south to finalize correction.

xu100XU100 is in contact with the upper resistance of the wedge it entered in December 10. I think it will decline to the lower support, but the target is to return to the 11,000 level with the wedge break.

Narrowing deviations ---> increasing expectancy (close @10.000)
Navigating around white lines: bad idea to think about bearish market
Slowing pace of weekly gains: good idea to support bullish outlook
Approaching bullish market: expected before Q4
Strengthening alpha coefficient: 15.000 in ramge

Short time, target 9000Bist, following weekly chart.
I got a short signal from my power indicator and my targets will be finonacci levels.
TP1 9400
TP2 9000
SL 9870 above, you can stop, but I still prefer t o stop above 10200

Probable correction of bist100 ( Xu100 )#bist100 index has formed an " evening star " candle pattern and this is the probable signal of downtrend. I drew probable bounce zones on #xu100 ( #borsaistanbul ) chart. Blue way, the W bounce seems more probable for now. Not financial advice.

short term bull run continuesbullish OB and sellside liquidity levels in the picture.
not an financal advise, experimental and educational content.
do not open any trades with these ideas.

Bottoming action on XU100The distance between the lower lowers are rapidly decreasing which is a sign of bottoming. Let's see if the market can break higher in a week or two. Then it will be confirmed. Otherwise, it will be useless.

order not filledWith the recent bearish trend, seems like sellside liquidity is taken and now moving to take unfilled orders which magnets the price to its level.
An additional sell position may be added between 9000-9020, that may cause to move your stop-loss about 25% higher.
TP1: 8860
TP2: 8760
Not an financal advise, experimental and educational content.
Do not open any trades with these ideas.

BIST 100 LOOK like want to reverseIn my opinion i thinks its an H&S forming in 4hr time frame with a divergence. lest se if it play out

XU100 rolls back from EMA200 BIST:XU100 : Eliott completes the 5th wave during the downtrend, finalizes downtrend period. We had said that the trend would change within of September, and it did 😎. If it also breaks through the green EMA50, we can say, "The 90-day uptrend has completed 5 days." The fact that it bounced back from the EMA200 should also not be overlooked.

XU100 EWSince the correction seems to be a 5 wave, I expect to see a new leg down after finalizing B wave

BIST100 dolar bazlı wolfe formasyonuYTD. Takip için.
Yükselen takoz ve wolfe formasyonlarının hedefi aynı. Olursa alım için büyük fırsat.

XU100I expect a reaction from the 9600 level at the decision point of the Borsa Istanbul index, otherwise a drop to 9150 levels may be possible according to the news flow. The decision point is 9600. A position should be taken according to this point. If it is passed up, long, if it is passed down, close to 9150, long again. 10985 will be the target in the future.

BIST100 - Funeral 23.08.20244 years of rally is being corrected, it is an exponential correction. Therefore it will be sudden, sharp and strong. It is being accompanied with foreign exchange rate against USD is being devalued, I do expect a sharp turn on that side aswell. Good luck.
