Fibonacci on BISTI have detected that BIST price has been moving according to the fibonacci retracement for several months. Let me explain the whole strategy of the fibonacci retracement and how the price adapts, in order.
BIST index is in a continuous downtrend from 9 March to 3 April. At the end of this downtrend (4712), I drew the Fibonacci retracement, which I received confirmation of return, and I saw that the 0.618 level was 5185 TL. Therefore, a purchase I will make at the bottom and then a sale at 0.618 brought me a profit of 10%.
When the price hit the 0.618 level, I got confirmation of a reversal and removed the old fibonacci and drew a fibonacci from the low on April 3 to the high on April 13. (I wouldn't have done this if I hadn't received the return confirmation.) The 1.618 level (4393) of the fibonacci I just drew became my new target. A short I opened at 5187 brought me a profit of even over 15% when I reached 1.618.
Then I saw a double bottom formation at this level and it was a confirmation of a return for me. Therefore, I drew a fibonacci from the high price on April 13 to the low price on May 5. The 0.618 level (4860) of this fibonacci is also the target for me. When I reach the target, I think I will make a profit of around 10%.
As I see the possibility of a return from the 4860 level, I drew a (not certain) fibonacci price of 0.618 from the bottom price on May 5th. This gives me the next bottom price of 4119 TL, ie 1.618 fibonacci level.
The Fibonacci strategy is generally like this. As you can see, the strategy should be used in conjunction with reversal or breakout confirmations. These confirmations can be taken with candles or formations.
XU100 trade ideas


Lets see when bi escape endsI expect bearish rally will continue till election. Corious to see bottom line and new economy policy. It has to change even existing policians keep governing.

short for the xu100. However, do not forget about the governmentshort for the xu100. However, do not forget about the government's ongoing support for the index.

Turkey, BIST, DefaultNo liquidity of forex currencies, hyperinflation and quantitative easing at it’s reckless form…
There is no escape from inevitable…
Truly painful to look at…

BIST100 XU100 Short Term MovementWell accumulated, stoch rsi and rsi are fine waiting confirm bounce here. Breaking the yellow box is the invalidation.

BIST100 (XU100) Major and Minor ChannelsBIST100 Major and minor channels.
Log-graph.
- Orange channel is there since 1998.
- Purple channel is where we are surfing since Oct 2021. As long as we are above 5075, we are at the upper half of this channel, which is bullish.
- April 21 or 24 is an important date, where we have overlapping channels, one is descending and the other is ascending. If we are above 5155 on Apr 24, i will be short term extremely bullish until the elections.

15 min movements- Small but important negative deviations in base region started
- negativity leads to reaction in favor of bull market

Fake reversal or trend continuation, i bet for a short. Fake reversal or trend continuation, i bet for a short. However, be careful because Turkish State Banks try to fix the XU100. So they can buy some good amount of shares and help it push above the downtrend.

BIST100 XU100 ForecastBased on the information provided, the price has been range-bound for the last 80 days. Additionally, the last range lasted for 120 days before breaking out. This suggests that the current range may continue for some time, and traders should exercise caution when considering trading opportunities.
The technical analysis includes two scenarios: a bullish scenario represented by the blue line and a bearish scenario represented by the red line. Traders should wait for clear reactions from the zones indicated in these scenarios before initiating any trades.
In the bullish scenario, the price would need to break above the upper range boundary and hold above it for an extended period before traders can confidently enter long positions. This could indicate that buyers have gained control of the market, and the price may continue to rise.
On the other hand, in the bearish scenario, the price would need to break below the lower range boundary and hold below it for an extended period before traders can initiate short positions. This could indicate that sellers have gained control of the market, and the price may continue to decline.
Overall, traders should exercise caution when trading in a range-bound market and wait for clear indications of a breakout before initiating any positions. It is essential to monitor the price action closely and adjust trading strategies accordingly to stay ahead of the market.


bist100 is i a critical situationaccording to all stocks situation and high volatility in average market, I personally, see a strong bear .
BUT, according to its chart, I wont sell it short too.

Bullish Engulfing Candle Highly Likely for Tomorrow in BIST100There is a very chance that there will be a bullish engulfing candle and the underlying market will pump +%7-9 in 15th of February.

PSYCHOLOGY OF A MARKET CYCLE : BIST XU100 2020-2023After a bull-market cycle, fueled by Turkiye Central Bank liquidity and Turkiye Wealth Fund assets, politicians and media were touting the continuation of the bull market indefinitely into the future.
It is understandable why mainstream analysis believed the markets could only go higher as there are many signs suggesting the current Wyckoff cycle has entered into its third stage - the distribution phase gained traction.
But Turkiye is experiencing an natural disaster that affects people psychologically and emotionally, leading them to think differently, act differently, and alter the way they make decisions—including economic decisions. In that sense, the psychological impacts of earthquakes may continue to have profound economic impacts long after reconstruction is finished.
The Wyckoff cycle has entered into its fourth, and final stage. Whether, or not, the current distribution phase is complete, is the question we are all working on answering now.
There is a sizable contingent of turkish investors, today who have never been through a real bear market having three stages:
1. Start with a sharp and swift decline.
2. After this decline, there is an oversold bounce that retraces a portion of that decline.
3. The longer-term decline then continues, at a slower and more grinding pace, as the fundamentals deteriorate.
While there is a less of “hope” the Turkish Central Bank’s flood of liquidity can arrest the market decline, there is still a tremendous amount of economic damage to contend with over the months to come.
In the end, it does not matter if you are “bullish” or “bearish.” What matters, in terms of achieving long-term investment success, is not necessarily being “right” during the first half of the cycle, but by not being “wrong” during the second half.

BIST100-Fundemental and TechnicalDiscoloration with RSI.
RSI also supports that the area in circle represents over-bought region.
There should be correction to 4300-4000.
YTD.Only for education. Not an investment suggestion.

BIST100-Formation setClear Shoulder-Head-Shoulder formation in 4h,
In general, indexes are more prone to manupluations unlike majors.
If there wont be a magical shot from somewhere, price might decrease until 4440 as a first step.
Only for educative purposes. Not an investment idea.

Oh sh... here we go again. Be careful.Oh sh... here we go again. Be careful with the long positions. There will be blood.
XU100Yukselen kanalin destegindeyiz, bakalim bu hafta ne olacak.. Ve onumuzdeki secime kadar..
Teknik hedeflerim olup YTD..
We are at he bottom of ongoing trnd.. We will watch this week and till the elections..
Technical analysis my own, shal not be credited as investment advise..

Harmonics & Fibonacci on Turkish IndexIn follow up of BIST:XU100 since Dec 25, 2022;
Previous analysis:
Latest Observations :
Harmonics Bat Pattern; possible reversal zone around 3351;
Harmonics Gartley Pattern; possible reversal zone around 3619;
Fibonacci on Turkish Index; index may stabilize around 3664-3500;
Bearish Divergence

XU100 depends on the reveal of candidate for elections of 14 MayBIST:XU100 wants to float up she needs good news only on the alternate candidate for presidency of Turkey for 14 May 2023 elections. 22 Feburary seems the critical date for decision of the trend. Strong candidate will support a trend up.

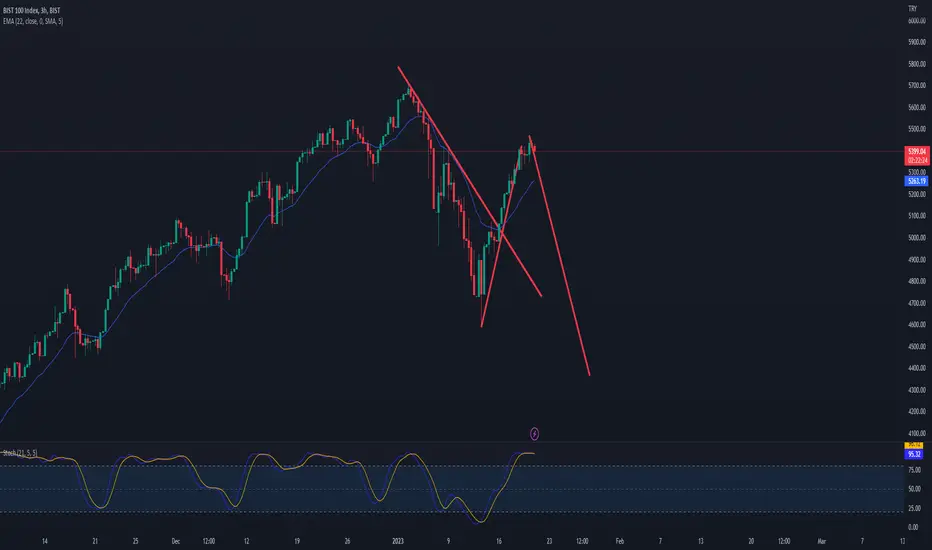
BİST100 (XU100) Double Top + Another Trendline Break Forming?The BIST100 index recently experienced a trendline break, failing to reach the previous trendline and forming a lower angle trendline. This new trendline is showing signs of weakness, as evidenced by the formation of a double top pattern. Given these indicators, it is likely that the BIST100 will experience another trendline break, potentially leading to a retest of the 5000 level. This analysis should be considered as one of multiple factors in making investment decisions, and further research is recommended.
15M Timeframe:
4H TF:

TRIANGLE CORRECTIONBist100 may be heading for a triangle correction in wave 4. It needs to make a record high before the elections in May in Turkiye.

Bist 100 ideaNot investement advise (ytd) it will be test to Red line trends and then will be fall or down to 8xxx or 6xxx
