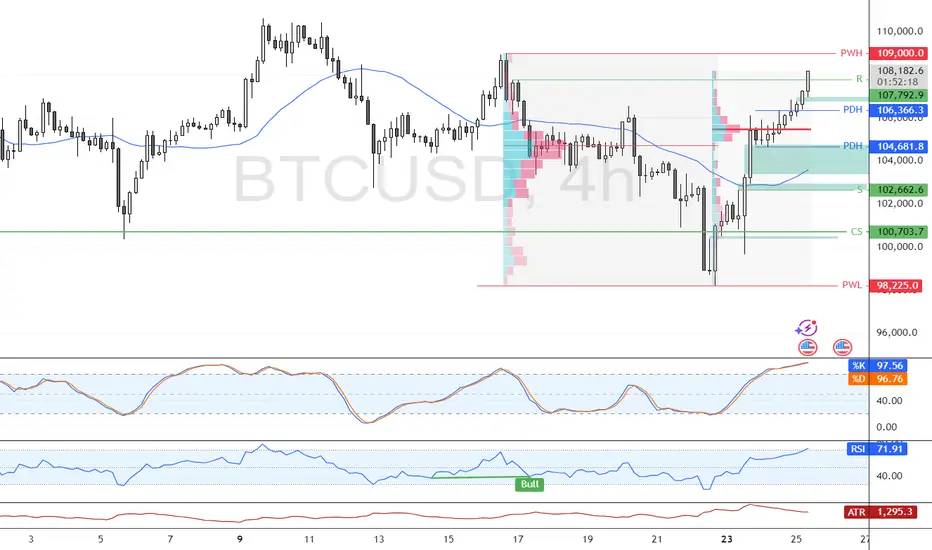
Bitcoin Climbs Above $107K with Overbought Signals in PlayBitcoin closed above the 107,792 resistance after breaking the previous day's high. RSI and Stochastic indicators show overbought conditions, signaling short-term overpricing.
BTC may test the $109,000.00 resistance next, followed by a potential pullback toward $104,618.00, offering a favorable entry point for bulls.
BITCOIN trade ideas
BTC Breakout Alert: Ready for the Next Bullish Wave The BTC/USD 4-hour chart shows a clear breakout above a descending trendline that has acted as resistance since mid-May. After multiple rejections, the price has now broken above the structure, signaling bullish momentum. The Ichimoku cloud confirms support underneath, providing confluence for a potential rally. The bullish breakout is also accompanied by increasing volume and a bullish engulfing pattern near the breakout zone, which adds confirmation. Price is currently consolidating just above the breakout area, suggesting a retest may be forming before further upside continuation. If momentum sustains, higher levels could soon be tested in the coming sessions.
Entry: 109,400
1st Target: 110,000
2nd Target: 111,870

BTC RAGINGBitcoin continues its rally, now pushing toward $107K after a sharp three-day surge. The key development here was a sweep of the range lows just below $100,000, where price wicked down, flushed weak hands, and immediately reversed with authority. That fakeout move set the stage for a strong bounce, triggering what now looks like a classic deviation below support.
From there, Bitcoin ripped higher, reclaiming the critical $105,787 horizontal level and flipping it into support. That level had acted as resistance for much of June, capping upside progress — but now that price is holding above it, the breakout has legs. Importantly, the move also reclaimed the 50-day moving average, further solidifying the bullish case.
Volume is ticking higher as well, adding confirmation to the price action. As long as Bitcoin holds above $105,787, the next upside target sits clearly at $112,000 — the swing high from earlier this month. A breakout above that level could open the door to fresh highs and renewed momentum.
If, however, price falls back below $105K, this rally risks turning into a failed breakout — with a potential revisit to the $100K area. But for now, structure has shifted back in favor of the bulls, and the sweep of sub-$100K lows looks like it successfully reset the market.


$BTC Update CRYPTOCAP:BTC #BTC $106,586 resistance in effect and testing as of now, $104,987 current support. $103,093 key support from here, $107,461 support required to reattempt taking $110,423. Dropping volume on 1D, Previous daily closed trying to follow thru on a bullish engulfing from Monday's close, current 1W looking massive good but it's just the beginning of the week - Watch given S/R.

BTC LONG TP:106,400 24-06-2025Scalping opportunity in progress ⚡️
Entry zone: 105,500
Target zone: 106,400
RR: 1.5
Timeframe: 30m
Estimated duration: 2 hours
We’re jumping in on a quick continuation after the recent pump. The bullish pressure is still there, and this move aims to squeeze a fast gain before the next reversal.
Looking for a short right after if the setup confirms.
We don’t use indicators, we’re not out here drawing lines or cute little shapes — I just give you a clean trade.
If price doesn’t move within the expected time, the setup is invalid.

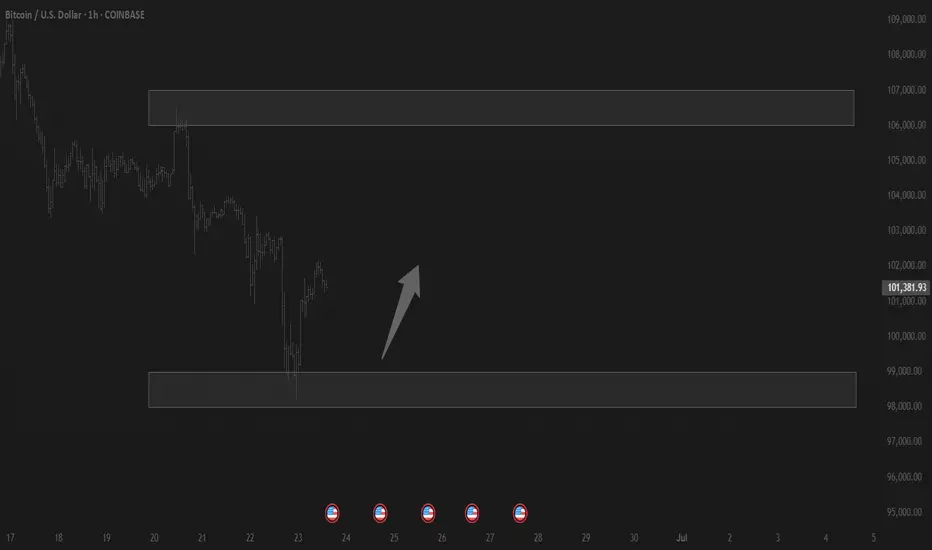
BTC/USD Analysis – Bearish Breakdown Below Key TrendlineBitcoin has officially broken below its long-standing trendline support, indicating growing bearish pressure in the market.
🔍 Key Observations:
Price broke below the ascending trendline and retested it unsuccessfully.
Immediate resistance now stands at $102,879.
Price is currently hovering near $101,231, struggling to reclaim the previous range.
A rejection from resistance could trigger a move toward $99,160, then $96,307, and eventually the key support at $93,678.
📊 Potential Setup:
If BTC fails to break above $102,879, expect a potential lower high formation.
A bearish continuation could unfold, with the market aiming for $96,300–93,600 area.
⚠ Caution: Always manage risk carefully, especially in volatile markets like BTC. Wait for confirmation before entering any trade.

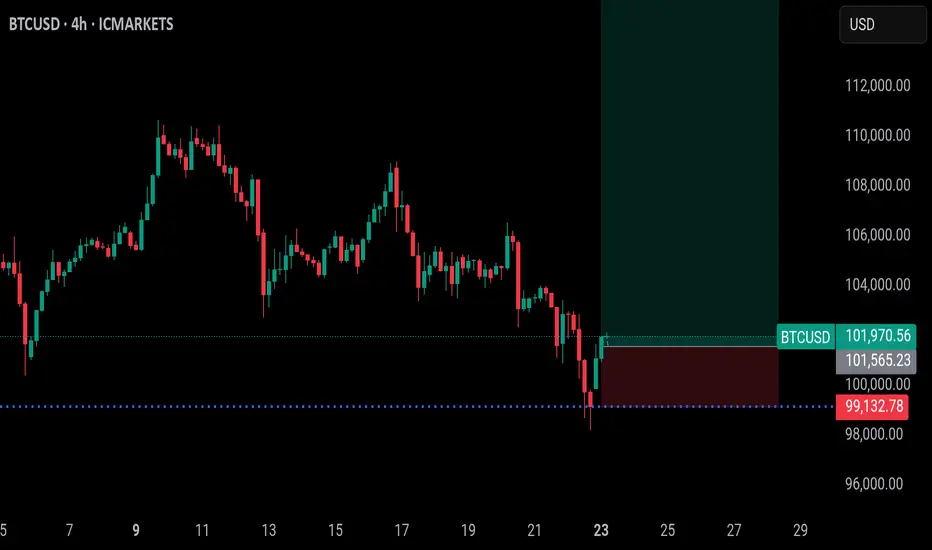
BTCUSD ATH Hunt is onBTCUSD will shoot up very soon. A bullish flag emerging right in time. Trump announces ceasefire and potentially stops WW3, what a Hero. Stock up on some of this coin you're gonna need it.

Trading balanceTrading balance The price of the asset has rebounded from the balance zone. With the prospect of growth into the resistance zone.
BTC To new ATH, Let's bet!For my followers, they know I dont usually write out the reasons for a trade during the week unless on weekends, reason been the nature of my trades. I enter on market orders and then I post, any time wasted to be outlining reasons will make them not to enter the trade.
BTC is still bullish, I know the bears are coming, they always do, I know the cycle will end, it always does but now is not the time. Main reason is, everyone is now bearish.
The chart hasn't also showed bearish signs, just retracement.
I highlighted below 100k as my next POI because of the liquidity there, I've been buying since yesterday, I hope you do too. If not, this is another opportunity.
For those that said R:R is big, Learn to hold your winning trades please, in that way you'll maximize profit and also reduce frequency of trades. If you can't, just open a new account, fund $100 and then trade my signals there. The account will be bigger than your main account by this years ending.
I trade forex too, if you've any question regarding how you'll do this, ask away in the comment section
I will show you how I do it
Now someone said we wont be seeing a new ATH. I think he is very wrong and knows nothing. I will attach a post I made when BTC went below 77k and I was bullish and I outlined the reasons there.
Enjoy
Please, hold this trade.
Follow me as my trades are market orders, so you'll see them no time and enter them on time.
BTC eyes on $97.8k: Last stop before 85.3k Golden Genesis retestShown here is a single fib series in three different time-frames.
The "Genesis Sequence" has called every major turn since 2015.
Clear reactions at each fib confirms our faith in the "Golden Ratio"
Topped at the 111.66k fib, and orbitted the 105k fib for a bit.
Now approaching a critical fib at 97.8k that bulls must fight for.
If it does not hold then we look to the Golden Genesis at 85.3k
$ 97,769.44 is the exact location of next fib.
$ 85,354.35 is the exact location of the Golden fib.
Golden Genesis fibs deserve the respect of a retest.
===================================================================
Previous calls of the Genesis Sequence include these amazingly PRECISE turns:
$111k Top call:
$105k recent Top call:
$73k previous Cylce top:
Hit the FOLLOW and BOOST to encourage more such PRECISE charts.
===========================================================
.

BTC TRADE IDEA 22/06/25There are some places where price needs to ATK
Wait for reversal before chase that gap

Bitcoin: open path to downside?The FOMC meeting and the decision on interest rates, geopolitical tensions and inflation fears are currently the most important topics for investors on financial markets. The crypto market was sort of left behind during the previous week, with some funds outflows as of the end of the week. Current chart looks like seeking the downside, however, the question is whether it is just a short term correction or the market is indeed setting the stage for the higher move toward the downside?
At the beginning of the previous week, BTC tried for one more time to make a push toward the higher grounds, and tested the $108K level. Since there was no strength to sustain this level, the BTC spent the rest of the week looking at the downside. The lowest weekly level was reached on Friday, at $102,6K, but BTC recovered a bit on Saturday till levels modestly above the $103K. The RSI continues to move below the level of 50, indicating that investors are still eyeing the oversold market side. The MA50 continues to diverge from MA200, without an indication that the cross might come soon.
As previously noted, charts are pointing to the probability of a higher move toward the downside for BTC. Lows from the beginning of June might be the first target in this scenario. This would lead BTC toward the price range between the $100K - $101K. There is also some probability for the move toward the opposite side, where BTC will again test the $105K resistance. At this point charts are not pointing to probability for reaching levels higher from the $105K.
Bitcoin - Expecting Liquidity Grab at 102.8k Before Relief MoveMarket Context
After a strong rejection from resistance, price has shown clear signs of internal weakness. We recently got an internal liquidity sweep followed by a sharp move down, confirming a shift in momentum. The market is currently compressing just below a key fair value gap, hinting at further downside before any real bullish structure can form
Internal Sweep and Bearish Pressure
The internal sweep acted as a final inducement before the market sold off. The reaction afterward was clean and aggressive, suggesting that smart money is offloading positions into trapped longs. Price has now stalled in a tight range, and the lack of bullish follow-through adds weight to the idea that lower prices are still on the table.
Fair Value Gap Below as Draw
The unfilled imbalance below, lining up near 102.8k, is acting as a magnet. This level has not been tapped and lines up cleanly with the idea of a final liquidity sweep before any retracement. It would make sense to target this zone to clear out remaining liquidity and rebalance price before reassessing.
Retracement Scenarios After the Sweep
Once that low is swept and the gap is filled, we could see a retracement back into the previous fair value gap around 106k. This could either form a lower high, continuing the broader downtrend, or potentially run the high if there's enough momentum. Either way, the reaction from that level will offer the next major clue on direction.
Key Expectation
Until the low around 102.8k is swept, the bearish narrative remains intact. The cleanest setup would be a liquidity run into that level followed by a reaction that leads us higher, ideally back toward the 106k zone. From there, we’ll watch how price behaves to decide whether a deeper correction or a trend continuation is in play.
Conclusion
Still leaning bearish short-term as long as that gap and low remain unfilled. Once we tap into the 102.8k area, I’ll be watching for a shift that could give us a play back into the 106k gap. It’s all about liquidity, structure, and the cleanest path for smart money to move.
Disclosure: I am part of Trade Nation's Influencer program and receive a monthly fee for using their TradingView charts in my analysis.
Thanks for your support!
If you found this idea helpful or learned something new, drop a like 👍 and leave a comment, I’d love to hear your thoughts! 🚀

You've Already Lost: The Bitcoin Delusion of FOMO and False HopeLet’s get one thing straight: if you’re staring at Bitcoin, squinting past the red flags, and convincing yourself it’s not a Ponzi scheme because of that one shiny feature that screams “legit,” you’re not investing—you’re auditioning for the role of “next victim.” And if your motivation is the fear of missing out (FOMO) or the fantasy of getting rich quick, well... congratulations. You’ve already lost.
The 99%: Red Flags Waving Like It’s a Parade
Let’s talk about the indicators—the ones that make Bitcoin look suspiciously like a Ponzi scheme. No, it’s not technically one, but the resemblance is uncanny:
- No intrinsic value: Bitcoin isn’t backed by assets, cash flow, or a government. It’s worth what the next person is willing to pay. That’s not investing. That’s speculative hot potato.
- Early adopters profit from new entrants: The people who got in early? They’re cashing out while newcomers buy in at inflated prices. That’s the classic Ponzi dynamic: old money out, new money in.
- Hype over utility: Bitcoin’s actual use as a currency is minimal. It’s slow, expensive to transact, and volatile. But hey, who needs functionality when you’ve got memes and moon emojis?
- Opaque influencers: From anonymous creators (hello, Satoshi) to crypto bros promising Lambos, the ecosystem thrives on charisma, not accountability.
- Scam magnet: Bitcoin has been the currency of choice for over 1,700 Ponzi schemes and scams, according to a University of New Mexico study cs.unm.edu . That’s not a coincidence. That’s a pattern.
The 1%: The “But It’s Decentralized!” Defense
Ah yes, the one redeeming quality that Bitcoin evangelists cling to like a life raft: decentralization. No central authority! No government control! It’s the financial revolution!
Except… decentralization doesn’t magically make something a good investment. It just means no one’s in charge when things go wrong. And when the market crashes (again), you can’t call customer service. You can tweet into the void, though.
FOMO: The Real Engine Behind the Madness
Let’s be honest. Most people aren’t buying Bitcoin because they believe in the tech. They’re buying because they saw someone on TikTok turn $500 into a Tesla. FOMO is the fuel, and social media is the match.
Bitcoin’s meteoric rises are often driven by hype cycles, not fundamentals. Tesla buys in? Price spikes. El Salvador adopts it? Price spikes. Your cousin’s dog walker says it’s going to $1 million? Price spikes. Then it crashes. Rinse, repeat.
This isn’t investing. It’s gambling with a tech-savvy twist.
The Punchline: You’ve Already Lost
If you’re ignoring the overwhelming signs of speculative mania and clinging to the one feature that makes you feel better about your decision, you’re not ahead of the curve—you’re the mark. And if your motivation is “I don’t want to miss out,” you already have. You’ve missed out on rational thinking, due diligence, and the ability to distinguish between innovation and illusion.
Bitcoin might not be a Ponzi scheme in the legal sense. But if it walks like one, talks like one, and makes early adopters rich at the expense of latecomers… maybe it’s time to stop pretending it’s something else.
INDEX:BTCUSD NYSE:CRCL NASDAQ:HOOD TVC:DXY NASDAQ:MSTR TVC:SILVER TVC:GOLD NASDAQ:TSLA NASDAQ:COIN NASDAQ:MARA


We need to hold the line! I’m not too bearish just yet
Definitely looking for this line to hold.
Still above 100k
Think we will be just fine
One more week left in the month

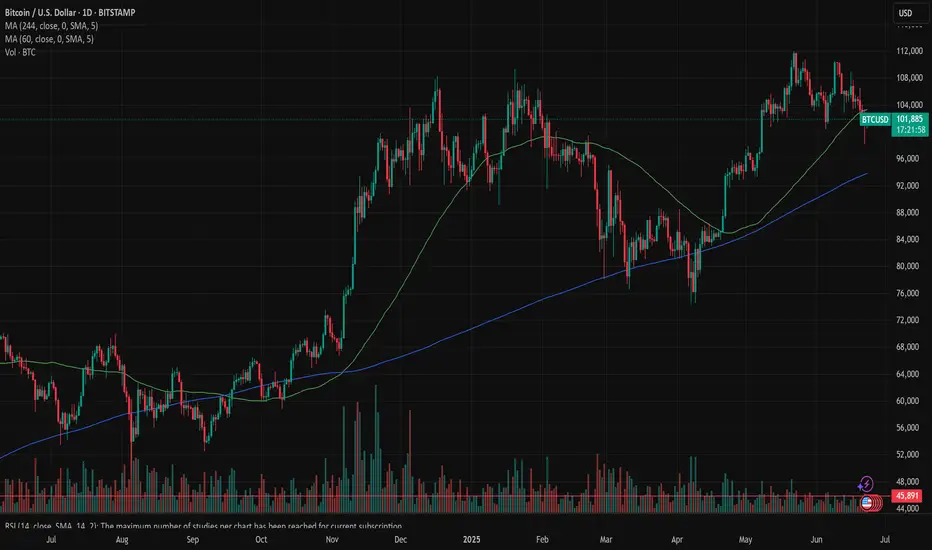
BITCOIN This is the long-term picture. Don't get distracted.Bitcoin (BTCUSD) has been consolidating lately after making a new All Time High (ATH) last month and this is already making part of the market nervous over whether that's the Cycle Top or not.
This is one of those times when it would be best to ignore the short-term noise/ volatility and stick to the long-term picture. And that's exactly what's shown on this chart, with BTC on the 1M time-frame showing the incredible symmetry among its 4-year Cycles, with Bear Markets lasting 12 - 13 months and Bull Markets 35.
Based on that, this Cycle's Top is expected to be priced by October (2025). This also matches the Sine Waves as implied by the 1M RSI, which as been trading within a Channel Down (diminishing returns) since Bitcoin's inception.
So do you also think that we have around 4 months before the market tops? Feel free to let us know in the comments section below!
-------------------------------------------------------------------------------
** Please LIKE 👍, FOLLOW ✅, SHARE 🙌 and COMMENT ✍ if you enjoy this idea! Also share your ideas and charts in the comments section below! This is best way to keep it relevant, support us, keep the content here free and allow the idea to reach as many people as possible. **
-------------------------------------------------------------------------------
💸💸💸💸💸💸
👇 👇 👇 👇 👇 👇

BITCOIN: The $110K Crossroads - Bull vs Bear Battleground! The Setup: "The Healthy Pullback Hypothesis
🔵 BLUE SUPPORT TRENDLINE (Rising from ~$76K)
The Foundation: This ascending support has held multiple tests
Current Status: Price dancing right on this crucial line
Psychology: Bulls' last stand
🔴 RED RESISTANCE CHANNEL (Descending from $112K peak)
The Ceiling: Two parallel resistance lines creating downward pressure
Pattern: Classic bearish channel formation
Volume Profile: Declining volume suggests exhaustion
🟡 YELLOW HORIZONTAL ZONES
Key Level 1: ~$98K (Previous resistance turned support)
Key Level 2: ~$112K (The rejection zone)
🟢 BULLISH SCENARIO (65% Probability)
Setup: Breakout above red channel resistance (~$108K)
🚀 Rocket Ship: Explosive move to $120K+
📉 Reality Check: Deeper correction to $95K-98K range
Entry: $97K - 98K (confirmed breakout)
Target 1: $104K
Target 2: $110K
Stop Loss: $95K
____________________________
⚠️ Risk Disclaimer: This analysis is for educational purposes. Always manage risk and never risk more than you can afford to lose. Markets can remain irrational longer than you can remain solvent! ⚠️

Bitcoin - Will it explode up or down?Introduction
Bitcoin (BTC) is currently trading within a symmetrical triangle pattern, forming a series of higher lows and lower highs. This price action indicates a tightening range as the market approaches the apex of the triangle. A breakout is becoming increasingly likely in the coming days, and traders are now watching closely to see which direction BTC will choose. Will it break to the upside or the downside?
Pattern Trading
The symmetrical triangle has been a consistent feature of BTC’s recent price action. Price has been oscillating between the descending resistance and ascending support trendlines, gradually compressing the range. Based on the current structure, Bitcoin could continue moving within this pattern until around June 26th, when the triangle becomes extremely narrow and a breakout becomes imminent. Historically, such setups can produce false breakouts or “fake-outs,” where the price temporarily moves in one direction before sharply reversing and breaking out in the opposite direction. These moves often trap traders who enter too early, so caution is advised. Market manipulation is not uncommon in these tight formations, making it essential to wait for confirmation before entering a position.
4H Fair Value Gap (FVG)
Bitcoin has recently filled a 4-hour Fair Value Gap (FVG), a zone that often attracts price due to inefficiencies in the market. Now that this gap has been filled, there could be increased selling pressure, potentially pushing BTC back down toward the lower boundary of the triangle. If BTC is unable to break through the resistance created by this FVG, we may see more bearish momentum. However, should BTC manage to break and hold above this imbalance zone, it would be a strong sign of bullish intent and could open the door for a move to the upside. For now, though, this area remains a significant resistance level.
Upside Target
If BTC manages to break out of the triangle to the upside with strong volume and confirmation, the first major resistance level is around $109,000. This would be a logical target for bulls, as it represents a key zone of liquidity and previous interest. A successful move toward this level would confirm the bullish breakout and could set the stage for further gains, depending on broader market sentiment.
Downside Targets
Conversely, if BTC breaks below the lower trendline of the triangle, the first area to watch is around $103,500. This level is where a significant amount of liquidity has built up, and it could act as initial support. However, if that level fails to hold, the next key psychological level to watch would be $100,000. A drop below this milestone could trigger panic selling and further downside, especially if market sentiment turns negative.
Conclusion
At this point, BTC is at a critical juncture, and traders should remain patient as the market decides its next direction. While the current rejection from the 4H FVG suggests some short-term bearish pressure, the overall pattern remains neutral until a confirmed breakout occurs. Trading within the triangle can be risky due to the possibility of fake-outs, so it’s best to wait for clear confirmation before committing to a trade. Stay cautious, manage your risk carefully, and prepare for volatility as Bitcoin approaches a decisive move.
Disclosure: I am part of Trade Nation's Influencer program and receive a monthly fee for using their TradingView charts in my analysis.
Thanks for your support.
- Make sure to follow me so you don't miss out on the next analysis!
- Drop a like and leave a comment!

BTCUSD Sell Setup – 4H Chart AnalysisEntry Zone: 103,061
🔹 Stop Loss: 105,120 – 105,095
🎯 Targets:
• TP1: 100,913
• TP2: 98,886
• TP3: 96,967
🔻 Analysis Summary:
Price recently broke a key support zone and is currently retesting it. A clean bearish rejection from this level provides a high-probability short setup. With clear risk-to-reward levels defined, this trade targets the next key supports.
🛑 Risk Management: Always use stop loss and proper lot sizing.

FROM ATH TO ATH BTC FRACTAL use 3.14The graph is fractal and cyclical. I used the number pi to predict where the atx plus might be, taking into account the fractals for bitcoin from previous ideas and the idea for xrp, where the number pi worked perfectly.

Bitcoin may rebound from support line of wedge and start to growHello traders, I want share with you my opinion about Bitcoin. Initially, the price was trading inside a well-defined range, moving sideways with repeated rejections from both support and resistance. After several attempts to stay above the support zone, BTC finally broke down and sharply declined below the 104000 level, entering the buyer zone. However, the decline was short-lived. Price quickly rebounded from the lower boundary and formed a strong bullish candle, suggesting that buyers were still active. After this recovery, BTC began forming a wedge pattern, with a gradually narrowing structure between the resistance line and the ascending support line. This kind of price action typically signals a buildup of pressure and potential breakout. Currently, BTC is once again testing the support line of the wedge and hovering near the buyer zone, where it previously reversed. This level has proven significant and is now being retested. Given the current structure, the wedge formation, and price behavior near the support, I expect BTC to rebound from this zone and start climbing back toward the upper resistance area. My current TP 1 is set at 106800 points, which aligns with the mid-level of the previous impulse zone and the inner resistance of the wedge. Please share this idea with your friends and click Boost 🚀
Disclaimer: As part of ThinkMarkets’ Influencer Program, I am sponsored to share and publish their charts in my analysis.
