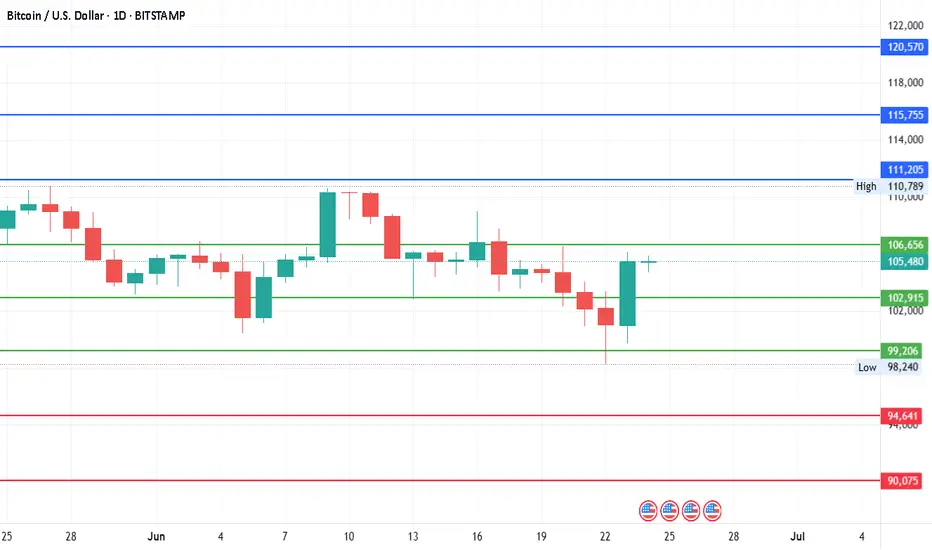
#Bitcoin - Pivot is $102915 | Target $125385 or $80445 ?Date: 24-06-2025
#Bitcoin
Current Price: 105375
Pivot Point: 102915.00 Support: 99206.48 Resistance: 106655.63
#Bitcoin Upside Targets:
Target 1: 111205.31
Target 2: 115755.00
Target 3: 120570.00
Target 4: 125385.00
#Bitcoin Downside Targets:
Target 1: 94640.74
Target 2: 90075
Target 3: 85260
Target 4: 80445.00
BITCOIN trade ideas
BTCBTC will be moving sideways and a drop for the next few days.
Disclosure: We are part of Trade Nation's Influencer program and receive a monthly fee for using their TradingView charts in our analysis.

BITCOIN Is this just a giant Bull Flag??Bitcoin (BTCUSD) saw a strong sell-off yesterday in the aftermath of the U.S. strike in Iran and fears of retaliation, but in later hours recovered some of the lost ground. The recovery is being extended into the Asian and early E.U. hours today and the emerging Channel Down pattern already draws strong similarities with the one in December 17 2024 - January 13 2025.
Both broke below their respective 1D MA50 (blue trend-lines) to form a Lower Low, which in the case of Jan 2025, it initiated a rebound that tested the All Time High (ATH) Resistance. See also how similar their 1D RSI patterns are, testing the same Support level too (41.20).
Given that this time the uptrend has been much shorter since the April 07 2025 Low, this Channel Down may be nothing but a giant Bull Flag in the middle of a standard Bull Cycle Leg. Until confirmed with a 1W candle closing above the ATH Resistance though, the medium-term Target is $111900.
Notice also the formation today of a 1D MA100/200 Bullish Cross, the first since November 13 2024.
So what do you think? Is $111900 your short-term Target? Feel free to let us know in the comments section below!
-------------------------------------------------------------------------------
** Please LIKE 👍, FOLLOW ✅, SHARE 🙌 and COMMENT ✍ if you enjoy this idea! Also share your ideas and charts in the comments section below! This is best way to keep it relevant, support us, keep the content here free and allow the idea to reach as many people as possible. **
-------------------------------------------------------------------------------
💸💸💸💸💸💸
👇 👇 👇 👇 👇 👇

Bitcoin are heading to 114k or 92k A quick little analysis on BTC, we can either push up higher to 114k levels breaking new highs is a must for price action to validate bill swing. However if we break a couple lows be prepared for 92k run down
Kris/ Mindbloome Exchange
Trade Smarter Live Better

BTCUSD – Price Approaching The Edge of the Channel📍 BTCUSD – Price Approaching The Edge of the Channel
Bitcoin has surged sharply from the lower boundary of its descending channel and is now reaching another “Edge” — the upper resistance line.
🎯 Two Key Scenarios:
🟩 Bullish Breakout: A clear breakout above ~$108,000 with strong volume could initiate a new leg toward $111K and beyond
🟨 Bearish Rejection: Failure to break the channel may lead to a corrective wave back toward $103K or lower
This is a classic "decision point" — where market structure and momentum meet supply and resistance.
—
#BTCUSD #Bitcoin #CryptoTrading #TechnicalAnalysis #PriceAction #TheEdge #ChannelTrading #EMA #BitcoinResistance #MJTrading #CryptoSetup #SwingTrade #MarketStructure #BreakoutOrRejection #KeyLevel #TrendWatch

Bitcoin Price Chart Analysis (30-Min, BITSTAMP🔍 Key Observations:
1. Resistance Zone (106,500–107,000):
Price is testing a strong horizontal resistance area, marked by the green rectangle.
This zone has acted as resistance multiple times (highlighted with orange circles), suggesting supply pressure.
2. Triple Top Formation:
The three orange circles mark failed breakout attempts at the resistance level, forming a triple top pattern, a bearish reversal signal.
Each top is followed by a price drop, showing seller dominance near this zone.
3. Current Price Action:
Price is currently at 106,777, near the resistance peak again.
A downward arrow points to a projected target of 104,399, implying a potential short-term bearish move if rejection happens again.
4. Support Zones:
104,399 is marked as a short-term target and potential support level.
A major support zone also exists around the 100,000 level, indicated by the green horizontal box and upcoming economic events (red/blue news icons).
5. Trendlines & Patterns:
Earlier trendline breakouts (rising wedge and falling wedge) led to short rallies and corrections.
The most recent bullish move seems to be losing momentum at this resistance.
---
📉 Conclusion:
The chart suggests a bearish bias in the short term unless Bitcoin breaks and holds above the 107,000 resistance level.
If rejected again, the price may fall toward the 104,399 target, and possibly lower if bearish momentum strengthens.
Traders may look for confirmation (e.g., bearish candlestick patterns, volume drop) before entering short positions.

BTCUSD 4-Hour Analysis – Sell Setup IdeaCurrently, the trend on BTCUSD is bearish. On the 4-hour chart, I’m watching for a reaction at the Balanced Price Range (BPR) zone. This area aligns with a daily Rebalanced Breaker (-RB), adding higher time frame confluence.
In addition to the BPR, there’s an Order Block (OB) within the same region, and a nearby swing high, which strengthens the case for a bearish reaction. If price respects this zone, I expect continuation to the downside targeting the 98,000 and the 96,000 price level.

BITCOIN All boxes checked. Couldn't be more bullish than this!Bitcoin (BTCUSD) has filled numerous bullish conditions with the latest being holding the 1D MA50 (blue trend-line) as Support. This is basically the 3rd time testing and holding it since June 05. Even if that doesn't hold, we have the 1D MA200 (orange trend-line) directly below it as the ultimate long-term Support.
This trend-line just so happens to be exactly on the neckline of the Right Shoulder on the long-term Inverse Head and Shoulders (IH&S) pattern that has been in development since December 17 2024.
On top of all these, the market also formed a 1D Golden Cross a month ago, always a strong long-term bullish signal. IH&S patterns typically target their 2.0 Fibonacci extension, which sits at $168000.
Is that another indication that Bitcoin is going after 150k at least on its next run? Feel free to let us know in the comments section below!
-------------------------------------------------------------------------------
** Please LIKE 👍, FOLLOW ✅, SHARE 🙌 and COMMENT ✍ if you enjoy this idea! Also share your ideas and charts in the comments section below! This is best way to keep it relevant, support us, keep the content here free and allow the idea to reach as many people as possible. **
-------------------------------------------------------------------------------
💸💸💸💸💸💸
👇 👇 👇 👇 👇 👇

Ascending Inverse H&S on the BTC weekly chartThe longer it takes to break above this neckline the higher the breakout target will be. I have arbitrarily placed the measured move line at July 18th 2025. If the breakout were to happen on that day the measured move target is around 208k, which could take quite awhile to reach or if we entered a truly hyperparabolic blow off top we could reach such a target way quicker than when the dotted measured move line reaches it. *not financial advice*

BUY BTCUSDBitcoin (BTC/USD) is showing signs of a strong bullish reversal off a major demand zone at $98,000.**
If price holds above this level and confirms with continued bullish candles, the likely trajectory is toward the resistance zone around $110,000–$111,200.
The forecast structure suggests a clean trend recovery pattern. However, manage risk tightly — as a breakdown below the demand zone could flip the narrative to bearish.

Thief Trader Setup: Robbing the BTC/USD Market Reversal🏴☠️💰 Bitcoin Heist Blueprint: BTC/USD Robbery Plan by the Thief Trader Crew 💰🏴☠️
(Swing & Day Trade Outlook – Clean Entry, Clean Exit, No Fingerprints Left Behind)
🌟 Hi! Hola! Ola! Bonjour! Hallo! Marhaba! 🌟
To All Market Raiders & Silent Money Makers 🤑💸💰✈️
This isn't your average BTC/USD analysis — this is a strategic market heist, crafted from the Thief Trading Playbook.
We're planning a clean operation based on both technical setups and fundamental awareness.
Let’s enter smart, exit faster, and leave no trace — just profit. 🏆
🎯 THE GAME PLAN: Unlocking the BTC/USD Vault
📈 Entry – “The Vault’s Cracked Open!”
The plan kicks off with retest entries on the 15 or 30-minute chart.
Sell limits should be placed around recent highs or lows where market momentum pulls back.
Precision and patience are your tools.
🛑 Stop Loss – Backup Escape Route
Use the 1D swing high/low (e.g., 104.500) as your SL zone.
Position size smartly, factoring in risk %, lot size, and number of active orders.
🏁 Target – 94.000 (Or Bail Out Before It Gets Hot)
Don’t stick around too long — cash out near the zone or before if price slows or traps emerge.
Secure the bag, vanish before resistance bites back.
🧲 Scalpers – Quick In, Quick Out!
Stick to the short side only — short the bounces, trail your SL, and move with stealth.
Big players can strike straight; others can shadow the swing crew and trail behind with protection.
🧠 Why This Works – Market Pulse
BTC/USD is facing overbought pressure, consolidation traps, and is nearing a critical MA Zone where reversals tend to form.
Momentum shows signs of weakening, and the bears are regrouping — that’s where we slip in and out.
Supporting Factors Include:
Macro trends
Fundamental sentiment
COT positioning
On-Chain signals
Intermarket flow
Key psychological levels
🔍 All these build the narrative behind this bearish setup. This is more than just price action — it's a calculated move.
⚠️ Trading Risk Alert: Stay Off the Radar During News Drops 📰🚨
Avoid new entries during major news events — increased volatility = increased risk.
Use trailing stop-losses to lock in profits while staying protected during spikes.
❤️ Like the Plan? Power the Crew!
If this setup helped you see the market differently, hit the 💥Boost Button💥.
Every like supports the effort and helps sharpen our future plans.
Trade with style, move with purpose — Thief Trader Style.
🚀 Stay tuned for the next setup from the shadows. Until then — stay sharp, stay strategic, and always protect your profits. 🐱👤💰📉📈

BTCUSD Descending channel breakout bullish possible from SupportBTCUSD Breakout Alert!
1H Timeframe Analysis
Bitcoin has broken out of the descending channel with a strong bullish candle — signaling a potential reversal from the key demand zone around 103,600.
📈 Technical Targets:
🔹 First Target: 108,000
🔹 Second Target: 110,000
This breakout could offer a solid long opportunity, but as always — manage risk wisely! ✅
💬 What’s your bias?
❤️ Like | 🔁 Share | 💭 Comment
📲 Join us for more real-time updates and insights!
#BTC #Bitcoin #CryptoTrading #TechnicalAnalysis #Breakout #BullishMomentum

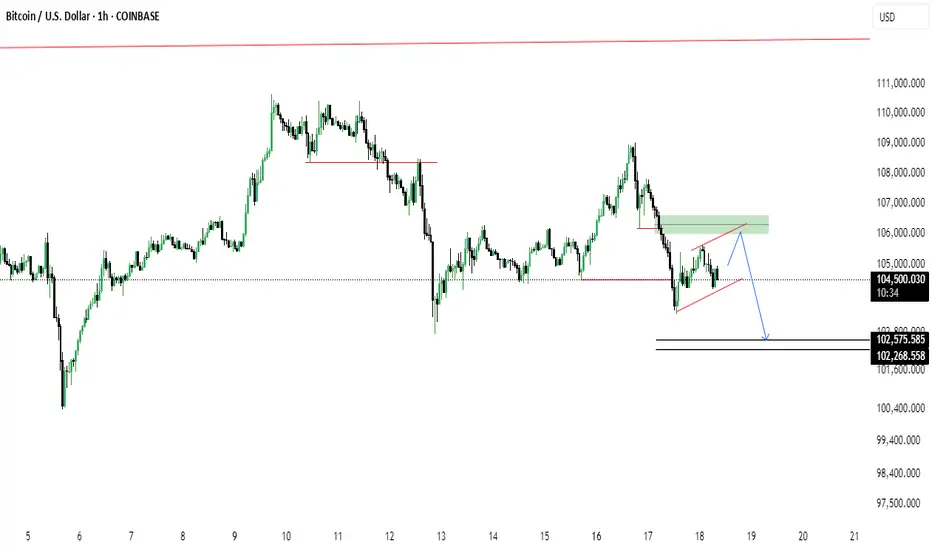
BTC/USD Rising Wedge Breakdown Ahead?Bitcoin shows signs of a potential bearish reversal as price forms a rising wedge beneath a key supply zone. After a recent drop, price is retesting the 106k area (green zone), possibly setting up for continuation to the downside.
🔹 Rising wedge pattern near resistance
🔹 Bearish retest at previous support turned resistance
🔹 Potential drop targets: 102,575 and 102,268
🔹 Break below wedge support could accelerate the fall
103 to 101K trade and reverse H&S patternMorning folks,
So, our Thu setup is done perfect, both targets are met and even more. Now we consider two different fast trades on BTC.
Now context remains bearish and 103K is rather strong 4H resistance area. So, first trade is scalp "Sell" from ~ 103K with "at least" target of 101K. In fact, choosing of 101K as a minimal target is based on the 2nd trade.
2nd trade is potential reverse H&S is sentiment on the market will start changing. But this is not the fact yet. That's why I place downside arrow here as well, if H&S will not be formed or start failing, BTC could drop lower so, downside trade might be even better.

BTC Weekly Outlook - paving the wayBTC Weekly Outlook
In this week's forecast, we're observing a structured plan grounded in historical monthly Bitcoin data and liquidity dynamics. With MH (Monthly High) and ML (Monthly Low) clearly marked, this scenario outlines a potential roadmap for price action through short-term liquidity movements and higher timeframe rebalancing.
Phase 1: Retrace to 4H BPR and Weekend Liquidity (Green Path)
The first part of the projection anticipates a minor upward move early in the week, ideally on Monday or Tuesday. This rally would target the 4H Bearish Price Range (BPR) and weekend liquidity, which are areas where price often moves to fill orders left unfilled during lower volume periods.
The blue box around the BPR highlights a key short-term zone of interest. Inside it lies the OTE level and the midpoint of the prior range, both typically offering reactions as market participants attempt to position themselves at favorable prices before larger moves unfold. A move into this area would likely be followed by a rejection, setting up for a deeper move lower.
Phase 2: Distribution and Breakdown Toward Monthly Statistical Targets (Orange to Green)
After reacting to the 4H BPR area, the expectation is for a broader move down through the rest of the week. This would take price below ML (Monthly Low) and into deeper liquidity zones where historical data suggests higher probabilities of price interaction.
Two key levels are marked based on monthly performance statistics:
TP1 at the first 90 percent confidence level, where price could pause or consolidate.
FULL TP deeper down, near a liquidity-rich area that aligns with a Weekly Imbalance (W IMB). This would be a logical place for larger participants to begin building longer-term positions.
Phase 3: High Timeframe Discount and Reversal
Once price reaches the imbalance, the projection expects a shift in momentum. This region represents a higher timeframe discount, where order books are more likely to begin filling for longer-term positions.
From here, the green path resumes, suggesting a reversal and a sustained move upward. If this plays out, BTC would:
-Complete a full liquidity sweep below ML
-Accumulate at lower prices where there is room to fill larger buy orders
-Begin a strong push upward, potentially leading toward new all-time highs
This sequence is not only logical from a liquidity perspective but is also statistically supported by how BTC typically behaves around monthly lows and key imbalances. The forecast reflects a market that needs time and space to build positions before initiating the next major leg up.

BTCUSD Continues Falling DownBitcoin (BTC) price remains steady above a key support level, trading slightly above $106,000 at the time of writing on Friday. The uncertainty looms as geopolitical tensions between Iran and Israel show no sign yet of an exit strategy from either side.

Bitcoin - We have to see new highs now!Bitcoin - CRYPTO:BTCUSD - is now at the previous highs:
(click chart above to see the in depth analysis👆🏻)
It could really not be more exciting on Bitcoin at the moment. With the current "all or nothing" potential breakout or double top creation, we will either see a bullrun or a bear market. So far, bulls are still strong, so the chances of a breakout luckily remain higher.
Levels to watch: $100.000
Keep your long term vision!
Philip (BasicTrading)

BTC Short Re-entry with beautifull RR/Stop loss.Who follow our community know this trade story already- We got BE stoppage and now is most beautifull opportunity to make SHORT trade with very good RR / Stop loss.
If we will not see fast De-escalation with Middle East conflict we are going to 93k easy!
#BTCUSDT
We are reentering.
ENTRY: 105586
SL: 107262
TP: 96166.8
Follow me and you will see more and more good trade ideas
Please don't use big leverages and be carefull!

Bitcoin (BTC): Buyers Took Back Control Over $100KBitcoin has bounced and showed some buyside volume near major support area near $100K. After the re-test of 100EMA where price dipped lower than $100K we have had a decent recovery every since.
Monday is starting strong with price jumping back above $100K and most probably we will see some fruther buyside dominance from here.
Swallow Academy

BTC SidewaysBTC is in a distribution phase for a while now.
Sideways for the rest of the year.
My average selling price is ~103.000$.
It was a nice ride.
I am out of this! ✌

BTC BULLISH FLAG AND POLE PATTERN 135,000$ TARGETAs seen in the charts, BTC is currently forming a flag and pole pattern.
Expect price to cover one last liquidity sweep before pumping to the 135-140k price range.
ESH.

June 25 Bitcoin Bybit chart analysisHello
This is Bitcoin Guide.
If you "follow"
You can receive real-time movement paths and comment notifications on major sections.
If my analysis was helpful,
Please click the booster button at the bottom.
This is the Bitcoin 30-minute chart.
Nasdaq indicators will be announced at 11 o'clock shortly.
Nasdaq is rising vertically + renewing its all-time high.
Accordingly, I ignored the weekly MACD dead cross and
proposed the strategy for the pattern by substituting Tether dominance.
Although it is not visible on the screen,
I created today's strategy with the condition of maintaining the long position of $100,587.9 that was confirmed on the 23rd.
* One-way long position strategy when the red finger moves
1. $106,746 long position entry section / When the purple support line is broken
or when section 2 is touched, stop loss price
2. $108,66 long position 1st target -> Good 2nd -> Great 3rd target price
When section 1 at the top touches, it can be connected to an upward trend,
and section 2 is a sideways market.
At the very bottom and the very top,
I have indicated the maximum possible trend until tomorrow afternoon.
Up to this point, I ask that you simply use my analysis for reference and use only
I hope that you will operate safely with the principle of trading and stop loss.
Thank you.

Super high risk setup BTC with 60 R:RIt looks like BTC is about to close the weekly candle above 106K.
If the bulls are still in control, they need to act very soon. The 100K support level has been successfully retested, and now could be the time for a move upward.
📈 Trade Setup (Educational Purpose Only):
Entry: 106,040
Stop Loss: 105,431
Target: 144,000
Risk-Reward Ratio: 1:60
This is a super high-risk setup, but the potential reward is significant. Proceed with caution and always do your own research.
